Head and Shoulder pattern in Polycab on hourly timeframeHead and Shoulder pattern in Polycab on hourly timeframe chart. A breakout is imminent as the overall tone of the market is bullish. A short term swing trade is on.
Targets are: 1. depth of right shoulder, 2. depth of the head.
Stop Loss: close below previous day low (for F&O), low of right shoulder for cash trades.
PS: I am holding a long position.
Longtrade

Big market fluctuations at the end of the year⭐️ Smart investment, Strong finance
⭐️ GOLDEN INFORMATION:
The price of gold (XAU/USD) experienced a significant reversal during Monday's trading session, dropping by approximately $125 after initially surging to a new record high around the $2,144-2,145 range. However, the sharp decline halted near the $2,020 level as investors increasingly acknowledged that interest rates in the United States (US) have reached their peak. Additionally, market participants have been factoring in the possibility of a more accommodative stance from the Federal Reserve (Fed) and an increased likelihood of a rate cut by March 2024.
⭐️ Personal comments NOVA:
After Monday's crazy trading session. Prices have decreased around the 2020-2050 region. At the end of the year, Gold has large and erratic fluctuations.
There will be short-term Scalping signals before Gold stabilizes and has a clear upcoming trend
⭐️ SET UP GOLD PRICE:
🔥BUY GOLD zone: $1995 - $1997 SL $1990
TP1: $2010
TP2: $2020
TP3: $2032
🔥SELL GOLD zone: $2073 - $2075 SL $2083
TP1: $2065
TP2: $2055
TP3: $2047
⭐️ Technical analysis:
Based on technical indicators EMA 34, EMA89 and support resistance areas to set up a reasonable BUY order.
⭐️ NOTE:
Note: Nova wishes traders to manage their capital well
- take the number of lots that match your capital
- Takeprofit equal to 4-6% of capital account
- Stoplose equal to 2-3% of capital account
- The winner is the one who sticks with the market the longest

Going Long on GODS. Two Targets.My followers have been tracking GODS the last several weeks and some of them have made out like a bandit with these recent pumps. Just a few weeks ago it was at 14 cents. My entry today was 38 cents which is approx. 170% above where we started on this one. And I love the volatility on this chart! Though I wasn't expecting such a tremendous break to the upside of that ascending channel, the market bulls have proven they have a ton of energy left for more. We can see another bull flag being formed right now.
I will probably trade this one like so:
- Take half at around 48 cents and move my stops up to break even.
- Let the remainder ride trailing my stops along the way.
- Final target will be 62 cents.
- Current SL is 31.6 cents to be adjusted as we go.
- Risk Reward Ratio is currently 4/1
Not fin advice.
Best,
Stewdamus

New peak of Gold is established !! Amazing⭐️ Smart investment, Strong finance
⭐️ GOLDEN INFORMATION:
The price of gold (XAU/USD) continues to strengthen after a notable rally in the past few weeks, reaching a new all-time high around the $2,144-2,145 range during Monday's Asian session. However, it has since retraced some of its gains and is currently trading below the $2,100 level, still showing a 0.70% increase for the day. The rise in US Treasury bond yields has attracted buyers to the US Dollar (USD), leading to profit-taking by gold bulls due to overbought conditions on the daily chart. Nonetheless, the expectation that the Federal Reserve (Fed) will no longer raise interest rates and might begin easing its monetary policy by the first half of 2024 could continue to support gold, which does not yield interest.
⭐️ Personal comments NOVA:
Start the trading session with a crazy price increase. Officially reached a new peak
Currently, prices are adjusting to stabilize, creating balance in the market
⭐️ SET UP GOLD PRICE:
🔥BUY GOLD zone: $2070- $2072 SL $2067 scalping
TP1: $2077
TP2: $2082
TP3: $2090
🔥BUY GOLD zone: $2053 - $2055 SL $2045
TP1: $2060
TP2: $2070
TP3: $2080
⭐️ Technical analysis:
Based on technical indicators EMA 34, EMA89 and support resistance areas to set up a reasonable BUY order.
⭐️ NOTE:
Note: Nova wishes traders to manage their capital well
- take the number of lots that match your capital
- Takeprofit equal to 4-6% of capital account
- Stoplose equal to 2-3% of capital account
- The winner is the one who sticks with the market the longest

ZIL Perfect 0.702 Fib Confirmation! Not many know about OTE ;)Zilliqa USDT
OTE stands for Optimal Trade Entry. It's our secret weapon.
OTE is the Fib level between 0.786 and 0.618. It is 0.702 and it has been my best friend in trading for a long time (apart from John lol).

Gold officially has a new peak, increasing strongly✍️ NOVA hello everyone, Let's comment on gold price next week from 4/12 - 8/12/2023
🔥 World situation:
Last Friday, after the PMI news and the FED meeting, the information was not good for the dollar, it witnessed a new milestone for Gold.
Gold price reaches a new peak in 2075. This is a previously forecast result at the end of 2023.
Although information about the war between Ukraine and Israel has gradually decreased, it is still happening. That is also the motivation for Vang to continue to increase strongly
🔥 Identify:
Currently, buying power is still very strong. Price is in a nice technical zone to continue increasing
December will still witness new record high points for Gold
🔥 Technically:
Based on the resistance and support areas of the gold price according to the D1 frame, NOVA identifies the important key areas as follows:
New Resistance: $2100, $2150
Support : $2051, $2027, $2005
🔥 NOTE:
Note: Nova wishes traders to manage their capital well
- take the number of lots that match your capital
- Takeprofit equal to 4-6% of capital account
- Stoplose equal to 2-3% of capital account
- The winner is the one who sticks with the market the longest

short term positive Longprice movent to $95 mid end December!!! Alibaba has been beaten up past month or so its looking like a reversal also xabcd pattern showing up movement as well,

USD/CAD!! New week for recovery early December✍️ NOVA hello everyone, Let's comment on USDCAD price next week from 4/12 - 8/12/2023
🔥 World situation:
The Canadian Dollar (CAD) is currently experiencing upward movement in trading on Friday, once again strengthening against its primary counterpart, the US Dollar (USD). This comes after Canadian employment data surpassed market expectations by a significant margin. Throughout the week, the Canadian Dollar has been one of the best-performing currencies, exhibiting a 1% increase against the US Dollar since Monday's opening rates.
In November, Canada witnessed nearly double the number of job additions compared to the median market forecast. Approximately 25,000 new positions were created, surpassing the projected 15,000 and outpacing October's 17,500 new jobs.
🔥 Identify:
A week without much important news about CAD, the price is moving towards a fairly strong support zone along with the resistance zone according to FIBONACCY, setting up a BUY signal.
🔥 Technically:
Based on the resistance and support areas of the USDCAD price according to the D1 frame, NOVA identifies the important key areas as follows:
Resistance: 1.35800 ; 1.37800
Support : 1.34450
🔥 NOTE:
Note: Nova wishes traders to manage their capital well
- take the number of lots that match your capital
- Takeprofit equal to 4-6% of capital account
- Stoplose equal to 2-3% of capital account
- The winner is the one who sticks with the market the longest

Start December. PMI impact on Gold price⭐️ Smart investment, Strong finance
⭐️ GOLDEN INFORMATION:
During the Asian session on Friday, there is a noticeable increase in interest in the price of gold (XAU/USD), leading to a partial recovery from the losses experienced the previous day. The current value of this precious metal is approximately $2,040, representing a modest increase of 0.15% for the day. It is worth noting that this places the price within close proximity to its highest level since May 5, which was reached on Wednesday. Recent data from the United States (US) reveals that inflation rates have continued to decrease in October, while the labor market has shown signs of slowing down. These developments support the belief that the Federal Reserve (Fed) will no longer pursue interest rate hikes. This dovish outlook has become a significant contributing factor in the positive performance of gold, which does not offer any yield.
⭐️ Personal comments NOVA:
With good forecasts for the dollar, bad for Gold after today's PMI news. Gold is still in the accumulation phase, sideways to have a new breakthrough in December
⭐️ SET UP GOLD PRICE:
🔥BUY GOLD zone: $2015 - $2017 SL $2007
TP1: $2027
TP2: $2040
TP3: $2052
🔥SELL GOLD zone: $2060 - $2062 SL $2070
TP1: $2050
TP2: $2040
TP3: $2030
⭐️ Technical analysis:
Based on technical indicators EMA 34, EMA89 and support resistance areas to set up a reasonable BUY order.
⭐️ NOTE:
Note: Nova wishes traders to manage their capital well
- take the number of lots that match your capital
- Takeprofit equal to 4-6% of capital account
- Stoplose equal to 2-3% of capital account
- The winner is the one who sticks with the market the longest

GBPCAD!! 1/12 News supports price increase⭐️ Smart investment, Strong finance
⭐️ GBPCAD INFORMATION:
Today, waiting for 2 important news about CAD currency. It is expected that the figures will be favorable and support the uptrend.
Besides, the old support zone is supportive and the price does not have much motivation to decrease further
⭐️ Personal comments NOVA:
From the expected economic and technical results, both want prices to recover. NOVA will set up a BUY signal
⭐️ SET UP GBPCAD PRICE:
🔥BUY GBPCAD zone: 1.71100 - 1.71000 SL 1.70600
TP1: 1.71300
TP2: 1.71600
TP3: 1.72000
⭐️ Technical analysis:
Based on technical indicators EMA 34, EMA89 and support resistance areas to set up a reasonable BUY order.
⭐️ NOTE:
Note: Nova wishes traders to manage their capital well
- take the number of lots that match your capital
- Takeprofit equal to 4-6% of capital account
- Stoplose equal to 2-3% of capital account
- The winner is the one who sticks with the market the longest

After today's PCE news, Gold has reached 2060 ?⭐️ Smart investment, Strong finance
⭐️ GOLDEN INFORMATION:
The price of gold is currently hovering around $2,040 per troy ounce during the Asian session on Thursday. After reaching a six-month high of $2,052 on Wednesday, the value of the yellow metal has retreated. This decrease in gold's price suggests a possible shift in market sentiment or profit-taking following the recent rally.
Gold faced challenges due to a modest rebound in the US Dollar (USD). The US Dollar Index (DXY) is struggling to maintain its gains and is currently around 102.80. In the previous session, the USD successfully ended its four-day losing streak, thanks to stronger-than-expected data on US Gross Domestic Product Annualized, released by the US Bureau of Economic Analysis. The third-quarter US GDP Annualized growth rate increased by 5.2%, surpassing the previous reading of 4.9% and exceeding the market consensus of 5.0%.
⭐️ Personal comments NOVA:
All technical parameters and economic data support the continued increase in Gold prices. Today continue to wait for the next peak price range
⭐️ SET UP GOLD PRICE:
🔥BUY GOLD zone: $2015 - $2017 SL $2010
TP1: $2030
TP2: $2045
TP3: $2060
🔥SELL GOLD zone: $2060 - $2062 SL $2070
TP1: $2054
TP2: $2045
TP3: $2040
⭐️ Technical analysis:
Based on technical indicators EMA 34, EMA89 and support resistance areas to set up a reasonable BUY order.
Currently, according to the long time frame H4, H1, the price range is still fluctuating stably above the average line EMA 34, 89, showing that the uptrend is still the dominant trend.
Prioritize BUY signals
⭐️ NOTE:
Note: Nova wishes traders to manage their capital well
- take the number of lots that match your capital
- Takeprofit equal to 4-6% of capital account
- Stoplose equal to 2-3% of capital account
- The winner is the one who sticks with the market the longest

BAC to LONG?BAC long term profit ? A popular stock + Above the average line 150 + Breaking a downtrend line + Year-end rally in the banking sector?
Only an idea and not a recommendation for trading!

GPBUSD FLYING 🚀😃hello traders what do you think about this analysis trading ideas 💡😁💡
Gpbusd) this week analysis trading ideas 💡💡
follow support and resistance Levels ✔️
Support levels 1.22000
Support levels 1.24000
Support levels 1.25000
Resistance levels 1.26101
Resistance levels 1.26745
Resistance levels 1.27000
Follow up with my trading ideas 💡😁💡

USD/CAD! 28/11 support zone BUY NOW ⭐️ Smart investment, Strong finance
⭐️ USDCAD INFORMATION:
The USD/CAD continues to decline for the third straight session, trading below the psychological level of 1.3600 during Tuesday's Asian session. The Canadian Dollar (CAD) receives some support from the rise in Crude oil prices and positive market sentiment.
Currently, the price of Western Texas Intermediate (WTI) has broken its four-day losing streak and is hovering around $75.30 per barrel. All attention is focused on the upcoming important OPEC+ meeting, with widespread expectations for a decision to further reduce and prolong cuts to oil production.
⭐️ Personal comments NOVA:
According to the H1 frame, the price retested the support area of 1.36000. Buying pressure is unlikely to overcome this support zone today. SET UP BUY signal recovers
⭐️ SET UP USDCAD PRICE:
🔥BUY USDCAD zone: 1.36000-1.35900 SL 1.35500
TP1: 1.36300
TP2: 1.36600
TP3: 1.37000
⭐️ Technical analysis:
Based on technical indicators EMA 34, EMA89 and support resistance areas to set up a reasonable BUY order.
⭐️ NOTE:
Note: Nova wishes traders to manage their capital well
- take the number of lots that match your capital
- Takeprofit equal to 4-6% of capital account
- Stoplose equal to 2-3% of capital account
- The winner is the one who sticks with the market the longest

The bulls have a major advantage⭐️ Smart investment, Strong finance
⭐️ GOLDEN INFORMATION:
Gold: The next milestone to watch out for is the 2023 high, reaching approximately $2070.
The price of gold continued to rise towards the end of last week, ultimately closing above the important threshold of $2000 per troy ounce. However, this increase in value was accompanied by a decrease in open interest, indicating the possibility of a correction in the near future. Meanwhile, the next significant resistance level for gold is expected to be the peak of $2067 reached in 2023 on May 4th.
⭐️ Personal comments NOVA:
The beginning of the week witnessed great FOMO among bulls. Gold price is approaching the strong resistance zone in 2020. This is the period when Gold price creates a new peak this year.
⭐️ SET UP GOLD PRICE:
🔥BUY GOLD zone: $2001 - $2003 SL $1997 scalping
TP1: $2009
TP2: $2014
TP3: $2020
🔥BUY GOLD zone: $1990 - $1992 SL $1982
TP1: $2000
TP2: $2012
TP3: $2020
⭐️ Technical analysis:
Based on technical indicators EMA 34, EMA89 and support resistance areas to set up a reasonable BUY order.
⭐️ NOTE:
Note: Nova wishes traders to manage their capital well
- take the number of lots that match your capital
- Takeprofit equal to 4-6% of capital account
- Stoplose equal to 2-3% of capital account
- The winner is the one who sticks with the market the longest

EUR/ CHF! 27/11 Nice support zone BUY⭐️ Smart investment, Strong finance
⭐️ Personal comments NOVA:
Sales volume is showing signs of decreasing. The strong support zone according to the H1 frame has been formed. Can set up BUY signal
⭐️ SET UP EURCHF PRICE:
🔥BUY EUR/CHF zone:0.96350 - 0.96200 SL 0.95800
TP1: 0.96700
TP2: 0.97000
TP3: 0.97300
⭐️ Technical analysis:
Based on technical indicators EMA 34, EMA89 and support resistance areas to set up a reasonable BUY order.
⭐️ NOTE:
Note: Nova wishes traders to manage their capital well
- take the number of lots that match your capital
- Takeprofit equal to 4-6% of capital account
- Stoplose equal to 2-3% of capital account
- The winner is the one who sticks with the market the longest

End November, during the Gold price bull cycle✍️ NOVA hello everyone, Let's comment on gold price next week from , Last week of November
🔥 World situation:
At the end of the year, published US economic data showed difficulties and challenges. There are not many positive signals yet. Gold prices continue to benefit at the end of the year.
In the last week of November, there are important data such as: CB Consumer Confidence, Prelim GDP q/q, Core PCE Price Index m/m, ISM Manufacturing PMI,... otherwise the forecast will continue to support The Golden household goes up
🔥 Identify:
Observing the technical chart according to the H4 frame, Gold price is still in a very nice uptrend. This is an opportunity for Gold price to have the highest price point in 2023
🔥 Technically:
Based on the resistance and support areas of the gold price according to the H4 frame, NOVA identifies the important key areas as follows:
Resistance: $2010, $2022
Support : $1991, $1971
🔥 NOTE:
Note: Nova wishes traders to manage their capital well
- take the number of lots that match your capital
- Takeprofit equal to 4-6% of capital account
- Stoplose equal to 2-3% of capital account
- The winner is the one who sticks with the market the longest

NZD/ CHF !! Aiming for higher highs during the week✍️ NOVA hello everyone, Let's comment on gold price next week from , Last week of November
🔥 Identify:
Prices are in a long-term upward trend at the end of the year. During the week, the price will adjust downward after reaching the resistance area but will continue to increase to reach a new peak
🔥 Technically:
Based on the resistance and support areas of the gold price according to the H4 frame, NOVA identifies the important key areas as follows:
Resistance: 0.53950
Support : 0.53350, 0.52900
🔥 NOTE:
Note: Nova wishes traders to manage their capital well
- take the number of lots that match your capital
- Takeprofit equal to 4-6% of capital account
- Stoplose equal to 2-3% of capital account
- The winner is the one who sticks with the market the longest

WLD/USDT: Wild trade for WorldCoinWLD is about to breakout from one of its strong resistance line. This breakout will fuel sudden surge in the price for WLC.
We can also see multiple LH (lower highs) and forming the strong support level for BINANCE:WLDUSDT
Entry Price: 2.6
Stoploss: 2.483
TP1: 2.785
TP2: 3.00
TP3: 3.127
TP4: 3.278
We will update this post when we enter the trade. Stay tuned for breakout confirmation.
Like and share your thoughts in the comments
Cheers
GreenCrypto

TRX/USDT: TRON Confirmed breakout for LONG tradeAs we can see from the chart, TRON has a clear breakout from its resistance. This is a good time to enter a LONG trade.
Entry Price: 0.104
StopLoss: 0.100
TP1: 0.1068
TP2: 0.1105
TP3: 0.1128
Like and follow us and share your thoughts in the comments.
Cheers
GreenCrypto

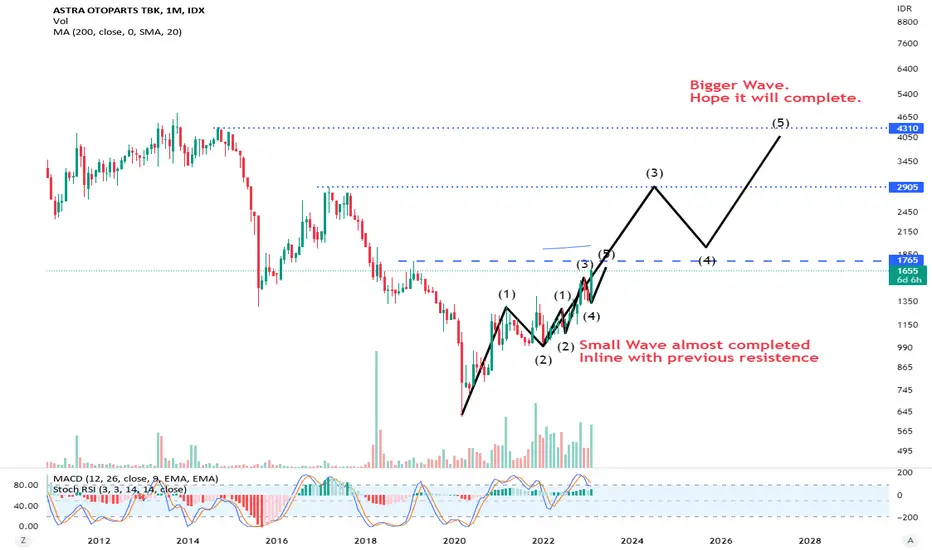
AUTO journey to complete next wave. See previous post as wellAs stated in previous posting, AUTO has completed the small wave and looking for bigger wave completion.
Still long journey but hope for the best.
Scalping XAU! sideway accumulates Gold price today⭐️ Smart investment, Strong finance
⭐️ GOLDEN INFORMATION:
The price of gold (XAU/USD) is facing difficulty in taking advantage of the small gains made yesterday and is fluctuating within a tight trading range, remaining below the significant psychological level of $2,000 during the first half of the European session. Currently, investors are hesitant to make bold bets on the market's direction and are instead waiting for further clarification on the Federal Reserve's plans regarding interest rate hikes.
⭐️ Personal comments NOVA:
Sideway accumulation zone, suitable for scalping. The price trend is still following the rhythm of downward adjustment and BUY recovery
⭐️ SET UP GOLD PRICE:
🔥BUY GOLD zone: $1988 - $1990 SL $1985 Scalping
TP1: $1993
TP2: $1996
TP3: $2000
⭐️ Technical analysis:
Based on technical indicators EMA 34, EMA89 and support resistance areas to set up a reasonable BUY order.
⭐️ NOTE:
Note: Nova wishes traders to manage their capital well
- take the number of lots that match your capital
- Takeprofit equal to 4-6% of capital account
- Stoplose equal to 2-3% of capital account
- The winner is the one who sticks with the market the longest

USDJPY) BULLISH) Flag)🚀🤷♂hello traders what do you think about this analysis ideas 💡😁🚧
traders what do think about bullish flag patterns)
Tp 150.304
Tp 150.712
Tp 151.363
Tp 152.116
Follow up with my trading idea's 💡😀💡
