GBPAUD long.The premise for the the 3years time frame shows us a bullish window, and the chart, is forming an engulfing bull pattern..
Longtrade

CADCHF Long Trade SetupDespite the sharp and quite big drop, my forecast on the bigger picture remains the same, which is a running flat. That's why my expectation is still an upward impulse as C wave. So, I'm waiting for a correction to place a pending order. Then I'll move SL to BE asap because there is still some potential for more downside, and as long as it stays over the previous low (green A), coming down is OK.


AUDCAD Long Trade SetupMy annotations indicate my main expectation, but there are some other options for the completion of the correction. Then we should see a big upward impulse. Now, I'm waiting for a new low (purple B) and a reversal structure to take a long trade. I do so because the new low can be the end of the correction. If I see any chance for one more downside after the purple C, I'll hedge my trade, otherwise, I'll just move SL to BE.

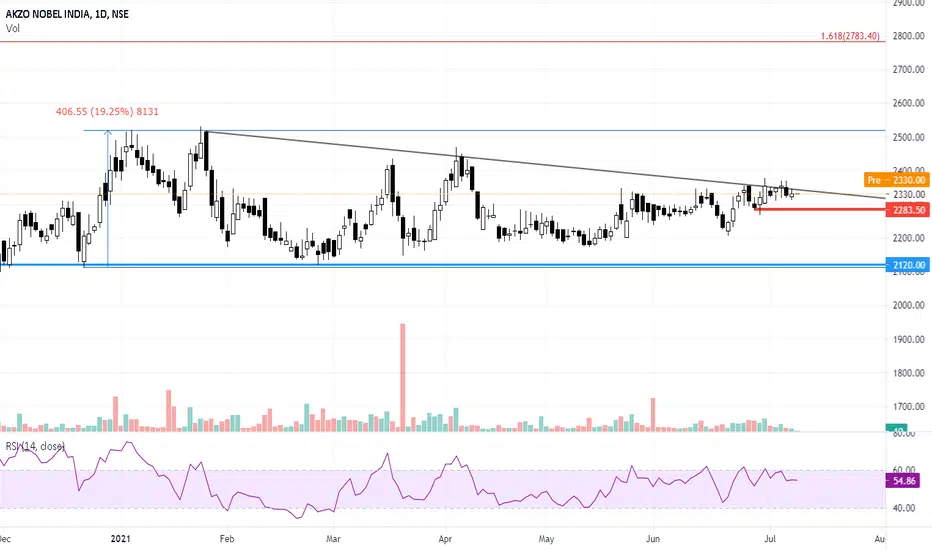
Akzoindia for solid returnsThe stock has been trading in a range since the start of this year .
Currently stock is trading near trendline resistance, though it also created good support around 2280 levels.
Stucture of the stock is good on the higher timeframes, hance if it sustains 2280 levels, it could move towards the range upper end i.e 2500 levels and also beyond it up till 2780 levels.
Signs of an uptrend were seenBullish trend just started after the downtrend is broken. Key levels also approve the bullish movement.
Dashed lines are long-term trendlines.
To identify the price targets I used Trend Key Points Indicator which has a high success rate in such cases.

NZDJPY - Long positionI'm looking for a breakout of the small downtrend that has formed creating a triangle. JPY is very weak at the moment and the trade balance news that just came out doesn't look that good.
I'm waiting for some bullish momentum and then may trigger a long position around 77.75.
Entry: 77.75
SL: 77.47
TP: 78.20
This basically 1:1.5 RR

GBPUSD Long Trade SetupA correction should be in the making, and it looks like we have a complete B wave. That's why I want to take a long trade. I'll hedge my trade at the end of the C and then book some profit.

AUDCHF Long Trade SetupAlthough the bigger picture isn't too clear, it seems like a running flat is in the making. Based on my wave count, the last low can be the end of the B wave, and if so, we should have a reversal structure. That's why I placed a pending order over the last top. I hope we will get a small trade setup after the regular flat, so we can take a better trade.

Extremely Bullish pattern in Sunpharma Formed the inverted head and shoulder pattern (which is rare), and it will definitely boom tomorrow.

EURNZD SELL SIGNALEURNZD SELL :
EURNZD is likely to go downtrends for sure as you can see in the chart it is following my regression trend as i set it , so surely it will go down ,
There will be 2 support lines which will be my TP and SL ,
I decreased the a little amount of pips for the Take Profit as we need to avoid the market reverting back when it comes near to our TP and vice versa(Increased a little amount of pips to avoid touching the SL so it can revert back and hit our TP).
Dont Worry it wont hit the SL(1000% sure),
TP : 1.68876
SL : 1.72991
PIPS GAIN WILL BE : 283

USDCAD SELL SIGNALUSDCAD SELL :
As you guys can see i kept my regression trend in the 1H timeframe and drew 2 trend lines along with my regression trend lines , so i observed a pattern which is definitely gonna go downtrend. It will hit the TP in 3-5 HRS after market opens
Risk:Reward ratio is 3.03.
SELL AT : WHEN MARKET OPENS
TP : 1.24196
SL : 1.24841
PIPS IN RISK : 20
PIPS IF GAINED : 60+

EURGBP SELL SIGNALAccording to Beginner Traders the markets going to bounce up and down following the trend in 4H chart as shown by the Yellow Line,
But According to me , If you go to months back there is a "Very High Level of Resistance" at "0.85697" , So the markets definetely gonna follow the trend as showed by the green lines and will definitely be in an upward trend once it hits 0.85697 resistance level as shown by the Red Line , So there are another 2 Resistance Levels which will be my TP's ,
and I decreased a little amount of pips as it should surely hit our TP's and increased 5 pips in Stop Loss(This is another level of resistance) , So we will be very likely to earn profits.
Also the Risk:Reward Ratio is "2.94"
TP1 : 0.86169
TP2 : 0.86403
SL : 0.85419.

HDFC LIFE : Pullback tradeThe stock looks great, we could see a trendline breakout with a decisive candle with good volume.
Though the stock did not see a good momentum movement post-breakout.
Now if it sustains 660 levels, chances are that it might be moving towards 720 initially and then towards 750 levels.
Trade type: Positional

NOCIL for solid returnsNocil looks great on all the time frames, though it is trading near its all-time high, the price structure looks quite positive on higher to lower timeframes.
Now if the stock sustains 200 levels on the daily timeframe, it could move fast towards its all-time high i.e 236 levels.
For swing traders SL can be kept below, 200 levels.
For Positional trading, Sl is a little far, but it worth it, because of current and previous price action, suggesting that it could go beyond its all-time high if it sustains 180 levels on its weekly timeframe.
The post is for educational purposes, if you are trading this, you are trading at your own risk.
This is my view/analysis on NOCIL, do let me know, what's your view on the stock.

ALEMBIC LTD - Trendline BreakoutAlembic has been consolidating in a triangle range for the past 1 month.
Price Action: there is a big bull candle formed within this range on 8 June 2021 on its hourly chart.
Currently Prices are trading near trendline resistance, hence any breakout if happens, then the stock can see a very good move on the upside i.e up to 140 levels initially and also towards 155-160 levels.
Stock can be bought with a SL below 125 levels.

USDCHF Long Trade SetupAfter breaking the previous low, it jumped back quite strongly, and created a reversal impulse. So, I'm waiting for a big enough correction to take a long trade. If the whole downward structure was a complete correction, we will have a nice upward impulse, otherwise, a correction and more downside.

SBICARD Trending up towards 1100 levelsSBIC card has come into motion and is probably moving towards 1080- 1100 levels,
Please refer to the previous post of sbic, linked here.

ACB: inverse head and shoulders formingIs weed hot again?
Potential inverse head and shoulders on ACB forming on daily. The pattern will only be confirmed if we break 19.
Initial target on the chart.
So what do you think? Are we forming this left shoulder or not?

EUR/USD could be a nice long soon!Hey tradomaniacs,
EUR/USD looks like a good buy as soon as we see the breakout above the marketd-up resistance (entry-point).
Let`s see! =)

HEROMOTOCO looks good on all the timeframesHeromotoco bounced from the support, and the current structure is of higher highs and higher lows, and sustaining these support levels, the stock could move towards 3350 and 3470 levels in the coming weeks.
Trade Type: positional

NVIDIA Buy the Retrace for 25% - 45% Gains 1D TF Analysis
Well respected Ascending Channel Printing Higher Highs and Higher lows
with a new ATH Printed on the 2 June I would like to see a
back test of the $590/$600 * 0.618 Fib region before continuation to the upside targeting the
1-1 Fib Extension for a 25% move which sits at the middle of the channel and the 1.618 at the
top of the channel for a 45% gain.
I have highlighted the box for entry and depending on your appetite for risk
you can place SL below the last swing low at 530 or more wider at 450 again this is for you to decide
this is just an example .
Plan the trade and trade your plan , Know your invalidation and always use a SL .
Like and follow for regular analysis and signal setups and check out the related ideas below .

PowerGrid breakout candidatePowergrid is on the list of gainers, today, and I also discussed this post in my previous posts, the stock looks good on all the timeframe and they are in alignment.
On the hourly chart, it closed near the trendline resistance, since the higher frames are positive, I am expecting that we might see a breakout tomorrow and it could be good intraday for tomorrow, the next resistance I see is around 232 levels, stop loss can be placed below 226 levels.
Risk reward might not be favorable for intraday trade, but for swing, where the stock could move up to 240 -242 levels, it could be a good RR Trade.
