Cad/Jpy Ready For a Nice and Sweet Sellits near the dynamic resistance line in the weekly timeframe and also the static resistance line in Daily Timeframe.
if The PMI News Comes Bad for CAD Sell position is confirmed.
it is safer to enter when the short uptrend line got broken.
share your ideas with Me :)
Loonie

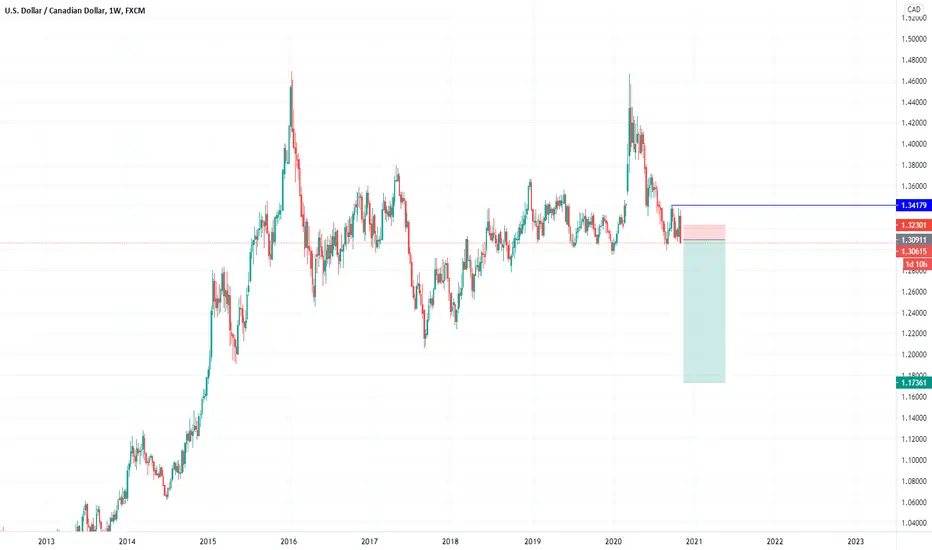
USDCAD - PREDICTIONThe Loonie broke the weekly support and we saw a freefall below 1.30.
Really cannot see the USDCAD breaking back above 1.30 now with the DXY crumbling and oil prices climbing.
The only question is where the pullback ends.
I've highlighted a 1hr zone of interest in yellow, where price stagnated creating a potential shelf for price to retest.
However, should this break, we should see a retest of the weekly support turned resistance before a further impulse.
Remember, even though we expect a slight push up, we trade with the trend!

USDCAD - PREDICTIONWe could break this weekly support this week.
Need a daily close below the red area.

USDCAD - PREDICTIONI'm Bullish. I know, risky right?
Take a look at the weekly, at the daily, this big grey area is holding like a champ.
Keep an eye on 1.31100 but other than that, we should return to 61.8% given Toronto is back in strict lockdown.

USDCAD - Trade idea! 4HR USDCAD Technical Analysis - COUNTER TREND TRADE.
Technical aspects:
Pattern: Small descending channel smaller term , until it's broken Bullish flag Intra day could come into play if it breaks towards upside.
Resistance: 1.31248, 1.31410, 1.31793, 1.32076
Support: 1.30639, 1.30367, 1.30048
If it breaks towards resistance area of 1.31248 I'd see the reaction of the pull back for further confirmation, would indicate a bullish flag formed and take it to the resistance zones. The way I trade I tend to scale out of my trades my main target areas are the resistance areas and last taking profit would be 0.382 Fib Retracement areas. Nice target area is that beautiful 200 EMA! Easy way to either add alert when it breaks or add an order.
However, if we do pull back within the descending channel we are in the key support area is 1.30438 and that's key area of support! Whilst trading the Loonie I do take into mind WTI Crude and of course dollar index as well.
The type of market we are in, most of my trades at this current moment of time are counter trend - which basically means I am going against the longer term trend. Which you must have a plan for, to build the right confidence you need in trading and journal it the types of trades as well is very important!
It was a very quiet week last week, which I know for some traders I've spoken to that work even within larger institutions it has been frustrating for sure! However, the way I keep myself busy on a very quiet week we must remember to be disciplined and to not over trade, but doing this I do go onto very small time frames 10-15mins time frames and my trades will be not be a swing trade in a range bound choppy market I tend to have my trades closed by the end of the day not doing as many large targets I would do if it was a swing trending market but it isn't right now.
Until we are still within these ranges, best to keep your targets small, keep to day trading until consolidation period is over and if you don't understand what the chart is indicating go to another pair currency or simply don't trade till you're comfortable to get back into the game. Usually, when I step away from the market, I don't step away and do something unproductive, I instead go for walk, exercise or I read and extend my knowledge further within the markets, there are plenty of very resourceful books based not just on markets, but on psychology aspects to help! For any further book recommendations, feel free to message or comment down below I'd be sure happy to help!
Key tip: A large percentage of trading is psychology! Have trust in yourself and your trading plan.
Have a great week ahead.
All the best,
Trade Journal (TJ)

W/C 16.11.2020Still looking for weakness to take out blue levels - Then off to 91.50
Last week Thurs/Friday was so slow but I liked that we drifted down and respected the resistance above market. I will be looking for trades on fibre, aussie, cable and gold this week. I will also keep an eye on Loonie and kiwi to see if I can pick something up.
Follow for updates - will probably give some brief thoughts on videos this week too

Loonie's NEXT WAVEUsd/Cad has been on a huge downtrend since a while now. We are approaching a key market area around 1.322. This level will be REALLY IMPORTANT for loonie and I do believe that we are going to retrace from there and land on new low area's. Quite interesting to monitor this pair. #tradesafe #theforexdaddy #tfd

USDCAD Short opportunityI do not trust trend lines - We also need to break the weekly "trend line" below market. Short opportunity for loads of pips here

USDCAD - Short term trade idea!Technical - Long position.
Pattern: Bull flag - Consolidation.
Fib Retracement: 0.618 Trade towards 161.8 Resistance zone
Support: 1.29917 & 1.29655
Resistance: 1.30247, 1.30566 , 1.30807
Remember: Just a trade idea, not a recommendation.
All the best,
Trade Journal

USDCAD Stops are done but 1,30 holds, buying on dipsHi,
aggressive move to the downside yesterday with move back above 1,30 twds end of the day suggest stops are done and we do have a chance to see some rally...
Weak shorts should add fuel...
Risk: oil prices and yields....
Buying dips towards 1,3020/00
Stop below 1,2960
Target 1 1,3160
Target 2 1,3240
Good Luck

Loonie, The up move should start hereWe are expecting the up move and the previous trade also is in the play but nothing much happened since.
So the forecast as has shown on the chart is the same, but in case of the price action breaking down the monthly line, the trade's stop loss will be triggered and the idea wouldn't be valid anymore.
Watch the lower time frames to see the signs of the breakout.
Happy Trading, Stay Green! ✌️
➖➖➖➖➖➖➖➖➖➖➖➖➖
💬 Please let me know your view about the idea
🔗 Check out the "Related ideas..." in the links below too
Find us on social media 😉
➖➖➖➖➖➖➖➖➖➖➖➖➖

USDCAD MEAN REVERSIONGood afternoon traders
Was just browsing the charts and noticed this nice little mean reversion trade on the USDCAD
Keep an eye out for this one!
As always, keep your risk managed!
Regards :D


Loonie Moving Up. USDCADIndeed. US dollar has been tanking in comparison to equities, other currencies, commodities and many cryptos. Are we headed for another bullrun on the stock market? It would be almost criminal to think so by now. Charts suggest beginning of Wave 3 on the Loonie, leaving us plenty of room to move up. Fibonacci alludes to some suitable goals. None of this is financial advice, do your own damn research.

USDCAD - WEEKLY PREDICTIONThe Loonie has been in a strong downtrend on the higher timeframes ever since the March crash. However, we're approaching key MAJOR support and this is where the higher timeframes will be key.
We have weekly support but a weekly descending trendline. Which will break first? Only the market will tell us.
What we're looking at here, is the Head and Shoulders on the Daily timeframe and looking for the break and retest of the neckline down to test out that weekly support.
Any buys only work with a break above the 61.8% fib AND the weekly trendline, keeping our eyes on how price progresses and if it starts to wick back to entry towards the end of the week, we will close at breakeven for buys.

Fractal failurePrice failed to complete a fractal on 2 weekly chart and is moving away from it. Things started to go wrong in July last year...something to do with Brexit and this "wrong bias" keeps going...
We see accumulation above the failed fractal and price is likely to push higher making higher high.
THIS IS NO TRADE SETUP BUT GENERAL OUTLOOK TO IDENTIFY LONG TERM BIAS.
as many cant make sense of whats going on with this messy pair.
Top Absolute Correlation 1 WEEK
1 EURGBP - GBPCHF -93.6%
2 EURGBP - EURCAD 90.3%
3 EURGBP - GBPSEK -88.5%
4 EURGBP - EURSGD 86.0%
5 EURGBP - XAUGBP 84.9%
6 EURGBP - CADCHF -83.9%
7 EURGBP - EURMXN 83.8%
8 EURGBP - CHFSGD 83.6%
9 EURGBP - NOKSEK -83.5%
10 EURGBP - USDRUB 82.4%

USD/CAD Loonie - Long and short term view. USDCAD - Technical and Fundamental View:
Dollar Fundamentals view:
- Either way there will be further stimulus I am longer term bearish on the Loonie.
- We do have the elections, if Trump goes through and depending on takes over the senate as well is key there will be further reflation trades that will be very interesting to keep in mind and I expect energy commodities to gain further momentum. However, if Biden comes in a short term Dollar decrease would be in play until, focused further would be short term view perhaps - I'd be eyeing the tech stocks, I don't expect that to rise further due to the tax views and various other aspects.
- Stimulus, I am not very sure if it's getting personal behind close doors regarding stimulus- However, people are unfortunately running out of capital and facing hardship - I think there will be a deal it won't be written off. However, to keep in mind - Where is the stimulus allocated as in what sectors and how much.
- Keep an eye on all CB - Central banks.
Technical view:
- Pattern: Wedge formation, within a longer term descending channel
- If we get further dollar strength I'd expect the 200 EMA to come into play again - those areas look like a good resistance area and keep in mind longer term bearish channel.
- If we get further dollar weakness, I'd expect it to follow bearish channel areas - Longer term targets near 161.8 Fib retracement area - 1.28-1.27 areas.
- Key resistance areas - 50 - EMA = 1.32385 to 200 - EMA = 1.33812.
- Key support areas - 1.30338, 1.29066 & 1.27856.
Key Tips:
- We are in a fundamental headline driven market two things to keep in mind - Elections & Stimulus.
- Trade smaller size if you're feeling at unease.
All the best,
Trade Journal (TJ)

USDCAD Intraday: Busing some ahead of CAD CPIHello,
are bears went ahead of themselves ??? Or maybe much lower levels are waiting for us ?
So far, a reaction around an important level based on the daily chart ... profit taking ahead of CAD CPI ?
Intraday Longs 1.31 / 3090
Stop below 1.3075
Target 1.3065 / 75
Good luck

USDCAD - WEEKLY OUTLOOKSo we always try to have a plan for both sells and buys but the #loonie looks long here.
It's currently sitting just above one of the strongest levels of support I've ever seen:
Key Key psychological 1.30 level
Weekly 61.8% Fib Retracement! (WEEKLY FROM JUNE 2017 SWING LOW!!!)
Previous September lows when the DXY was crumbling couldn't break this level!
So as far as sells goes, unless we see an intra day technical validation, we won't be selling this week.
See arrows for 2 buy options! Trade safe with the election incoming!


USD/CAD AnalysisHello everyone,
A quick analysis into the Loonie supporting the bearish picture:
1- The pair broke below the 50 SMA.
2- The pair broke the higher highs higher lows pattern.
3- The pair broke the ascending trend line.
-
-
-
Next target is the 38.2% at 1.3150.
Good luck
