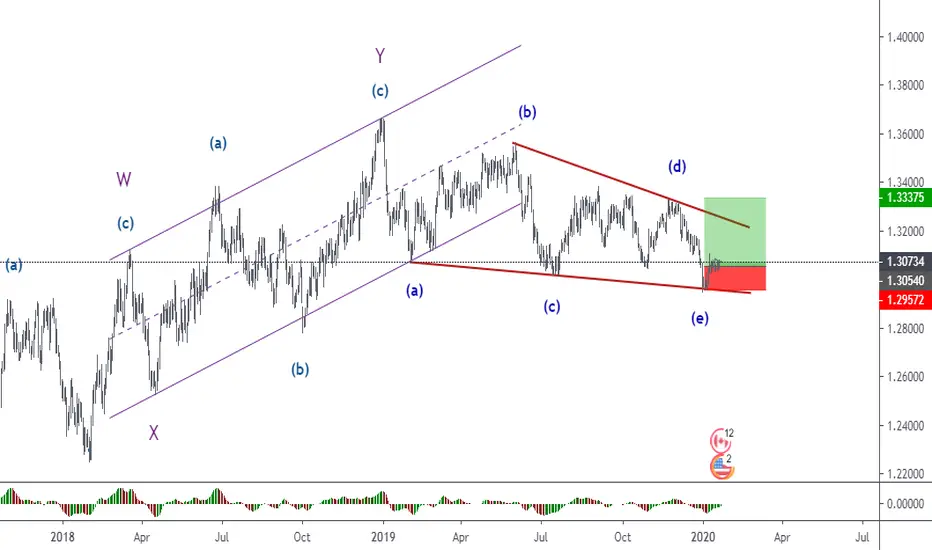
USDCAD - Long inside triangleWe are waiting this daily timeframe structure to be completed to get the clear idea where is she going.
Upon rejecting lower trend line of triangle, its favor bullish movement to get to upper triangle trend line.
Hope you get some idea !
GOOD LUCK !
Loonie
USD/CAD closing down on the key short-term resistance areaThe USD/CAD has burst higher today on the dovish Bank of Canada (BoC) monetary policy statement. Compared to this morning’s price, USD/CAD trades more than 100 pips higher. The pair is now approaching the key short-term area at $1.3160, where the 2-year ascending trend line and the 200-DMA intersect. Watch the reaction closely for future clues.


AUDCAD Bullish ProjectionThe Aussie showed lots of momentum being built when touching its Major Support Zone, patiently waiting for confirmation to enter bullish with a completion of exhaustion by using structural price action + fibonacci.


USDCAD Finding Support Before A Short Term UptrendAs observed on the weekly, Loonie is now trying to find support on H4 in order to commence a short term uptrend.
N.B
- Let emotions and sentiments work for you
-ALWAYS Use Proper Risk Management In Your Trades

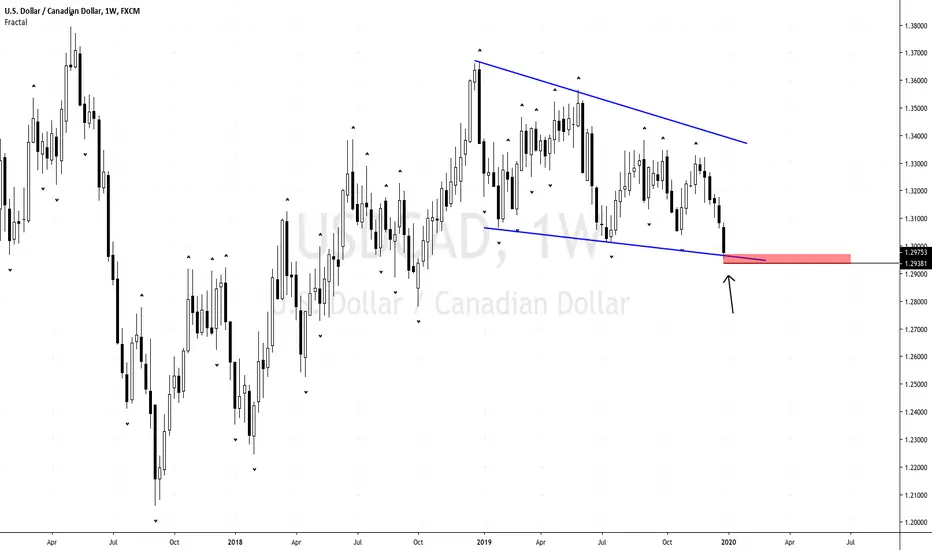
Loonie On Weekly Correction But Need Price Rejection For ReversaUSDCAD has been on weekly corrections since Dec 2018. Now that price is on the lower channel, will there be a reversal? Now waiting for a weekly reversal candle
N.B
- Let emotions and sentiments work for you
-ALWAYS Use Proper Risk Management In Your Trades
USD/CAD waiting for BreakoutAccording to the hot news, the oil price jumped high which is should be support Loonie, so USD/CAD should be bearish.
Another news, US will cut the interest rate on 19 Sept, 2019. So USD/CAD should be bearish.
So, the conclusion is, sell usd/cad right now, but set a stop loss because nobody know where's the market go.
If Fibo 0.618 crossed => bullish breakout
If Fibo 0.382 crossed => bearish breakout
*Use MA 50,100,200 to confirm the signal
Dont forget to use MONEY MANAGEMENT. Goodluck! :D

ORBEX: Investors Brush-Off USMCA Headlines! Softening Dollar?JGB yields brushed off USMCA headlines yesterday and took a positive turn above the zero mark! JGB's haven't been positive since March 2019!
Is this hinting that investors turn optimistic on global economies? Or just a shot-lived surge own to auction?
Supported by impeachment uncertainty and poor US data yen rose against the greenback yesterday, however, the pound continued sliding on the back of no-deal risks.
Will the US and UK GDP figures change the short-term outlook?
Canadian retails are also due and they could be causing some short-term moves. Will they help loonie strengthen further?
Timestamps
USDJPY 1H 01:30
GBPUSD 1H 04:00
USDCAD 1H 05:40
Stavros Tousios
Head of Investment Research
Orbex
This analysis is provided as general market commentary and does not constitute investment advice

Loonie Still Trading in the RangeThe Canadian dollar has been under pressure after the recent disappointing Canadian jobs report.
On the 4-hour chart USD/CAD is staying in a range of 1.3158 - 1.3327, so our intraday bias remains neutral. On the downside, a clear break of 1.3158 will extend the decline from 1.3327 for retesting 1.3042 low. On other side, a sustainable break above 1.3327 should resume the rise form 1.3042 and target 1.3382 (Sept. high) key resistance after that.
The currency pair is trading below its H4 100 and 50 SMAs. Stochastic indicator is in oversold area on both H4 and daily charts. We prefer range trading strategy with Buy at the lower boundary of the range and Sell on the upper line with tight SLs.

GBP/CAD Market Situation And Future Swing ProbabilitiesPositive expectations for the upcoming U.K. general elections could keep sterling supported throughout the session, especially if polls continue to confirm the Tories’ lead. A couple of medium-tier reports from the U.K weren't actually impressive. Monthly GDP was above the previous but QoQ and YoY were lower than previous no good changes. The construction site wasn't doing good. Industrial Production and manufacturing were only better than previous but trade balance ended up the deficit for the Oct. Economic release were mix but the prospect of more opinion polls confirming a lead by the Tories may have some weight reason to push the pound higher on this cross pair.

Risk ratio 1:6. Loonie possible buy.. 23.6% Fibonacci retracement of July-September declined, but we can see nice trend line. Eyes on BOC rate statement.. 200-day Simple Moving Average (SMA) level of 1.3280 offers additional strong support.

CADJPY: Long or short? It depends. CADJPY is a wild one. In this screencast I show long and short opportunities depending on how much loss one is willing to take and on which time frame one is operating in.

ORBEX: Pound Supported As MRP Vote Share Predicts Tory Win!In today’s market insights I talk about YouGov’s MRP (multi-level regression and post-stratification) poll and how predicting UK’s vote share with 93% accuracy in the past supports the British Pound!
Aside from politics potentially moving the UK markets today, we have important GDP data coming out from Canada too. And this is likely to affect loonie.
The recording explains what I am expecting in the short and also medium-term for both GBPUSD and USDCAD. Don't miss out on information that can help!
Stavros Tousios
Head of Investment Research
Orbex
This analysis is provided as general market commentary and does not constitute investment advice.

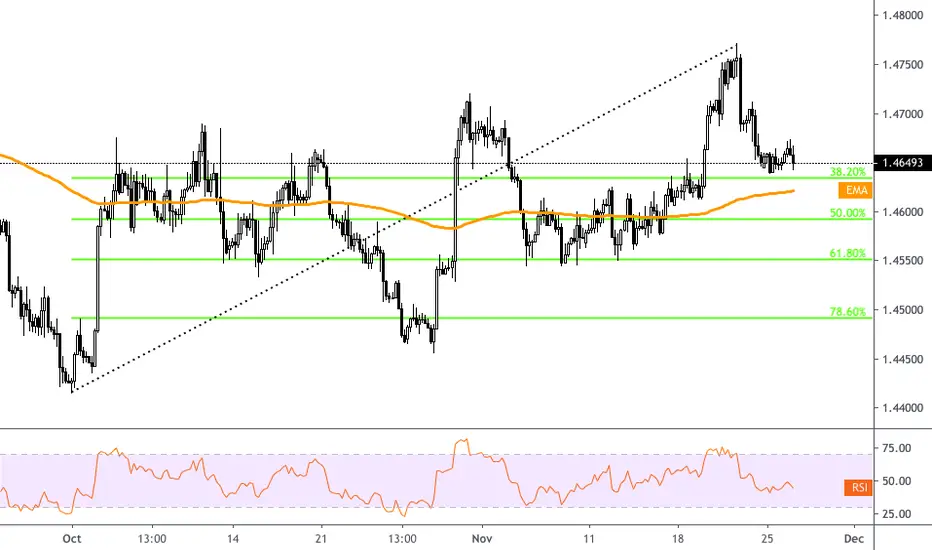
An attempt for EMAAs the pair price comes down, 1.4635 at the 38.3 Fibo retracement seems to be the first major support line the move faces. If we see below the line and then the price persists, it may go for 1.4620 that roughly corresponds with the 200EMA on the 4h chart.
EURO Vs Loonie (EUR/CAD) Trade Idea and Plan: Bullish biasEUR / CAD has developed higher lows connected by a longer-term upward trend line and also displays lower stochastic lows. This bullish divergence indicates a rebound may occur.
With little eye-catching improvements for leading indicators for the eurozone, in this session, I'm hoping to catch a quick bounce for the shared currency. On the flip side, there might be enough expectations for another dip in Canadian retail sales figures to keep the Loonie on a weak footing.
On top it all off, the resurfacing uncertainty surrounding trade talks between the U.S. and China could hold a veil on gains for commodity currencies and the dollar, reversing the euro may have chances in that case.

ORBEX:Loonie Bid on Poloz As Impeachment Hearing Goes Unnoticed!In today’s market insights video recording I talk about markets’ muted reaction to the impeachment hearings and focus on the assets that moved!
USDCAD was bid on a hawkish Poloz as he lowered down markets' expectations of a Dec rate cut. Loonie was also supported by OPEC+ likely production cut extension.
While at it, I also analyse EURUSD despite it ended the session somewhat muted as volatility increased. We are also minutes before German GDP and Lagarde’s speech!
Stavros Tousios
Head of Investment Research
Orbex
This analysis is provided as general market commentary and does not constitute investment advice.

GBPCAD Tea PartyEver seen such a big tea party? Life is all above imagination . Canada’s economic data point to the need for monetary stimulus. Analysts believe that BOC Governor Poloz may finally hint about easing today when he gives a speech in Toronto. The pound has been on a roll as the possibility of a no-deal Brexit becomes more unlikely. Labour leader Jeremy Corbyn is set to unveil his party’s election manifesto, which could shake the pound up some. 1.7450 that marks areas of interest on the higher time frames.

USDCAD Breaks Above Key ResistanceUSDCAD has broken above the key resistance of $1.3280, which consists of triple confluence - 38.2% Fibonacci retracement, horizontal resistance and the 200-DMA. Following the break, the price action went north of $1.33, however it has retreated since to offer late bulls an opportunity to jump in. This confluence is now expected to act as a support to bulls, as they target $1.3340 first, where the 50.0% Fibonacci retracement and horizontal resistance overlap.

A technical resurgeThe loonie-yen pair price is making a comeback from the lower band of the ascending channel. The pricing is climbing back towards 82.00. Still upwards, 82.40 can be followed.

Kiwi may take a turnThe kiwi is gaining against the loonie as oil prices fall over fears of a demand slump due to continued trade disputes between the US and China. As the New Zealand Dollar rise we might see a turn from 0.8510. In the following fall, 0.8430 and then 0.8400 can be watched.

CADJPY Might Attempt A Move Upwards To Around 84.000 Area!Hello Viewers, this is an instant trade signal! Therefore, please have a look at the main chart for the following vital trade details:
• ENTRY POINT
• STOP LOSS
• TAKE PROFIT
• RISK TO REWARD
The setup may look simple but I can assure you it is NOT. There are various in depth technical and fundamental analysis incorporated behind the execution. I would very much love to explain these two aspects here but doing that would consume ample amount of time which could affect the appropriate entry point behind this trade! So, to keep it simple the main chart just displays the simplified technical view of this trade.
My way of performing technical analysis basically starts by breaking down the monthly Timeframe down until the One Hour charts. The following are the aspects I focus most on when performing technical analysis:
• Draw Support & Resistance through key common psychological levels on M & W Charts. This helps me to see where the price might stall or breakout.
• Draw Trendlines to determine the dynamic support and resistance levels present on the charts. This helps me to determine where the price might stall and most importantly help determine the path of least resistance behind the active trade.
• I also tend to use EMA 50 on all the Timeframes. This EMA 50 is proficiently proven to act as dynamic support and resistance and is vital behind all my analysis.
• Lastly, I tend to use classic pivot levels to determine my entry, stop loss and take profit levels. The combination of this and all of the above helps me determine the precise and likely trade targets behind the setup.
Another aspect of my way of analysis is reading a lot of news to determine the fundamental aspects affecting any trade. After the technical analysis is performed, I tend to match if the fundamental aspect really supports my technical analysis.
Therefore, as you could see, putting all my thoughts here would surely take up a lot of time which could make the price drift away from the entry price thus affecting the Risk to reward ratio. I understand it is vital for many of you to know the details behind this trade setup, and so if you are interested you could send me message and I will try to share most of what I can!
The Above words are just template I use in all my trades. Shall there be any updates I will provide them here. Thank you

AUDCAD Might Attempt To Tackle 0.92000 Level!Hello Viewers, this is an instant trade signal! Therefore, please have a look at the main chart for the following vital trade details:
• ENTRY POINT
• STOP LOSS
• TAKE PROFIT
• RISK TO REWARD
The setup may look simple but I can assure you it is NOT. There are various in depth technical and fundamental analysis incorporated behind the execution. I would very much love to explain these two aspects here but doing that would consume ample amount of time which could affect the appropriate entry point behind this trade! So, to keep it simple the main chart just displays the simplified technical view of this trade.
My way of performing technical analysis basically starts by breaking down the monthly Timeframe down until the One Hour charts. The following are the aspects I focus most on when performing technical analysis:
• Draw Support & Resistance through key common psychological levels on M & W Charts. This helps me to see where the price might stall or breakout.
• Draw Trendlines to determine the dynamic support and resistance levels present on the charts. This helps me to determine where the price might stall and most importantly help determine the path of least resistance behind the active trade.
• I also tend to use EMA 50 on all the Timeframes. This EMA 50 is proficiently proven to act as dynamic support and resistance and is vital behind all my analysis.
• Lastly, I tend to use classic pivot levels to determine my entry, stop loss and take profit levels. The combination of this and all of the above helps me determine the precise and likely trade targets behind the setup.
Another aspect of my way of analysis is reading a lot of news to determine the fundamental aspects affecting any trade. After the technical analysis is performed, I tend to match if the fundamental aspect really supports my technical analysis.
Therefore, as you could see, putting all my thoughts here would surely take up a lot of time which could make the price drift away from the entry price thus affecting the Risk to reward ratio. I understand it is vital for many of you to know the details behind this trade setup, and so if you are interested you could send me message and I will try to share most of what I can!
The Above words are just template I use in all my trades. Shall there be any updates I will provide them here. Thank you
