GBP/JPY SELL - 135.000 Potential Target AreaPotential Sell Position on GBP/JPY. 35.000 Potential Target Area
Lowerlow

EUR/USD Technical analysisThe US President has managed to bring the Chinese deal makers once again to the table and it is set to make a positive impact on the dollar.
Further, the pair is in an ascending channel formation and it hit its resistance mark at the resistive trendline.
Now, the pair broke the critical support of 1.13487 and made lower low formation, which could make the bulls to take the foot of the gas.
Hence, we expect the pair to move to the supportive trendline for now, where the buying activity might resume again.


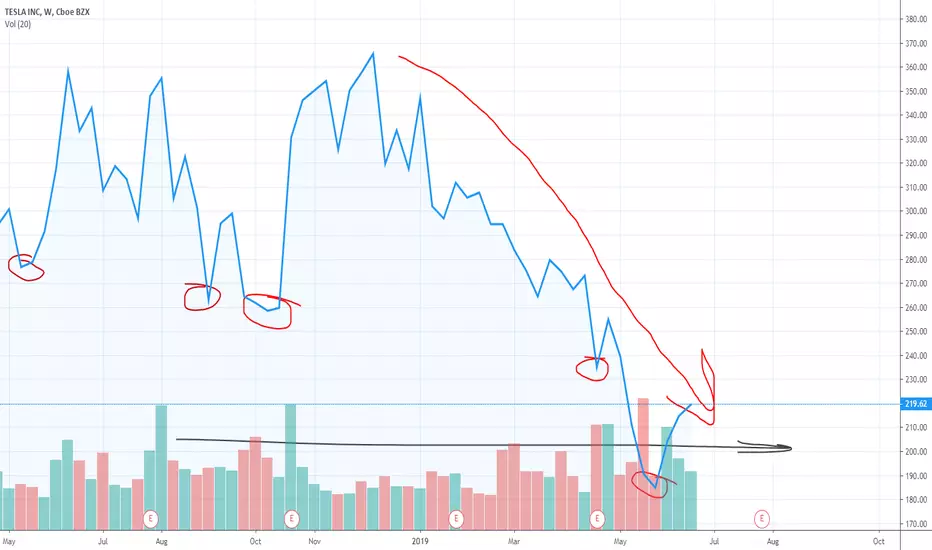
TSLA - The bubble already poppedTESLA lower lows and lower highs. Those still in this tech bubble will be soon complaining the market is rigged..... The company doesn't make a profit, heck it barely even makes cars..... at least numbers wise. Macro says momentum is over. When this company comes down to the automotive P/E multiple of low teens / high singles. This company is a 10-20$ stock. Don't let this be your blackberry. GET OUT NOW! If you have to be part of the company for ideologue reasons. Then buy its junk bonds for penny's on the dollar.
Chart makes a better water slide than anything

Higher high - lower lowDear Crypto fanatics,
here we are, nice come back of the BTC, the market is happy and the traders are making money, yeaahh!
Now we need a small settle to consolidate the possible bullish trend, as you can see we have an higher high with lower low on volume.
The number of shorts and margins are increasing and the RSI is diverging. That's the perfect setup for a short trade.
Stay tuned and like, share comment if you enjoyed the TA.
*this is just my opinion I'm not a professional advisor! Make your choices wisely and manage your risks!

BTC - Coinbase TriangleIs this Coinbase Triangle like the Bermuda Trianlge? A place where bad calls go to disappear?
Place your bets and take your chances.....

IOTA USD - Bearish Symmetrical TriangleIOTAUSD should take us lower (minimum 40%) going to complete a Symmetrical Triangle. We broke our longterm RSI support which coincides with the breakout of the triangle.
Weekly 21 EMA was already rejected
IOTABTC should also take us lower, but here we could soon have good RSI wedge support at 0.00004517 where I will look at possibly longing IOTA depending on the look on the day of the touch. It might touch the region with a TD Countdown 13 on the same day.
~20th of May could be interesting.

EURUSD goes long - look like bullish :)Hi at all!
The previous Lower High was broken. This is why the downtrend is on the end and a new uptrend starts.
Use the correction waves to build a lucrative tradepyramid.

eurjpy short setupeurjpy is in a descending channel consisting of lower highs and lower lows. Price seems to have reached its first resistance zone. Resistance zone was previous support from past data and has now been broken and turned into a newly formed resistance which adds to the continuation of the descending channel.
on top of that, price was in alignment with the fib retracement of 0.5 from previous lower high so that also indicates that price will drive lower. Waiting for breakout of the trendline on lower timeframes to enter.

US OIL Sell on Head & Shoulder ??Reason to Short
1) 6000 = round number resistance
2) Lower low = Sellers in control
Anticipate Right Shoulder to form

AUDJPY - Will The Yen Be The Safe Haven Yet Again? With JPY new set for tomorrow with the Bank Of Japan discussing the Monetary Policy and the governor of the BOJ speaking on the Bill Of Exchange, this could be a influencing factor as to where AUDJPY price would like to move.
Currently, at the time of writing this article, we are sitting above the 78.750 monthly key level. We are respecting the descending trend line, however we have broken the ascending trend line. Price has also been ranging between the 77.700-79.800 price region from early January till now. We began to see downside momentum after consolidating between the 25th of February and 5th of March, where we then saw price break the consolidation zone creating a lower low followed by a lower high.
I favour a short bias however I'd like for price to close below the monthly key level or see a break and retest. Price could also push higher, seeing stop hunts and break the descending trend line and retest the ascending trend line, around the 79.500 price region, which will be another retracement to the 61.8 Fibonacci level. I will be waiting for more confirmation on this pair however price looks bearish. With speculation in the air surrounding the Aussie Dollar likely slipping below 0.70 USD in the second half of 2019, this may be a high probability setup with downside targets of 73.500 and 71.000 long term.
If the descending trend line is broken, retested and then we see an aggressive bullish movement, this short may be invalidated. As always, risk management is key and trade responsibly. Only use my analysis in line with yours, do not doubt or change your bias.
If any further questions are needed, hit me up on instagram: keownarcher

GBPUSD - Cable preparing for a new leg to the downsideLast night we had exciting movement from cable, seeing price bounce off a daily support/resistance region. The main catalyst being PM May's visit to Strasbourg yesterday where it was rumoured she had gained assurances from the EU. However, as of today it is evident she was unable to win over the Government & Members of Parliament, with the governments chief legal adviser giving a rather dovish statement and low liking to her BREXIT deal. A few of PM Mays own party members will reject her deal.This was a classic "Buy the rumour, sell the news" event. Members of Parliament are worried as the PM looks set to see a no deal outcome. Unless of course, the PM and her party alongside the ERG, DUP and majority of voters vote for the PM - which i highly doubt.
Back to technicals and we can see on the daily timeframe we had a couple of higher highs and higher lows. However, we have come close to a 3rd touch of the trend line due to last nights news, forming a new lower high. Fundamentals are currently respecting technicals as we've seen a rejection of the descending trend line and a ping off price ranging between the 78.6 / 88.6 Fibonacci regions. We also managed to come below the daily support/resistance marked in purple. Short term downside targets are 1.28600 and 1.27350 respectively. I expect a retracement to this purple resistance also laying in line with the 61.8 Fibonacci retracement region before seeing a leg to the downside, before creating a new lower low. This can be a great swing trade to capitalise on a no deal result before seeing a recovery of the GBP.
As always, risk management is key. Market manipulation and volatility is expected in these times of uncertainty and volatile news event times should be noted!
Thanks for reading, if you have an questions hit me up on instagram.
Instagram : keownarcher

CADCHF - Can The Bears Override The Bulls ? Okay, so not a pair I usually trade or analyse but it was requested and I humbly accepted.
So we can see bulls are in control at the moment, I see an upside move of around 80 pips before we can see a good reversal zone met. I will be looking for the descending trend line to be respected between the 71%-88.6% Fibonacci zone. This will also be a good rejection from the weekly key and we can look for bearish candle stick patterns to indicate a reversal and then our next Lower High will be confirmed. This will then be anticipating a Lower low to continue the downtrend and we can see price drop of around 250 pips. Stop losses will be just above the weekly key.
Instagram: keownarcher

NASDAQ - Where can we go next ? Good old indices.
Okay firstly, so looking at the weekly timeframe, we have a potential head & shoulders pattern forming which will allow the bears to take over the market.
Dropping down to the daily timeframe we can see we broke out of an ascending channel and currently we are retesting it. If we can close below the counter trend line, we should see downside momentum. Although the candle stick pattern, a hammer followed by a bullish engulfing, I do see this pair falling in the long term. The bullish engulfing has brought us up to and between the 78.6 and 88.6 Fibonacci levels. There is a minor resistance seen here for 5 candle wicks dating back to the 25th of February.
I will be looking for reversals from this zone between the 78.6/88.6, a 3rd touch of the descending trend line with a strong candle stick pattern indicating price action is bearish. This will then create a discrete lower high followed by a lower low. Dropping down to the 4HR timeframe, we can see a higher high followed by a higher low, then there was a break of structure creating lower lows and lower highs. Thus i am looking for confirmation to short this pair with a great risk to reward ratio.
If no opportunity for a sell is presented for us and the resistance is broken, this short analysis will be invalidated. Which, leads to my next scenario. We see a higher high or a high created followed by a higher low to form an inverse head and shoulder pattern on the 4HR timeframe, allowing us to breach the monthly resistance and go higher.
NB : Risk management is key with indices, especially with each $1 accounting for 10 pips. Trade with risk management and smash the week!
instagram : keownarcher

USDJPY Looking bearish.Now i see a big potential for sell this pair.
On the last my idea i post 1 not good trade.
here its :
1. New Lower Low.
2. Retest of 61.8% fib. level
3. Playing on resistance zone
4. Anyway we need to go down.
Good luck.
p.s. use S/L )

GBPAUD MarkUpThis is my zones I have set for GBPAUD. I have them color coded so there will be no confusion since I utilize multiple time frames. I patiently wait for opportunities.

aud/jpy short set upOn the aud/jpy short set up, I see a potential bearish reversal.
Price seems to be in contact with the resistance zone several times so I'm going to go ahead and suggest price will be driven lower hopefully towards the newly formed lower low.
Fib shows 0.382/0.618 retracement depending if you've used the lower low body or wick. Delving into the lower timeframes, price has yet again touched the resistance zone forming a double top which should ALSO lead to a triple top if price decides to drop lower than the resistance zone.
All this will be shown through pictures of the 4hr/1hr timeframe.

eur/jpy bearish set upOn the daily chart, the euro seems to have hit a new formed resistance which has been tested twice already. I'm expecting price to form a lower high than a lower low to confirm the bearish trend.
Would suggest selling at the break of the pattern if you want to wait for confirmation or you can sell below the resistance line if you're an aggressive trader.

failed too close above 0.32650. i think more DOWN will comeas we can se, we failed to close above 0.32650 yesterday. and as we can see. the bears are now in control. i think we will go down to the big blue line, that is a very interresting fib. level, and also ( compared to the bull-run off 2017) a very big by zone. if we can go down and reach the levels arround ( 0.31000 - 0.30960 ) in the big green box. we could, put in a HL on the daily RSI. ( PICTURE IN THE COMMENTS) and a VERY TIGTHT LL on the graph. wich is a very good thing!!. and if we close in that area, the RSI will be in a very good zone in general ( 39.6500 - 40.000 ) compared to the fib. levels.
remember to be VERY carefull and look after price action in the " accumulation zone" there we have an opportunity to put in a, BIG dobbelt bottom.
there is a opportunity, to close this day over 0.32200 if we do that, i still be bullish on this pair. but rigth now, i am bearish.
TRADE SAFE!!!

What a nice pair to trade! AUDNZD non-failure swing on its way?A chart tells thousand words. The pair completed a pullback to the longer-term trendline and formed a fresh lower low on the daily chart. Some traders may find this enough to enter with a short position, but I like to have some additional confirmation. A lower low doesn't necessarily mean a lower high, since the price can still go to the upside and create a higher high instead. That's why I would like for a non-failure swing, which would be a new lower high as shown on the chart. A short trigger would be the break below the recent lower low (shown on chart). Notice that a fresh lower high would imply a head and shoulders pattern.


S&P 500 forming lower low and lower highS&P 500 forming lower low and lower high
suggest to look for opportunity to short
around 2626.90 will be a good area to short
SL :2820
TP : Follow arrow
