$LPTUSDT Ready for 100% Move?The UPCOM:LPT chart looks pretty solid right now.
It’s holding strong above a rising trendline and key support zone around $6.20–$6.80.
After a healthy pullback, the price is bouncing again, and if this momentum continues, we could see a move toward $14.40, which is over 100% from here.
As long as the trendline holds, this setup looks bullish.
LPTUSDT

#LPT/USDT It can go up from this zone#LPT
The price is moving within a descending channel on the 1-hour frame and is expected to break and continue upward.
We have a trend to stabilize above the 100 moving average once again.
We have a downtrend on the RSI indicator that supports the upward break.
We have a support area at the lower boundary of the channel at 5.77, acting as strong support from which the price can rebound.
We have a major support area in green that pushed the price higher at 5.40.
Entry price: 6.20
First target: 6.45
Second target: 6.78
Third target: 7.145
To manage risk, don't forget stop loss and capital management.

#LPT/USDT#LPT
The price is moving within a descending channel on the 1-hour frame and is expected to break and continue upward.
We have a trend to stabilize above the 100 moving average once again.
We have a downtrend on the RSI indicator that supports the upward break.
We have a support area at the lower boundary of the channel at 5.77, acting as strong support from which the price can rebound.
We have a major support area in green that pushed the price higher at 5.40.
Entry price: 6.20
First target: 6.45
Second target: 6.78
Third target: 7.145
To manage risk, don't forget stop loss and capital management.
When you reach the first target, save some profits and then change the stop order to an entry order.
For inquiries, please comment.
Thank you.

Livepeer Strong Performer: Opportunity Missed? Never Too LateLivepeer was one of the strongest performing pairs between April and May growing some 340%. I look at this one frequently but somehow in the last cycle missed it and what a costly mistake.
It tends to happen, there are so many pairs, so many good projects and so many good opportunities that it is hard to catch them all. One that performs good tends to continue to do so for the entire cycle, meaning, Livepeer can continue to advance, to move forward and grow strong. Notice the chart.
Livepeer—LTPUSDT
Here we have the downtrend and the uptrend. It seems more clear now. It seems quite certain now. This chart leaves no room for doubt. After 7-April we are in bullish territory higher highs and higher lows with bullish momentum building up it will only continue to grow.
$38 as the next main target gives a nice 460% potential for growth. Mid-term, long run there is more, more, more, are you ready for more? More in the sense that the 340% previous bullish wave, or bullish jump, was great but we were not around but this is not the end. More in the sense that this is just the beginning and I love this chart because it confirms everything that I've been sharing and everything that I will share. More and higher. The altcoins market is just getting started. Prepare for higher prices. How will you maximize profits in this bullish wave?
Thanks a lot for your continued support.
You are truly appreciated and if you are reading this now... I am wishing you tons of profits and continued success. You deserve it of course. You deserve everything you wish since the day you were born. That's just my belief.
I appreciate the fact that you do take the time to read.
If you enjoy the content follow me.
Namaste.

LPTUSDT forming Classic Falling WedgeLPTUSDT is currently forming a classic falling wedge pattern, which is widely known as a strong bullish reversal signal in technical analysis. This pattern suggests that the recent downtrend may be losing steam, paving the way for a significant price breakout to the upside. With volume holding steady and even showing signs of improvement, this setup indicates that buyers could soon step in aggressively, potentially driving the price up by an impressive 140% to 150%+ if the breakout confirms.
Livepeer (LPT) is one of the most promising projects in the decentralized streaming and video infrastructure space. Its unique use case and real-world utility have been steadily attracting investor attention, especially as demand for decentralized solutions grows. Recent developments and ecosystem expansions could further boost confidence, making this falling wedge breakout pattern even more compelling for swing traders and long-term investors alike.
From a technical perspective, traders should watch for a strong move above the wedge’s resistance line, accompanied by increasing volume. Such confirmation could trigger a rapid surge as shorts get squeezed and sidelined buyers rush to enter positions. Historically, falling wedges on assets with good liquidity and active community backing often produce explosive moves, and LPTUSDT appears to have the necessary ingredients for this setup.
Keep an eye on this chart as Livepeer continues to develop its platform and attract partnerships. If this bullish pattern plays out as expected, it could offer one of the more rewarding opportunities in the current altcoin landscape.
✅ Show your support by hitting the like button and
✅ Leaving a comment below! (What is You opinion about this Coin)
Your feedback and engagement keep me inspired to share more insightful market analysis with you!

lptThese two blue lines are important to me
This is a watch, maybe someday the green box will come down
But for now, this blue is more important to me

LPT reversed a 3-month bleed — and I caught the reset candle.This isn’t noise. This is reversal.
LPT just completed a 96-bar, -86% bleed. But price didn’t just stop randomly — it formed a rounded base and exploded straight into a 1D breaker block, clearing internal structure and printing a clean power candle.
Now? Price is retracing.
We’re back into the 1D OB at 8.31 — aligning perfectly with the 0.618 fib retracement of the entire move. This is where price pauses, not reverses. And if Smart Money is still in control, this is where the next leg builds.
Targets are layered:
9.29 (0.5) is the first inefficiency reclaim.
10.28 (0.382) is the emotional level that marks continuation.
13.01 is the liquidity pocket — and the full draw.
This isn’t about whether price “goes up.” It’s about how price delivers.
Execution structure:
🟩 Entry: 8.31–6.91 (discount into 1D OB)
🎯 Target 1: 9.29
🎯 Target 2: 10.28
🎯 Final: 13.01
❌ Invalidation: sustained close below 6.12 (break of intent)
Everyone sees the candle.
Few understand the reclaim behind it.

Livepeer LPT price analysis⁉️ Are you saying that a correction has begun in the cryptocurrency market?
MM #LPT coin disagree with you, and as a result, there has been a +175% increase today.
If the price of OKX:LPTUSDT can be kept above $11.70-12 (similar to a year ago), then the growth can safely continue.
So what do you think is happening now? :
👍 - Capital has started flowing into altcoins, and it will only get more interesting from here on out.
Or
👎- An involuntary news pumping that will soon “crash”?
_____________________
Did you like our analysis? Leave a comment, like, and follow to get more

LPT Buy/Long Setup (4H)With the strong bullish momentum and upward movement, a swap zone has formed on the chart.
The price is gradually pulling back to this level. We can look for a buy/long position around the green zone.
A daily candle close below the invalidation level will invalidate this analysis.
For risk management, please don't forget stop loss and capital management
Comment if you have any questions
Thank You

LPTUSDT 1D Analysis LPT ~ 1D Analysis
#LPT On the verge of a breakout. Buy after successfully breaking this resistance line with a short-term target of at least 10%+ from here.

LPTUSDT 1WLPT ~ 1W Analysis
#LPT Buy when re -testing this support, with a short -term target of at least 20%+.
Reason, This is the lowest support for now.

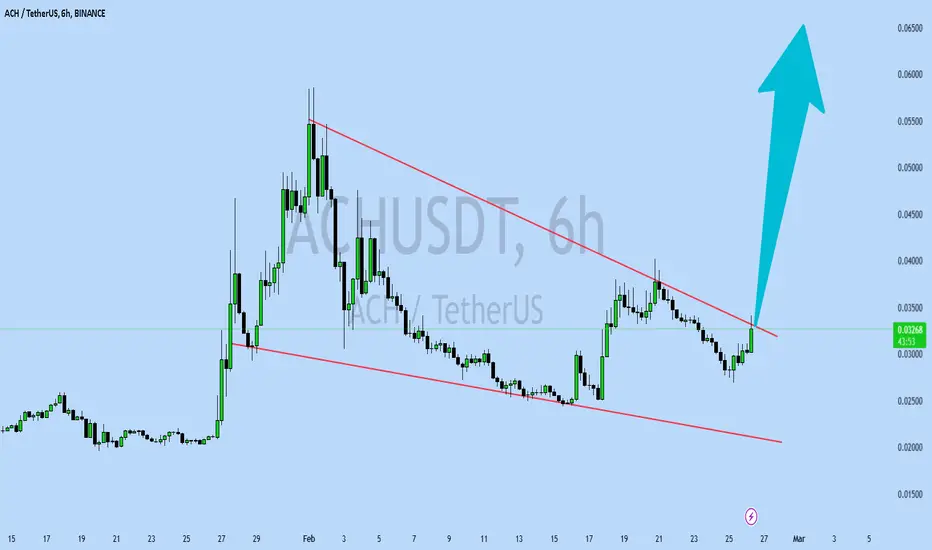
ACHUSDT UPDATEACHUSDT is a cryptocurrency trading at $0.03285. Its target price is $0.06500, indicating a potential 90%+ gain. The pattern is a Bullish Falling Wedge, a reversal pattern signaling a trend change. This pattern suggests the downward trend may be ending. A breakout from the wedge could lead to a strong upward move. The Bullish Falling Wedge is a positive signal, indicating a potential price surge. Investors are optimistic about ACHUSDT's future performance. The current price may be a buying opportunity. Reaching the target price would result in significant returns. ACHUSDT is poised for a potential breakout and substantial gains.
LPT has a buying opportunity !From the point where we placed the green arrow on the chart, it seems that LPT has entered a diametric pattern.
Wave D appears to have been a triangle that has completed.
If a pullback occurs towards the green zone, it would be a buying opportunity.
A daily candle closing below the invalidation level would invalidate this analysis.
For risk management, please don't forget stop loss and capital management
Comment if you have any questions
Thank You

LptBINANCE:LPTUSDT
📊 **LPT Price Update**:
Currently, **LPT** is trading at **$15**. If the price holds steady at this level, we could see it pushing toward higher resistance levels. 📈
🔝 **Resistance Levels**:
If LPT manages to stay above **$15**, the key **resistance levels** to watch are:
- **$16**
- **$18**
- **$21**
These are the price points where the coin might face selling pressure, which could slow down or reverse its upward movement. 🚀
🔽 **Support Levels**:
However, if the price **doesn't hold** at **$15** and starts to fall, the next **support levels** to keep an eye on are:
- **$14**
- **$11**
These levels could act as a floor for the price if there’s a downturn. 🛑
⚠️ **Not Financial Advice**:
Just a reminder, this isn’t financial advice. Always do your own research and trade responsibly! 💡

TradeCityPro | LPTUSDT Weekly Watchlist Coin👋 Welcome to TradeCityPro Channel!
Let’s analyze our triggers before global markets open. It is expected that we might enter a range-bound market phase, experiencing both time and price corrections.
🌐 Overview Bitcoin
Before our short analysis, let’s review Bitcoin: Unfortunately, Bitcoin did not break above 99079, which means the bullish momentum did not start. In my opinion, this will lead to an extended range-bound market, possibly lasting through the Christmas holidays.
Bitcoin dominance is also trying to create a lower high compared to 61.1%, and it is currently without much movement. This indicates that the range is likely to continue.
For now, I suggest avoiding new positions to protect your stop-losses for more critical levels. Instead, focus on learning, finding suitable coins, or engaging in DeFi activities because when the market moves, you won’t have time for these things.
📊 Weekly Timeframe
In the weekly time frame, LPT is one of the coins that has created a higher low compared to the previous year. Its upward movement started in 2023, and currently, it is oscillating within its large weekly box, ranging from 9.14 to 22.189.
Usually, cryptocurrencies show sharp movements after breaking out of their weekly accumulation or re-accumulation zones, making them worth the risk.
Why Not Buy Within the Box? Personally, I do not buy within the box as part of my strategy because I don’t like to keep my funds idle for too long.
I want to use my capital actively to generate profits, rather than having it tied up for a year in a coin that may not perform. Instead, I wait for buying momentum with a defined stop-loss.
For your purchase, make sure not to miss the 22.189 breakout. After breaking this level, you can enter with a stop-loss at the bottom of the box and hold for the mid-term.
If you already hold this coin, I recommend exiting if the weekly candle closes below 9.143. You can re-enter the box later, even though fewer coins may be acquired. This strategy helps you avoid long-term downtrends.
Using Fibonacci based on the 2023 low, the coin’s correction reached 50% Fibonacci and Dow Theory. This demonstrates the critical nature of the 9.143 level as support, which will not be easily lost, Price targets based on Fibonacci levels - 37.632 - 55.317 - 90.262 - 168.239 (if 22.189 resistance is broken).
💡 BTC Pair Insight
The BTC pair of LPT is within its weekly box and has fake-broken its support, returning to the range. The current weekly candle is closing green, indicating the possibility of moving toward the upper boundary. Confirmation comes with a break of 0.0002088 and RSI above 61.23.
Due to the coin's low trading volume, we cannot analyze the lower time frames for this pair. Before buying, ensure a trigger exists in the BTC pair; otherwise, there are likely better coins available for investment.
📝 Final Thoughts
Stay calm, trade wisely, and let's capture the market's best opportunities!
This analysis reflects our opinions and is not financial advice.
Share your thoughts in the comments, and don’t forget to share this analysis with your friends! ❤️

LPTUSDT Analysis: A Unique Pump Among AltcoinsLPT has been one of the few altcoins to pump from a meaningful level recently, setting it apart from others in the market.
I find it logical to consider buys below the red line , as this aligns with the key demand regions I have identified. Using advanced tools like heatmap , cumulative volume delta (CVD) , and volume footprint , I pinpoint highly accurate zones where buyers are likely to dominate.
Key Points:
Unique Performer: LPT stands out as the only altcoin with a meaningful pump recently.
Red Line Zone: Below this line, buy entries are worth considering.
Techniques Used: Heatmap, CVD, and volume footprint to identify demand regions.
If you'd like to learn how I use these techniques to determine accurate demand regions, just DM me!
If you think this analysis helps you, please don't forget to boost and comment on this. These motivate me to share more insights with you!
I keep my charts clean and simple because I believe clarity leads to better decisions.
My approach is built on years of experience and a solid track record. I don’t claim to know it all, but I’m confident in my ability to spot high-probability setups.
If you would like to learn how to use the heatmap, cumulative volume delta and volume footprint techniques that I use below to determine very accurate demand regions, you can send me a private message. You can find me as XU99Official in every platform.
My Previous Analysis
🐶 DOGEUSDT.P: Next Move
🎨 RENDERUSDT.P: Opportunity of the Month
💎 ETHUSDT.P: Where to Retrace
🟢 BNBUSDT.P: Potential Surge
📊 BTC Dominance: Reaction Zone
🌊 WAVESUSDT.P: Demand Zone Potential
🟣 UNIUSDT.P: Long-Term Trade
🔵 XRPUSDT.P: Entry Zones
🔗 LINKUSDT.P: Follow The River
📈 BTCUSDT.P: Two Key Demand Zones
🟩 POLUSDT: Bullish Momentum
🌟 PENDLEUSDT.P: Where Opportunity Meets Precision
🔥 BTCUSDT.P: Liquidation of Highly Leveraged Longs
🌊 SOLUSDT.P: SOL's Dip - Your Opportunity
🐸 1000PEPEUSDT.P: Prime Bounce Zone Unlocked
🚀 ETHUSDT.P: Set to Explode - Don't Miss This Game Changer
🤖 IQUSDT: Smart Plan
⚡️ PONDUSDT: A Trade Not Taken Is Better Than a Losing One
💼 STMXUSDT: 2 Buying Areas
🐢 TURBOUSDT: Buy Zones and Buyer Presence
🌍 ICPUSDT.P: Massive Upside Potential | Check the Trade Update For Seeing Results
🟠 IDEXUSDT: Spot Buy Area | %26 Profit if You Trade with MSB
📌 USUALUSDT: Buyers Are Active + %70 Profit in Total
I stopped adding to the list because it's kinda tiring to add 5-10 charts in every move but you can check my profile and see that it goes on..

LPTUSDT 1WLPT Update ~ 1W
#LPT Retesting this support line,. if you still have Conviction on the coin,. Buy in increments from here, with a minimum target of 20%+

LPTU is CHARGED!! $30?LPTU as addressed on my previous analysis ditto happened, Hiragagna on the make! Yellow Boxes is the STOPS ideal buys go now ( Though little bit more down can be done) and look for the big trades. SUCH Big candles much wow!

LPTU is done? What's nExt? 50$?Ive mentioned LPTU alot of times and did mark my words a lot. Upon finding I've seen its on the verge of a formation of triple tops, As shown below on the 12H chart below
and the below is contrasting squeezed LPTU 4HR charts to get a good contrast where to initiate it.
For FOMO people, Small shorts can be taken from CMP, with slowly maximising it to all on the green box at 27 dollars, High chances are there small shorts, can be closed when reaches the green line, So if u are taking shorts here, book on the green line to again buy it from it. Once it breaks, 15.583 is evident!
So what you need to do? - Short now to green line and again after moving or showing actions of reversal book it and initiate final shorts from the top!

TradeCityPro | LPT : Testing Key Levels with Bullish Momentum👋 Welcome to TradeCityPro!
In this analysis, I’m going to review the LPT coin, one of the projects in AI and Media. The analysis will cover both weekly and daily timeframes.
📅 Weekly Timeframe: Engaging with a Key Resistance
In the weekly timeframe, after breaking 9.415 and reaching the resistance at 22.569, the price entered a range between these two levels. Currently, it has reached the resistance at 22.569 for the third time. Significant buying volume has entered the market, and considering Bitcoin’s bullish momentum and the correlation between altcoins and Bitcoin, the probability of breaking this level is high.
📈 If this level is broken, the next resistances will be 31.516 and 63.738. Breaking 63.738 could likely lead to a new ATH.
✨ In the case of a correction, the most critical factor is the 41.57 level on the RSI, which should not be lost. As long as the RSI remains above this level, the market momentum is seen as bullish.
🔽 The key price level for a potential correction is 9.415. If this support is broken, the next levels are 5.451 and 3.787.
📅 Daily Timeframe: Decreasing Bullish Momentum
On the daily timeframe, after breaking the ascending trendline near the bottom of the range, the price managed to move toward the top of the box without any significant correction. However, with the RSI returning below 70, the bullish momentum has decreased.
📉 In the event of a correction, the first support level in this timeframe is 15.485. If this level is broken, the next support is the bottom of the box at 9.967.
🔼 If the price breaks through 23.423, the next resistance will be 31.003, which the price could reach upon a successful breakout.
📝 Final Thoughts
This analysis reflects our opinions and is not financial advice.
Share your thoughts in the comments, and don’t forget to share this analysis with your friends! ❤️

LPTUSDT: Critical Levels to Watch – Will Bulls Defend the Line?Yello, Paradisers! Are you prepared for the critical moves ahead on #LPTUSDT? This setup is heating up, and the next few days could define the trend’s future. Let’s dive in.
💎#LPT is eyeing a retest of the $17.7 - $16.4 support zone. If this area holds, we could see buyers stepping in to fuel a bullish continuation, potentially targeting the major resistance zone. This would align with the broader bullish trend we’ve been tracking.
💎But here’s where it gets tricky. Things could turn ugly if LPT fails to rebound at this support and breaks below it. The price could spiral down toward the $13.7 - $12.5 demand zone. From here, bulls must make a stand and reclaim the lost support to keep the bullish scenario alive.
💎If the daily candle closes below the demand zone, it will confirm a bearish breakdown, with the potential for an even deeper dip.
Stay focused and wait for clear signals before making your move. This is how you ensure long-term profitability.
MyCryptoParadise
iFeel the success🌴

lptIn the orange lines, we have a resistance zone, at lower points, check for buying, if the resistance is broken, it can go to higher points.

LPTUSDT 1WLPT ~ 1W
#LPT Do you still have Conviction on this coin? If yes,. This support block would be a good buy spot for now. buy in stages, Target 20%+
