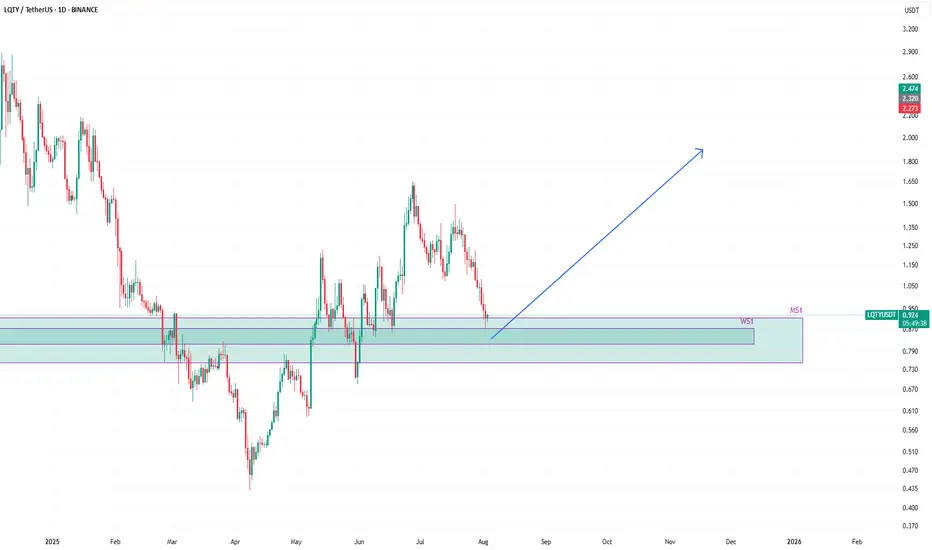
LQTYUSDT to bounce from weekly support around 0.85#LQTY #LQTYUSD #LQTYUSDT $lqty
LQTYUSDT has tapped into monthly support zone MS1.
There is a confluence of weekly and monthly support there.
While tapping into monthly support, the price has barely touched the weekly support WS1 as well.
This zone of WS1 is very likely to reverse the price and this might already be in progress.
In case price still has some downward move left, it may go deep into WS1 zone and possibly in lower part of MS1 zone.
However, it is likely that it is going to reverse from WS1 zone if it has not done so yet.
This reversal will lead the price to go beyond the current all time high reached around 1.65.
LQTYUSD
Liquity - Setting up for a big move - 113%Looks like a few coins are getting ready to make some killer moves. LQTY looks ready to kick things off over the next several hours for a potential aggressive run.
In the 2H:
-RSI/Stoch & MACD look primed for a bullish flip.
-The short EMAs are supported by 55EMA . We need this to continue and get them to traverse over the Median line of the BB.
-Look for accelerated moves as the candles find support from the 5EMA and, even more aggressive, the upper/outer BB!
I'm estimating it to culminate sometime tomorrow evening.
Let's so what happens!

#LQTY/USDT#LQTY
The price is moving within a descending channel on the 1-hour frame, adhering well to it, and is heading for a strong breakout and retest.
We are seeing a bounce from the lower boundary of the descending channel, which is support at 0.986.
We have a downtrend on the RSI indicator that is about to be broken and retested, supporting the upward trend.
We are looking for stability above the 100 moving average.
Entry price: 1.011
First target: 1.053
Second target: 1.114
Third target: 1.177

LQTYUSDT 1D Analysis LQTY ~ 1D Analysis
#LQTY Buy after successfully breaking this resistance line with a short term target of at least 15%+ from here.

LQTYUSDT Eyes Rebound from Strong Support!LQTYUSDT technical analysis update
LQTYUSDT is trading at a strong support zone, where the price has touched multiple times and bounced back in the past. We can expect a similar bounce from the current support level. Additionally, in the daily chart, the RSI has dropped below 30, which is another bullish sign for LQTY.

LQTYUSDT Bouncing Back!LQTYUSDT Technical analysis update
LQTYUSDT has bounced off a strong support zone, the same level where it previously showed a strong rebound. A bullish RSI divergence is visible on the daily chart, suggesting a potential bullish move from the current levels.
Buy zone : Below $0.76
Stop loss : $0.625

LQTYUSDT 4DLQTY ~ 4D Analysis
#LQTY Buy gradually from here if you still have a Conviction on this Coin with a minimum target of 20%+.

Precision Trading – The Sniper Entry is Coming!LQTYUSDT Analysis
Precision Trading – The Sniper Entry is Coming! 🎯💥
“I know I’m aiming a little lower, but listen – that’s what makes a great trader. I don’t chase, I wait. I snipe the perfect entry, and when the time comes, boom – we hit big!”
Here’s the Setup:
Blue Box = High-Profit Zone – If CDV, lower time frame breakouts, and volume profile confirm, this area could be golden for a high-RR entry.
Patience Wins the Game – We don’t buy blindly, we wait for the right moment. A sniper doesn’t fire without a target, and neither do we!
Momentum Confirmation is Key – When the breakout happens, you don’t want to be late – position early, trade smart, profit big.
Final Thoughts:
“I’ll be watching CDV, volume profile, and liquidity heatmap like a hawk. No confirmation? No trade. But when the signal comes? We strike with precision and dominate!”
Good luck, traders – this could be an absolute monster! 🚀🔥
Let me tell you, this is something special. These insights, these setups—they’re not just good; they’re game-changers. I've spent years refining my approach, and the results speak for themselves. People are always asking, "How do you spot these opportunities?" It’s simple: experience, clarity, and a focus on high-probability moves.
Want to know how I use heatmaps, cumulative volume delta, and volume footprint techniques to find demand zones with precision? I’m happy to share—just send me a message. No cost, no catch. I believe in helping people make smarter decisions.
Here are some of my recent analyses. Each one highlights key opportunities:
🚀 RENDERUSDT: Strategic Support Zones at the Blue Boxes +%45 Reaction
🎯 PUNDIXUSDT: Huge Opportunity | 250% Volume Spike - %60 Reaction Sniper Entry
🌐 CryptoMarkets TOTAL2: Support Zone
🚀 GMTUSDT: %35 FAST REJECTION FROM THE RED BOX
🎯 ZENUSDT.P: Patience & Profitability | %230 Reaction from the Sniper Entry
🎯 DEXEUSDT %180 Reaction with %9 Stop
🐶 DOGEUSDT.P: Next Move
🎨 RENDERUSDT.P: Opportunity of the Month
💎 ETHUSDT.P: Where to Retrace
🟢 BNBUSDT.P: Potential Surge
📊 BTC Dominance: Reaction Zone
🌊 WAVESUSDT.P: Demand Zone Potential
🟣 UNIUSDT.P: Long-Term Trade
🔵 XRPUSDT.P: Entry Zones
🔗 LINKUSDT.P: Follow The River
📈 BTCUSDT.P: Two Key Demand Zones
🟩 POLUSDT: Bullish Momentum
🌟 PENDLEUSDT.P: Where Opportunity Meets Precision
🔥 BTCUSDT.P: Liquidation of Highly Leveraged Longs
🌊 SOLUSDT.P: SOL's Dip - Your Opportunity
🐸 1000PEPEUSDT.P: Prime Bounce Zone Unlocked
🚀 ETHUSDT.P: Set to Explode - Don't Miss This Game Changer
🤖 IQUSDT: Smart Plan
⚡️ PONDUSDT: A Trade Not Taken Is Better Than a Losing One
💼 STMXUSDT: 2 Buying Areas
🐢 TURBOUSDT: Buy Zones and Buyer Presence
🌍 ICPUSDT.P: Massive Upside Potential | Check the Trade Update For Seeing Results
🟠 IDEXUSDT: Spot Buy Area | %26 Profit if You Trade with MSB
📌 USUALUSDT: Buyers Are Active + %70 Profit in Total
🌟 FORTHUSDT: Sniper Entry +%26 Reaction
🐳 QKCUSDT: Sniper Entry +%57 Reaction
📊 BTC.D: Retest of Key Area Highly Likely
This list? It’s just a small piece of what I’ve been working on. There’s so much more. Go check my profile, see the results for yourself. My goal is simple: provide value and help you win. If you’ve got questions, I’ve got answers. Let’s get to work!

LQTYUSDT: Blue Boxes in Focus for Bullish Breakouts
LQTYUSDT: Blue Boxes in Focus for Bullish Breakouts 🔵
LQTYUSDT is shaping up to be a fascinating chart, and here’s the plan:
Blue Boxes Matter: These zones are where I’ll be watching closely for potential upward market structure breaks.
Key Indicators: Confirmation will come from tools like CDV (Cumulative Delta Volume) and volume profile . These will tell us if buyers are stepping in with conviction.
Lower Time Frames: I’ll be analyzing 1H or lower charts for precise entry signals.
My Approach:
Patience is everything. No action until we see those bullish signals—low timeframe breakouts and buyer strength are non-negotiable!
Stay tuned, traders. Boost, comment, and follow for more sharp market insights! 🚀
Let me tell you, this is something special. These insights, these setups—they’re not just good; they’re game-changers. I've spent years refining my approach, and the results speak for themselves. People are always asking, "How do you spot these opportunities?" It’s simple: experience, clarity, and a focus on high-probability moves.
Want to know how I use heatmaps, cumulative volume delta, and volume footprint techniques to find demand zones with precision? I’m happy to share—just send me a message. No cost, no catch. I believe in helping people make smarter decisions.
Here are some of my recent analyses. Each one highlights key opportunities:
🚀 RENDERUSDT: Strategic Support Zones at the Blue Boxes +%45 Reaction
🎯 PUNDIXUSDT: Huge Opportunity | 250% Volume Spike - %60 Reaction Sniper Entry
🌐 CryptoMarkets TOTAL2: Support Zone
🚀 GMTUSDT: %35 FAST REJECTION FROM THE RED BOX
🎯 ZENUSDT.P: Patience & Profitability | %230 Reaction from the Sniper Entry
🐶 DOGEUSDT.P: Next Move
🎨 RENDERUSDT.P: Opportunity of the Month
💎 ETHUSDT.P: Where to Retrace
🟢 BNBUSDT.P: Potential Surge
📊 BTC Dominance: Reaction Zone
🌊 WAVESUSDT.P: Demand Zone Potential
🟣 UNIUSDT.P: Long-Term Trade
🔵 XRPUSDT.P: Entry Zones
🔗 LINKUSDT.P: Follow The River
📈 BTCUSDT.P: Two Key Demand Zones
🟩 POLUSDT: Bullish Momentum
🌟 PENDLEUSDT.P: Where Opportunity Meets Precision
🔥 BTCUSDT.P: Liquidation of Highly Leveraged Longs
🌊 SOLUSDT.P: SOL's Dip - Your Opportunity
🐸 1000PEPEUSDT.P: Prime Bounce Zone Unlocked
🚀 ETHUSDT.P: Set to Explode - Don't Miss This Game Changer
🤖 IQUSDT: Smart Plan
⚡️ PONDUSDT: A Trade Not Taken Is Better Than a Losing One
💼 STMXUSDT: 2 Buying Areas
🐢 TURBOUSDT: Buy Zones and Buyer Presence
🌍 ICPUSDT.P: Massive Upside Potential | Check the Trade Update For Seeing Results
🟠 IDEXUSDT: Spot Buy Area | %26 Profit if You Trade with MSB
📌 USUALUSDT: Buyers Are Active + %70 Profit in Total
🌟 FORTHUSDT: Sniper Entry +%26 Reaction
🐳 QKCUSDT: Sniper Entry +%57 Reaction
📊 BTC.D: Retest of Key Area Highly Likely
This list? It’s just a small piece of what I’ve been working on. There’s so much more. Go check my profile, see the results for yourself. My goal is simple: provide value and help you win. If you’ve got questions, I’ve got answers. Let’s get to work!

LQTYUSDT 1WLQTY ~ 1W
#LQTY So far it continues to maintain its bullish structure. Buy gradually within this support block, with a minimum target of 20%+

LQTYUSDT Breaks Channel !LQTYUSDT technical analysis update
BINANCE:LQTYUSDT price formed a descending channel pattern on the weekly chart. After 630 days of formation, the price has broken above the channel resistance. With a noticeable rise in volume, we can expect a strong bullish move in the coming days.
Stop Loss: $1.00
Target: 200-500%
Regards
Hexa

LQTYUSDTLQTY ~ 2D
#LQTY If you have Conviction on this coin. This support block is great to start buying back.

Any jump up for LQTY - risky setupLQTY looks very bullish on a chart. One of my favorite recently. If price break up and test all time high on the chart, it can run a lot. This trade is risky - market is slow and btc unclear. Buy and sell levels are on the chart.
NOT A FINANCIAL ADVICE + MANAGE YOUR RISK AND USE STOPLOSS

LQTY ROADMAP (2D)Before anything, pay attention to the time frame, the time frame is big.
From where we put the red arrow on the chart, it looks like the LQTY correction has started.
This appears to be an ABC correction with a more complex pattern now that we are in wave C.
Wave C appears to be a diametric diamond. We are now in the middle of wave E of this diametric.
It can move from the red box to the green box.
We are looking for sell/short positions in the supply range.
We have such a view on LQTY.
Closing a daily candle above the invalidation level will violate the analysis.
For risk management, please don't forget stop loss and capital management
Comment if you have any questions
Thank You

Liquity / LQTY & Binance The price of LQTY is $2.3 today with a 24hour trading volume of 80 million dollars. This represents a 80% price increase in the last 24 hours and a 250% price increase in the past 30 days. With a circulating supply of 91 Million LQTY, Liquity is valued at a market cap of 200 million dollars thanks to CZ!
Liquity is a decentralized borrowing protocol built on Ethereum that utilizes LQTY, a USD-pegged stablecoin. Ether holders can draw loans in the form of LQTY with algorithmically adjusted redemption and loan issuance fees
as you see LQTY whales are notorious for dumping on retails so don't forget the stop loss(rug). next targets are 2.7 and 2.9$

#LQTY/USDT#LQTY
The price is moving within an ascending channel on a 12-hour frame
We have a support area at 0.900 and we bounced from it at the lower border of the channel
We have a tendency to stabilize above the Moving Average 100
We have an upward trend on the RSI indicator that supports the rise and gives greater momentum
Entry price 1.16
The first goal is 1.33
Second goal 1.46
Third goal 1.46

LQTY looks bullishIt seems that we are in a large diametric where the price is trying to enter the G wave of this diametric.
If the price returns to the green range, we will look for buy/long positions
The G wave of this diametric is a bullish wave.
The targets are clear on the chart.
Closing a daily candle below the invalidation level will violate the analysis.
For risk management, please don't forget stop loss and capital management
When we reach the first target, save some profit and then change the stop to entry
Comment if you have any questions
Thank You

LQTY 1,535 Long. 🚀🚀🚀 LQTY 1,535 Long.
🤖🔥 There is accumulation in a narrow range at 1.535 level
🚀 "Breakout" trade entry model
1st target 1.839
Profit, everyone.

LQTY Short - initial target 1.22, 0.51.67 Long Target hit.
Based on LQTY and general market structure I'm expecting major drop in price to new lows over the next month before a new long entry around $0.5.
LQTY is a risky asset so no guarentees it doesn't try for higher. A $1.95 high might form a H&S over the coming weeks with a target of $0.5 based on current structure so it might be possible.
Best, Hard Forky

My favorite chart in crypto right now- $LQTY. 140-700% upside?$LQTY has been in a downtrend for over 2 years, recently broke out of it and then retested the trend line as support.
We've had an initial thrust off the bottom and have now retraced 60%+ from that move, which leads me to believe, it's finally time for this thing to start it's real run higher.
We're currently testing the bottom of the cloud, if the cloud holds as support, then I think we'll see a large move higher.
The first resistance I'll be looking for is $4.40, however there's potential that we could see continuation all the way up to the final resistance in the $14 range.
Let's see how it plays out over this month.

Liquity (LQTY) completed a setup for upto 27% pumpHi dear friends, hope you are well and welcome to the new trade setup of Liquity (LQTY) with US Dollar pair.
Recently we caught almost 13% pump of LQTY as below:
Now on a 4-hr time frame, LQTY has formed a bullish Butterfly move for the next price reversal move.
Note: Above idea is for educational purpose only. It is advised to diversify and strictly follow the stop loss, and don't get stuck with trade.

LQTY ANALYSIS (1D)LQTY seems to have started an ascending diametric from where we entered the "Strat" on the chart.
We now seem to be in wave E. Wave E appears to be an abc or more complex pattern. It is expected that we will see upward movements after the completion of wave b of E.
A flip area is formed on the chart. The completion of wave b of E should be on this area.
Closing a daily candle below the invalidation level will violate the analysis
For risk management, please don't forget stop loss and capital management
When we reach the first target, save some profit and then change the stop to entry
Comment if you have any questions
Thank You

LQTYUSD 3D#LQTY ~ 3D
#LQTY Bulls Dominate As Long As Price Maintains The Support Line in this pattern. Minimum target 10% from here.
