#LRC Ready for a Massive Recovery From Here | Must Watch Yello, Paradisers! Is #LRCUSDT finally ready for a breakout, or is it just another trap for early bulls? Let's break down the current structure of #LRC.
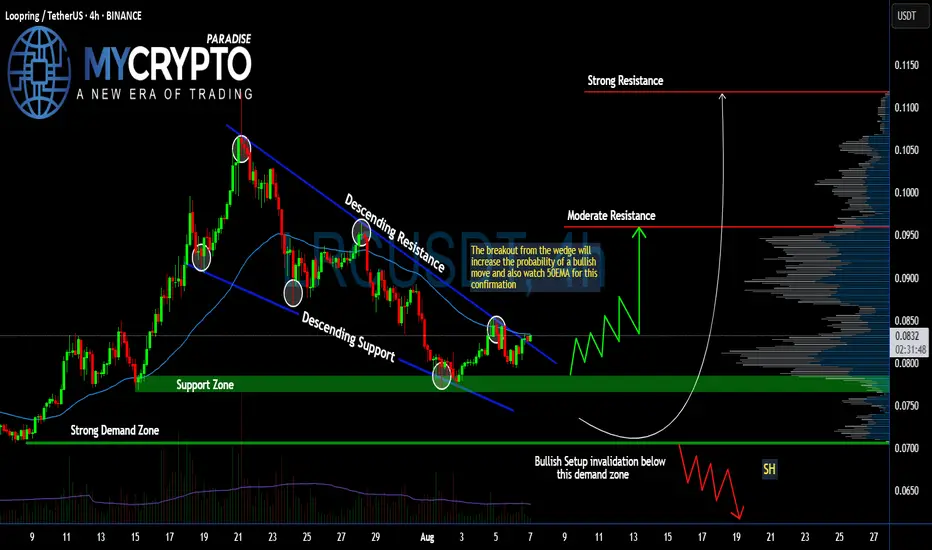
💎#Loopring ( CAPITALCOM:LRC ) has been moving within a descending wedge pattern for weeks, with price consistently making lower highs and lower lows—clearly respecting both descending resistance and support levels. However, we are now starting to see signs of change as it retests the upper trendline.
💎A breakout above the descending resistance is about to occur, and it’s doing so right around the 50EMA, which adds further confluence for a possible bullish move. This move is increasing the probability of a short-term trend reversal.
💎The support zone around $0.078–$0.082 is the key region to watch now. If bulls can hold above this zone and reclaim it as a base, we could see a breakout continuation toward the moderate resistance at $0.096. Should momentum build up from there, the next big target is the strong resistance at $0.1118—a level marked by historical seller interest and significant volume profile resistance.
💎However, if #LRCUSD falls below the strong demand zone at $0.0706, this entire bullish setup becomes invalid. That breakdown would suggest the market isn't ready yet, and could trigger another wave down toward fresh lows.
Stay patient, Paradisers. Let the breakout confirm, and only then do we strike with conviction.
MyCryptoParadise
iFeel the success🌴
Lrcusd
LRC/USDT 1W – Final Test Before a Major Reversal?> Loopring (LRC) is currently sitting at a critical long-term support zone, and the next few weeks could determine whether a strong reversal or deeper decline will follow.
---
🧠 Macro Overview:
After falling more than 97% from its all-time high (ATH) of $3.0596, LRC is now revisiting a historical demand zone between $0.0657–$0.0821. This area has acted as a powerful launchpad during previous cycles and remains a major accumulation zone.
---
🔎 Technical Structure & Price Action:
✅ Historical Demand Zone (Strong Support)
Marked by the yellow box, this range has historically triggered major price rallies.
Buyers have consistently stepped in at this level since early 2021.
✅ Possible Double Bottom Formation
A potential double bottom pattern is forming in this zone. A breakout above $0.1189 would confirm the bullish reversal structure.
✅ Low Volume = Volatility Brewing
Current low-volume environment could indicate quiet accumulation before a potential breakout.
✅ Weakening Downtrend
The multi-year downtrend is still intact, but the selling momentum is fading as price consolidates in this key support area.
---
🟢 Bullish Scenario (Reversal or Relief Rally):
1. Price holds and bounces from the $0.0657–$0.0821 demand zone.
2. Breakout above $0.1189 (initial resistance) opens the door for:
🎯 $0.1632 – First key resistance.
🎯 $0.3205 & $0.4398 – Mid-term resistance levels.
🎯 $1.1848 – Long-term recovery target if altcoin momentum returns.
> A weekly candle close above $0.1632 with strong volume would confirm the bullish trend shift.
---
🔴 Bearish Scenario (Support Breakdown):
1. A breakdown below $0.0657 would invalidate the support zone.
2. Potential downside targets:
⚠️ $0.0550 – Psychological support.
⚠️ Uncharted territory below $0.0550 could trigger panic selling and deeper declines.
> In this case, strict risk management is essential, as breaking this zone may lead to a fresh leg down in price discovery.
---
📈 Strategy & Outlook:
Short-term/Swing Traders:
Consider speculative entries within the support zone with tight stop-losses below $0.0657.
Wait for a confirmed breakout above $0.1189–$0.1632 for trend validation.
Long-term Investors:
This zone presents a compelling Dollar-Cost Averaging (DCA) opportunity with high reward potential.
However, maintain capital discipline in case of deeper downside risk.
---
💡 Conclusion:
> LRC is at a make-or-break level.
If this historical support holds and volume kicks in, we could be witnessing the early signs of a major weekly reversal.
But if the support fails, it may enter a new bearish phase with further downside.
#LRCUSDT #Loopring #AltcoinReversal #CryptoSupportZone #CryptoAnalysis #TechnicalAnalysis #SwingTradeSetup #BearishOrBullish #LRCChart #CryptoOpportunities

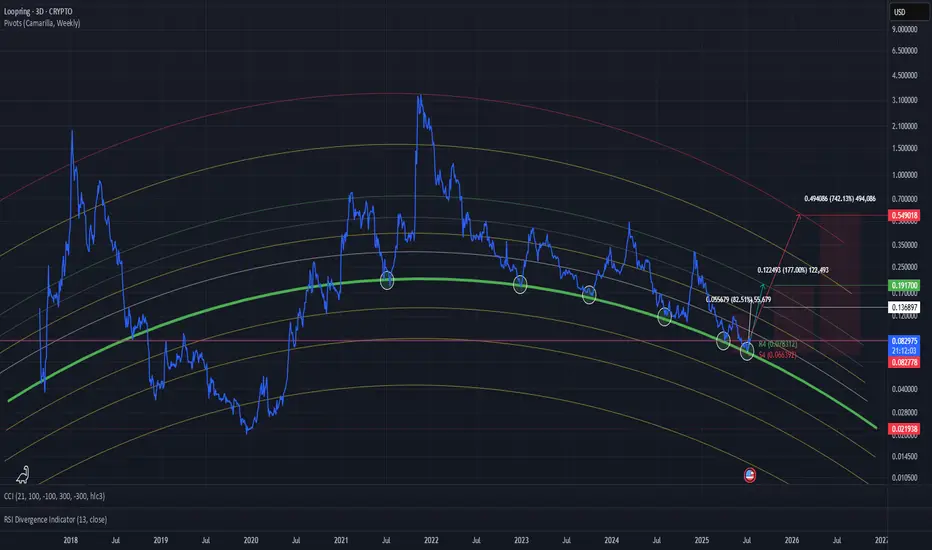
LRC/USDTI’m not sure if there’s a specific method of analysis for this, but it’s clear how precisely the coin reacts to these levels.
That’s why I dare to assume we won’t go any lower.
The green line has consistently acted as a strong support — almost like a trampoline that price bounces off.
All realistic and objective targets are already marked on the chart.
Additionally, the weekly Camarilla Pivot is showing significant strength right now, which adds further bullish confluence.
LRCUSDT 1WLRC ~ 1W Analysis
#LRC This is the lowest support at this time, maybe you can consider starting to buy back from here with a short -term target of at least 15%+

LRCUSDT 1WLRC ~ 1W Analysis
#LRC If you still have a Conviction on this coin. Maybe you can consider this support to start buying back from here with a minimum target of 20%+.

LRCUSDT 1WLRC ~ 1W
#LRC If you still have Conviction on this coin,. Don't miss this trade, Buy and take profit of at least 20%+

LRCUSDT 1WLRC ~ 1W
#LRC If you still have Conviction on this coin,. This support block will be a very good buying spot for now, Buy it gradually with a target of at least 20%++

Loopring completed very sneaky right shoulder just b4 goldencrssLoopring snuck in this extremely small right shoulder and price action has now retested the neckline as support right before Oo prints golden cross is set to occur. I’m guessing the breakout up from the inverseheadandshoulders is validated very close to when the cross occurs. *not financial advice*

LRC is Setting Up BIG!Loopring (LRC) is presenting an excellent opportunity with a confluence of technical factors aligning at the old high demand zone. This area holds significant importance as it combines the strength of a multi-tap demand zone with a Fibonacci retracement level, enhancing its reliability for a potential bounce.
Why the Old High Demand Zone is Key
3-Tap Test:
The price has tapped into this demand zone multiple times, signaling its strength as a support level. Each tap reinforces the zone, indicating buyer interest and the likelihood of a reversal from this level.
Historical Significance:
This zone corresponds to a previous high where LRC established strong momentum. Retesting old highs as support is a common bullish continuation pattern, suggesting this area is crucial for price stability.
Fibonacci Confluence:
The demand zone aligns perfectly with a key Fibonacci retracement level (e.g., 0.618 or 0.786). Fibonacci levels are widely respected in the market, making this zone even more attractive for an entry.
Why This Setup Stands Out
High-Probability Reversal: The confluence of factors increases the likelihood of a strong bounce, making it an ideal point to join the trend.
Low Risk, High Reward: Entering near this zone offers a tighter stop-loss and greater upside potential if the price rebounds.
Market Structure Support: The demand zone holds significance in maintaining the bullish structure of LRC.
How to Approach This Trade
Spot Buy at the Demand Zone: Place buy orders within the old high demand zone, ensuring you're positioned at this critical level.
Watch for Confirmation: Look for bullish price action, such as candlestick patterns (e.g., hammer or engulfing candles) or increasing volume near the zone.
Set a Stop-Loss: Place a stop-loss slightly below the demand zone to protect against invalidation.
Hold for a Fibonacci Extension: If the price bounces, aim for higher Fibonacci extension levels as potential targets.
I keep my charts clean and simple because I believe clarity leads to better decisions. Trading doesn’t have to be overly complicated, and I enjoy sharing setups that have worked well for me.
My approach is built on years of experience and a solid track record. I don’t claim to know it all, but I’m confident in my ability to spot high-probability setups. It’s all about learning and growing together as traders, and I’m here to share what I see.
The markets can confirm what the charts whisper if we’re paying attention. I hope these levels help you as much as they’ve helped me in the past. Let’s see how this plays out!
Tip of The Iceberg
🐶 DOGEUSDT.P: Next Move
🎨 RENDERUSDT.P: Opportunity of the Month
💎 ETHUSDT.P: Where to Retrace
🟢 BNBUSDT.P: Potential Surge
📊 BTC Dominance: Reaction Zone
🌊 WAVESUSDT.P: Demand Zone Potential
🟣 UNIUSDT.P: Long-Term Trade
🔵 XRPUSDT.P: Entry Zones
🔗 LINKUSDT.P: Follow The River
📈 BTCUSDT.P: Two Key Demand Zones
🟩 POLUSDT: Bullish Momentum

#LRC/USDT Ready to go up#LRC
The price is moving in a descending channel on a 1-day frame and sticking to it well
We have a bounce from the lower limit of the descending channel, this support is at 0.2112
We have a downtrend on the RSI indicator that is about to be broken, which supports the rise
We have a trend to stabilize above the moving average 100
Entry price 0.2150
First target 0.2258
Second target 0.2331
Third target 0.2427

LRCUSDT 1WLRC ~ 1W
#LRC If you still have Conviction on this coin. buy in stages from here. With a minimum target of 20%+. It is only a matter of time until this resistance line is broken. and bullish will dominate

LRC looks bullishThe LRC appears to have completed a correction that was ABC and wave C was a terminal.
We are looking for buy/long positions on the green range
The target is the red box on the chart.
Closing a daily candle below the invalidation level will violate this analysis
For risk management, please don't forget stop loss and capital management
Comment if you have any questions
Thank You

LRCUSD LoopRing... Ring.. Ring. Hello? Like a phone, lol get it?
Okay, enough fun, time for the serious stuff.
Loopring is at support area, where things are flipping in the bullish direction
I don't know the exact point it moves, but I know .1 was an area of support on a past chart.
Take this move and probably compress the line, which isn't as accurate and more a guide to show the idea of a potential trend move to the upside.
Okay, here is help from AI
Here's an analysis based on the chart provided:
### Overview:
- **Asset:** Loopring (LRC) against USD on the BITSTAMP exchange.
- **Time Frame:** Weekly chart from 2023 projected into the future until 2028.
### Key Observations:
1. **Price Movement Analysis:**
- The chart displays a pattern where the price of Loopring has been oscillating within a broadening formation, often referred to as a "megaphone" pattern. This is characterized by an expanding range between resistance and support lines, suggesting increasing volatility.
2. **Technical Indicators:**
- **Price Levels:** The current price is at $0.04002, with a slight decrease (-0.17%) from the previous period.
- **Volume:** The volume on the trading day is 229K, indicating moderate trading activity.
3. **Trend Analysis:**
- **Support and Resistance:** The chart shows potential support around $0.02700 and resistance at approximately $0.07800. The price has been bouncing between these levels, with historical attempts to break above the upper resistance.
- **Divergence:** There appears to be a divergence between the price action and the RSI (Relative Strength Index). While the price has been making higher highs, the RSI hasn't followed suit, which could be a sign of weakening momentum, hinting at a possible correction or consolidation phase.
4. **RSI Indicator:**
- The RSI is currently in the neutral zone, neither overbought nor oversold, which might suggest a phase of indecision or consolidation in the market for Loopring.
5. **Future Projections:**
- **Trend Lines:** The chart includes two trend lines drawn in a way that suggests an anticipated breakout or continuation pattern. The upper line acts as a resistance that has yet to be decisively breached, while the lower line serves as a support. Given the broadening pattern, there's an expectation of a significant move, but the direction is uncertain based on this chart alone.
6. **Volume Analysis:**
- The volume bars show periods of high volume followed by lower volumes, typical in a broadening pattern where the market tests new highs and lows with less conviction each time.
### Potential Scenarios:
- **Bullish Scenario:** If the price breaks above the upper resistance line with strong volume, it could signal a bullish trend continuation. This would align with the broader market's bullish sentiment if other external factors are favorable.
- **Bearish Scenario:** A drop below the lower support line could indicate a bearish trend, potentially leading to a test of lower levels, around the 0.02370 region, indicated by the horizontal line.
### Trading Strategy Implications:
- **Entry Points:** For a bullish trade, one might look for a confirmation of a breakout above the resistance with increased volume. Conversely, for a bearish stance, a break below support could prompt a short position.
- **Exit Points:** Setting stop-losses just below support or above resistance could help manage risk effectively. For profit-taking, aiming for the next significant resistance or support levels as shown might be strategic.
### Recommendations:
- **Wait for Confirmation:** It might be wise to wait for a clear breakout in either direction before committing to a trade. False breakouts are common in broadening patterns, so volume and price action confirmation are crucial.
- **Time Frame Considerations:** Given the long-term nature of this chart, this analysis might be more suited for swing trading or long-term investment rather than day trading.
- **Backtesting:** Before live trading, backtest any strategy you might derive from this chart against historical data to gauge its effectiveness.
- **Market Sentiment:** Keep an eye on market sentiment and news related to Loopring or the broader crypto market. Fundamental analysis might also be necessary to understand why such patterns are forming, especially in the context of broader market trends.
### Conclusion:
The chart suggests Loopring might be at a critical juncture, potentially poised for a breakout. However, the broadening pattern's nature implies caution, as it can lead to either a significant rise or fall. Traders should use additional tools like moving averages, MACD, or Fibonacci retracement for more refined entry and exit points. Given the chart's time frame, patience and a cautious approach are recommended. Always remember, in trading, patience can be a virtue, and understanding the broader market context is crucial.
Remember, this is not financial advice, and while technical analysis provides insights, it's just one tool in a trader's toolkit. Always consider combining TA with fundamental analysis and market sentiment for a more comprehensive view.

LRC buy/long setup (4H)From where we placed the green arrow on the chart, we have a bullish pattern on the chart.
This pattern is diametric or triangular. In both scenarios, the price can move from the green range to the red box.
The targets are marked on the chart.
Closing a daily candle below the invalidation level will violate the analysis.
For risk management, please don't forget stop loss and capital management
When we reach the first target, save some profit and then change the stop to entry
Comment if you have any questions
Thank You

LRC/USD Local trend. Wedge. Capitulation zone 17 08 2024Logarithm. Time frame 3 days (no less).
The price is in the capitulation zone in a local descending wedge, after breaking the long-term horizontal channel. The percentages are shown from the key zones for clarity.
Linear without market noise.
Main trend (most of the price chart history).

LRC/USDT Main Trend 08/17/2024Main trend (the most visible part). Logarithm. Time frame 1 week. Loopring is an open protocol for building decentralized exchanges.
The price is in the capitulation zone in a local descending wedge, after breaking the long-term horizontal channel. The percentages are shown from the key zones for clarity.
The chart also shows the dynamic support/resistance zones of the Gann fan (bullish and bearish).
It is worth noting that the price is at a significant profit of crypto funds 4-26X, but most of the volume has already been redistributed.
Linear for clarity of the trend.
Secondary trend

LRC LOOKS BULLISHThis analysis is an update of the analysis that you can see at the bottom of this page, in the related analysis section
LRC Diametric seems to be complete. By maintaining the green range, it can move towards the targets.
Closing a candle below the invalidation level will violate the analysis
For risk management, please don't forget stop loss and capital management
When we reach the first target, save some profit and then change the stop to entry
Comment if you have any questions
Thank You

The last bullish chance of LRC in Mid term!Hi.
COINEX:LRCUSDT
😊Today, I want to analyze LRC for you in a WEEKLY time frame so that we can have a Mid-term view of LRC regarding the technical analysis. (Please ✌️respectfully✌️share if you have a different opinion from me or other analysts).
➡️As you can see, LRC is completed this pattern, and if it follows this pattern Price can grow a lot.
✅ Due to the Ascending structure of the chart...
- High potential areas are clear in the chart.
-LRC has been Bullish Recently!
-The odds of another Bullish Movement is High!
-Bullish Pattern is Visible on The chart!
-AB=CD
Stay awesome my friends.
_ _ _ _ _ _ _ _ _ _ _ _ _ _ _ _ _ _ _ _ _ _ _ _ _ _ _ _ _ _ _ _ _
✅Thank you, and for more ideas, hit ❤️Like❤️ and 🌟Follow🌟!
⚠️Things can change...
The markets are always changing and even with all these signals, the market changes tend to be strong and fast!!

#LRCUSDT LONG#LRC
Finally, we reached the upper limit of the downward channel
Since May 2023
At the same time, we are close to breaking the EMA 100
We have a large reversal pattern and the price looks set to break it
The price is expected to trade in an upward wave with price corrections
Current price 0.3310.
The first target is 0.4805.
The second target is 0.6294.

Loopring breaking up from descending channel target = 57.5 centsDefinitey looks like it’s validating the breakout here after 2 previous attempts that ended up going back inside the channel. 3rd time here is likely the charm but it needs to overcome the resitance of the weekly 200ma (in blue) first before it can hit the full target. *not financial advice*

Will the descending wedge on LRC give +50% in the future?Hello everyone! Haven't heard from me in a while? 😁
Today, I suggest taking a closer look at Loopring #LRC.
On the chart, a descending wedge pattern of technical analysis is forming. I think the asset is finding its bottom around the 0.236 Fibonacci level, and after that, it will break through the descending trend line of this pattern.
Potentially, you can gain +50% profit by entering at the bottom. If entering after the breakout of the descending trend line, it depends on the circumstances, but in any case, the profit will be at least 40%.
This is not financial advice; everything you do is at your own risk!

LRCUSD 1W LONG📈Hi all. Loopring is a protocol for building decentralized exchanges. It is an open protocol that allows developers to incorporate exchange functionality into decentralized applications (dApps). Loopring operates on the Ethereum and Qtum blockchains, and also plans to expand to NEO. It provides higher liquidity and improved pricing by matching orders in the form of order rings and combines off-chain order splitting with on-chain settlement. Loopring also offers high-performance non-custodial products such as the Loopring Wallet and Loopring L2 Web App.
Timeframe 1 week. LRCUSD is in a descending channel and has approached important support. Fractal repetition of growth is possible. There is a high probability of further decline to the 0.1719 zone. Therefore, the safest entry would be at a breakout/retest of the channel. It is also possible to spot with additional gains and trade in the channel itself. Marked goals and levels on the chart.

LRC ANALYSIS (1D)We have a large diametric for LRC, which now seems to be only the G wave, the final wave of this diametric.
The least risky and the best place to buy is the green range.
The target is marked on the chart.
For risk management, please don't forget stop loss and capital management
Comment if you have any questions
Thank You
