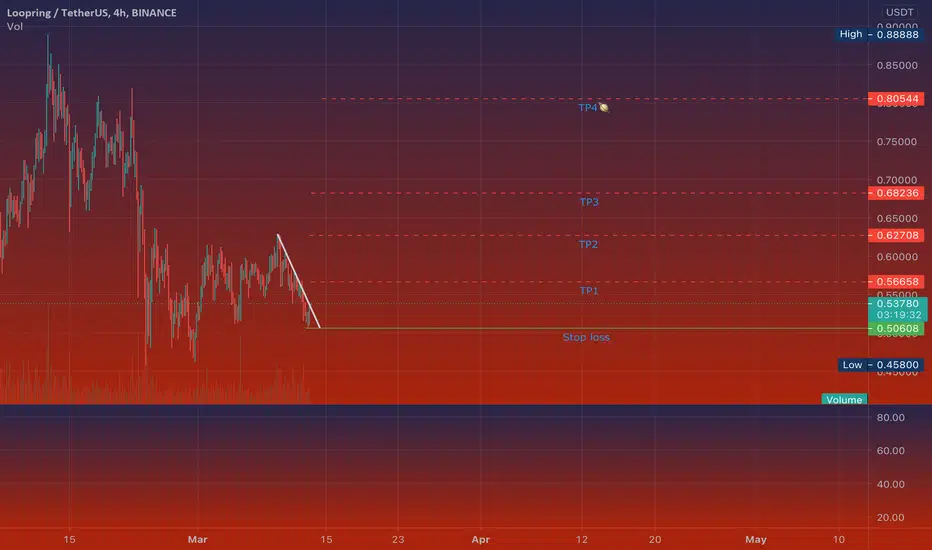
LRCUSDT has retested the previous strong resistance as support!#LRCUSDT
0.61568 entry
Take Profit 1: 0.66405
Take Profit 2: 0.70645
Take Profit 3: 0.74885
Stop Loss 0.52680
Reward: 24%
LRCUSDT has successfully retested the important level of 0.61.
Note: Trade at your own risk as crypto is fast with the possibility of potential gains or losses. I'm not your financial advisor.
Like the Idea if you feel it helpful.
#SyedMuneebAli #CryptoSeekho
Lrcusdt


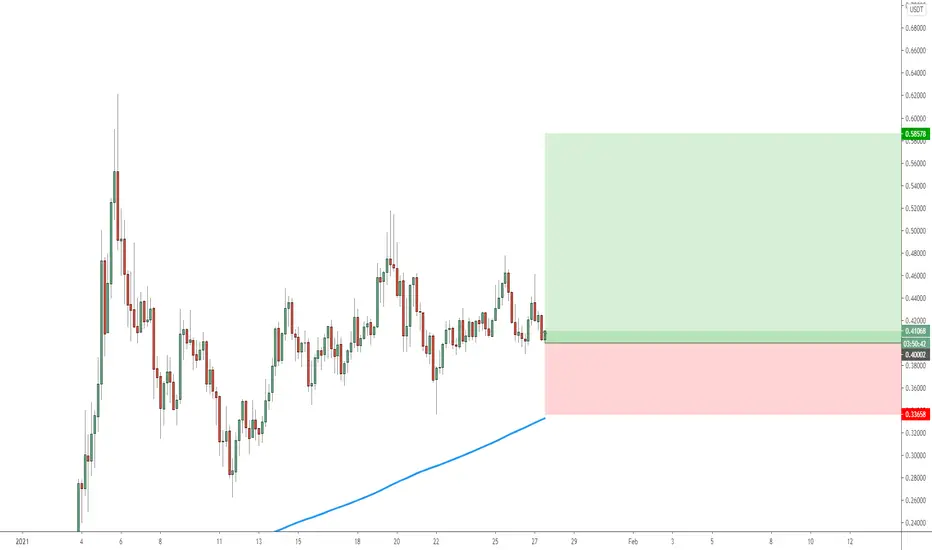
LRCUSDTHello to you all. Mars Signals team wishes you high profits at all times.
If LRC is able to break the white line the upside, then we can expect a bullish run. If the price does not succeed to break the white line, it will fall further.
Warning: This is just a suggestion to you and we do not guarantee profits.
Wish you luck!

10$ LRC is coming LRC is really cheap and can go really high in this bull run. It is very strong fundamentally and technically.


💡LRC: BUY Trade🚀🚀🚀🚀🚀🚀 #ALTSEASON2021📈#LRCUSDT
➡️Entry: 0.56$
🎯Target 1: 0.70$
🎯Target 2: 0.83$
🎯Target 3: 0.91$


💡LRC: BUY Trade🚀🚀🚀🚀🚀🚀 #ALTSEASON2021📈#LRCUSDT
➡️Entry: Last Price or 0.73500$
🎯Target 1: 0.80600$
🎯Target 2: 0.87500$
🎯Target 3: OPEN

Repeating some loops, Loopring?What seemed to be some slow growth with those loops up and down turns out be an admireable 3x upswing for LRC in one month. If the same pattern is repeated once more a great place to enter is at 0.7. Expected target with that pattern would be at 1 dollar. Remember, these patterns might subject to change without notice :)
Trade safe and take care
Cheers, Whoop

LRC to 10$LRC is on rocket and will go to MOON. look for this cheap DEFI coin which will make you RICH!!!!!


LRCUSDT SHORT OPORTUNITYLooking for the next 1h candle to go over the this one for a quick 10% scalp updates every time needed

Quick long positionJust entered didnt had time to post before just saw, the other short it's on the run as soon as it reaches the target


LRC Triangle Breakout LRC cryptocurrency token is breaking the trend line resistance and moving higher buy when price close above the trend line

Possible Pennant formingIf we break the top it could go up, otherwise if we break bottom it could go down

LRCUSDT (Waiting for the symmetric triangle breakout)LRCUSDT (4H CHART) Technical Analysis Update
Waiting for the Symmetric Triangle Breakout
LRC/USDT currently trading at $0.455
Buy-level: Above 0.48 (only buy after 4 h candle closes above 0.480
Stop loss: below $0.38
Resisace Level 1(Target 1) : $0.620
Resistance level 2(Target 2) : $0.850
Max Leverage: 2X
ALWAYS KEEP STOP LOSS...
Follow our Tradingview Account for more Technical Analysis Update, | Like, Share and comment your thoughts.

LRC on the trendlineBINANCE:LRCUSDT LRC came on the trendline of the symmetrical triangle. If BTC stops here, LRC has a chance to move up towards the fibonacci 38% level and even break the triangle upward.
Stop loss can be set under the 50% level of fibonacci and the triangle.

LRCUSDT (LOOPRING) - UPTREND CONTINUATIONANALYSIS 🔎
- LRCUSDT brokeout above the symmetrical triangle(1) inclined resistance.
- LRCUSDT hit a new ATH and retraced.
- Price retested the flip horizontal support and 0.618 fibonacci retracement level.
- A bullish pin bar (hammer) was formed at the retest area.
- Price action is printing a symmetrical triangle(2) pattern.
- Breakout above symmetrical triangle(2) inclined resistance could be an uptrend continuation signal.
BUY ENTRY ⬆️
- Breakout above the symmetrical triangle(2) inclined resistance.
TARGETS 🎯
- Horizontal resistance level (R1).
- Horizontal resistance level (R2).
- Fibonacci extension level 1.0.
SETUP INVALIDATION ❌
- Breakdown below the symmetrical triangle(2) inclined support.

LRC/USDTLoopring again solid project
short term target 1 &2 here
i expect the £1 in next couple of weeks..
