Loopring token (LRC) forming bullish Cypher for upto 46% pumpHi dear friends, hope you are well and welcome to the new trade setup of Loopring token ( LRC ) with US Dollar pair.
On a daily time frame, LRC is about to complete the final leg of a bullish Cypher move.
Note: Above idea is for educational purpose only. It is advised to diversify and strictly follow the stop loss, and don't get stuck with trade
Lrcusdtlong

#LRC/USDT PARALLEL BREAKOUT AND RETEST READY TO PUMP 1200%Welcome to this quick LRC/USDT analysis.
I have tried to bring the best possible outcome to this chart.
Show some support, hit the like button, and comment in the comment section. this motivates me to bring this kind of chart analysis on regular basis.
SPOT CALL
Hold it for a long time to come, it can give good profit, as BTC will pump, all the calls will give you good profit and most important stop loss
Entry:- CMP $0.2400
Stoploss:- $0.2400
Target:- $0.4000, $0.5000, $0.6750, $0.9780, $1.31, $1.66, $2,$2.67, $3.77
Remember:-This is not a piece of financial advice. All investment made by me is at my own risk and I am held responsible for my own profit and losses. So, do your own research before investing in this trade.
Happy trading.
Sorry for my English it is not my native language.
Hit the like button if you like it and share your charts in the comments section.
Thank you...

LRC/USDT - LONG ----- Welcome, dear followers! -----
- Here is my trading methodology. I trade with a normal system and analysis of resistance and support, as well as price reversal patterns.
- For the record, I do not place a stop loss within my trades. So that I only risk 1.5% of my total capital in order to support the loss due to a price reversal against me.
- If a price reversed against my expectation and touched the drawn line r3, then I transferred targets to the entry point and waited for the price to close at it with a loss equal to almost zero.
- Today's deal is shown in the chart, and here are the entry and exit points below.
-- Support me with numbers and follow up on my account for other deals in the future. Thank you for coming to this part. --
-------------------------------------------------------
⚡️⚡️ LRC/USDT ⚡️⚡️
Exchange: Binance Futures
Trade Type: Regular (Long)
Leverage: Cross (1.0X)
Entry Orders:
1) 0.2713 - 24.829% ✅
2) 0.2628 - 24.986%
3) 0.2540 - 25.078%
4) 0.2452 - 25.106%
Take-Profit Orders:
1) 0.2836 - 50.0%
2) 0.3126 - 25.0%
3) 0.3416 - 15.0%
4) 0.3714 - 10.0%
Trailing Configuration:
Entry: Percentage (0.5%)
Stop: Breakeven -
Trigger: Target (1)

LRCUSDT Ready For Takeoff!LRCUSDT technical analysis update
Buy zone : $0.305 - $0.308
Stop loss : $0.295
TP 1 : $0.322
TP 2 : $0.337
TP 3 : $0.360
Always keep stop loss
Thanks
Hexa

$LRC moonLRC on its way to new ath.
i think this coin will touch the yearly resistance for the 3rd time very soon

Loopring longLoopring broke trough off the upper boundary of descending channel. Asset bounced off the support level. Bullish movement to resistance level at 0.463 is expected to happen.

LRC/BTC Great Buy - Strong Strength SnapshotFollowers may request a strength snapshot of any cryptocurrency, so like and follow.
1) Strength Profile: Green and very strong.
2) Bull Bear Squeeze: Bulls are well in charge.
3) Money Flow: Is positive and increasing.
For now, LRC/BTC is a great buy - Strong Strength Snapshot: Strength Profile 🟢 Bulls in Charge 🟢 Money Flow 🟢 I'm long from 1909 sats.

LRCUSDT Analysis (Local Vision)Hello friends.
Please support my work by clicking the LIKE button👍(If you liked). Also i will appreciate for ur activity. Thank you!
Everything on the chart.
Entry: market and lower
Target: 0.7 and 0.8
after first target reached move ur stop to breakeven
Stop: ~0.44 (depending of ur risk). ALWAYS follow ur RM .
Risk/Reward: 1 to 3
risk is justified
Good luck everyone!
Follow me on TRADINGView, if you don't want to miss my next analysis or signals.
It's not financial advice.
Dont Forget, always make your own research before to trade my ideas!
Open to any questions and suggestions.

LRC/USDT BUYING SETUP LRC Reject on key support , we can setup entry , potential continue upward movement
BTC rejection to on key support will follow BTC movement
Buy zone : 0.555 - 0.52 - 0.5
Target : 0.5750 - 0.61666 - 0.6653 - 0.7530
Stop : 0.49

LRCUSD Interesting Fibonacci Top PatternLoopring proceeds to rise to 1.618, then retreats, rises to 2.618, retreats, rises to 3.618.
Will this pattern continue for the next outer ring 4.618

LRC RANGES TO ACHIEVE BOTTOMEntering at yellow lines ,Stopping at red line , Taking targets at green lines . Simple and crisp !

LRC trying to find SupportAs you can see a strong treadline has formed on the daily for Loopring dating back to March 15th. This treadline is respected at the time. But, if daddy bitty decides to dump more this treadline will probably be invalidated. The line in the sand for LRC is $1.00 - $1.04. It can even wick down to $0.96 as long as it doesn't close at that level. Closing under $1.00 mark would confirm the treadline is broken and further down is imminent. Theres a lot of good news surrounding LRC and Gamestop right now. Gamestop has announced their NFT Marketplace Beta. I would expect the use of Loopring to increase once The NFT marketplace is officially active in the coming months. LRC is a potential strong buy at these levels. It may go back down to $0.78. But, just like all other cryptocurrencies that may have been bottom and the continuation of the bull market may have already started. From $0.65 to $1.35, LRC has already had 100% gains in the past 3 weeks. A pullback is expected at these levels. May consolidate and test the $1.35 in the coming days or weeks. Hoping for the continuation of the bull market. Gamestop NFT marketplace official release. I can see LRC testing the previous ATHs at $3.90 even breaking the ATH.
First, before we talk about Bull market and new ATH levels. we must get through these FIB retracement levels. It seems LRC hit the .786 ($1.34) level perfectly and tested those levels 2 times getting rejected. We can probably expect for LRC to touch the $0.96 - $1.04 level in the next coming days. If it respect this support tradeline. It may go for its 3rd attempt of breaking the .786 ($1.34). 3rd times a charm, if we break above $1.34 and close above $1.35. We can expect the next level target is $1.89.
Buckle up!, We're either going down hard to $0.70 again or back up to $1.89 again. We must draw a line in the sand at $1.00 for the continuation up.

LRCUSD Bulls in ChargeThe 50MA seems to be imperative in prices evolution on this weekly chart, price has recently touched it and been bullishly rejected
The orange trendline is dominant and seems to be hodling strong
All MA's are spread this is the best state for likely continuation

LoopRing cup and handle resistance tests (+)LoopRing (LRC) is simply doing what LoopRing does.
LRC is a token that always seems to move in cup-and-handle chart formations.
🔹 We get a huge upswing,
🔹 We crash down,
🔶 We rebuild in violent strikes toward the the resistance point.
🔶 Two times... Three times... no dice.
🔶 By the 4th and 5th strike...
💠 We've now formed a LoopRing cup and handle, and are poised for new price discovery.
♠️🤫🐿

LRC Elliot 3rd wave imminent As the title states, LRC has had two jumps with one to go. Great little bull-run on EDT wake-up.
The "West... is the best- baby", as Jim Morrison so ominously put it. However it ain't so good for a trader 🙄.
Red vs. Green day. Let's go.

LRC/USDT LOWER TF TRADE SETUP Hi guys, This is CryptoMojo, One of the most active trading view authors and fastest-growing communities.
Do consider following me for the latest updates and Long /Short calls on almost every exchange.
I post short mid and long-term trade setups too.
Let’s get to the chart!
I have tried my best to bring the best possible outcome in this chart, Do not consider it as financial advice.
LONG #LRC/USDT
ENTRY: CMP and add more up to $1.05
SELL- 50%
STOP LOSS: $1.01
Leverage - 5x
This chart is likely to help you in making better trade decisions, if it did do consider upvoting this chart.
Would also love to know your charts and views in the comment section.
Thank you

LRC/USDT BUYING SETUP LONGLRC Retest resistance become support after breakout Descending Triangle pattern
MACD Showing Bullish crossover on Daily
Potential continue upward movement 🚀
Target mentioned in the chart
Stoploss : $0.78
Risk : 5%

LRCUSDT H4 LONGPrevious LRCUSDT analysis continuation expectation 1.55 (LRCUSDT H4 harmonik oluşumu beklentisi, önce 1.55'e ulaşmasını, 1.55'ten sonra 1.10'a düşeceğini tahmin ediyorum. İyi şanslar dilerim. Burada yer alan yatırım bilgi, yorum ve tavsiyeleri yatırım danışmanlığı kapsamında değildir. Yatırım danışmanlığı hizmeti, kişilerin risk ve getiri tercihleri dikkate alınarak bireysel olarak verilmektedir. Burada yer alan içerik, yorum ve tavsiyeler genel nitelikte olup hiçbir şekilde yönlendirici değildir. Bu öneriler finansal durumunuz ile risk ve getiri tercihlerinize uygun olmayabilir. Bu nedenle sadece burada yer alan bilgilere dayanarak yatırım kararı vermeniz beklentilerinize uygun sonuçlar vermeyebilir.)

LRCUSDT H4 LRCUSDT H4 harmonic formation expectation, I predict it to reach 1.55 first, I predict it will fall to 1.10 after 1.55 level. I wish you good luck. The investment information, comments and recommendations contained herein are not within the scope of investment consultancy. Investment consultancy service is provided individually, taking into account the risk and return preferences of the individuals. The content, comments and recommendations contained herein are of a general nature, which are not in any way directive. These recommendations may not be suitable for your financial situation and risk and return preferences. Therefore, making an investment decision based solely on the information contained herein may not produce results in line with your expectations.

LRC/BTC 1DAY UPDATE Welcome to this quick LRC/BTC analysis.
I have tried my best to bring the best possible outcome in this chart.
Reason of trade:-LRC/BTC bullish flag ready to buy the green zone spot buy and hold
Entry:- 0.00002270,0.00002630
Traget:-100% TO 250%
Stop loss:- 200MA down side cloge
Remember:-This is not a piece of financial advice. All investment made by me is under my own risk and I am held responsible for my own profit and losses. So, do your own research before investing in this trade.
Sorry for my English it is not my native language.
Do hit the like button if you like it and share your charts in the comments section.
Thank you.

lrc-low targsthis is a chart. it has some major VWAP spots marked on the map by free-hand. It has some fib retracements and fib extensions. it is nice and simple stuff, just the volume weighted zones here thanks.
Good a couple months of hell for the start of this new year
please comment, like and subscribe for more content out soon

LRC -LAYERING ECO -- Only buy in recommended zone -- Signal ID# 207
COIN: LRC/USDT
Exchange: KUCOIN, BINANCE
Direction: Spot AND LONG
------------------
Position: 2%
Risk: med
Entries :
E1: 1.81
E2: 1.68
-------------------
Targets:
TP1: 2.25
TP2: 2.7
TP3: 3.3
TP4: 9, 18 , 50
-------------------
Stop loss: 1.57

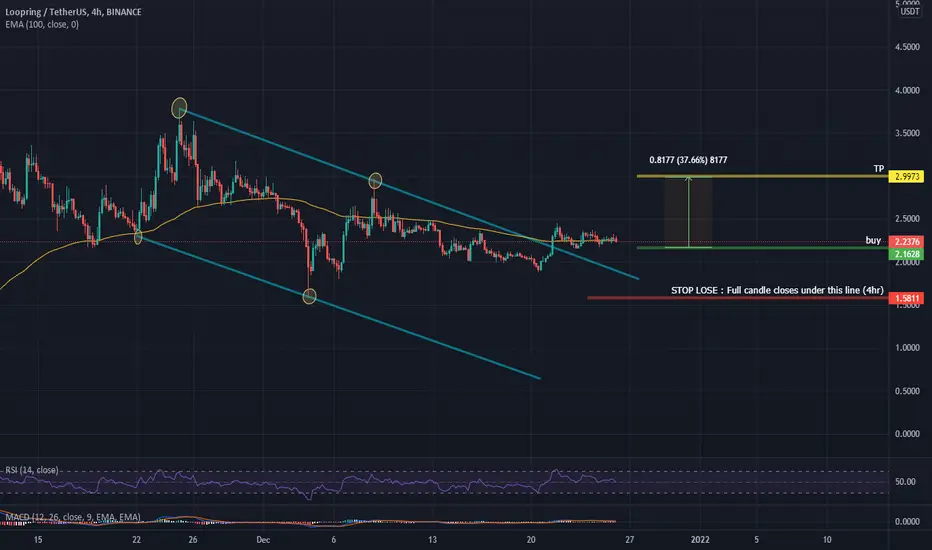
LRCLRC (USDT)
buy at the green line
take your profit at TP
stop lose : full candle closes under the red line
By : notzezo3
Good luck ...............