Lskusd

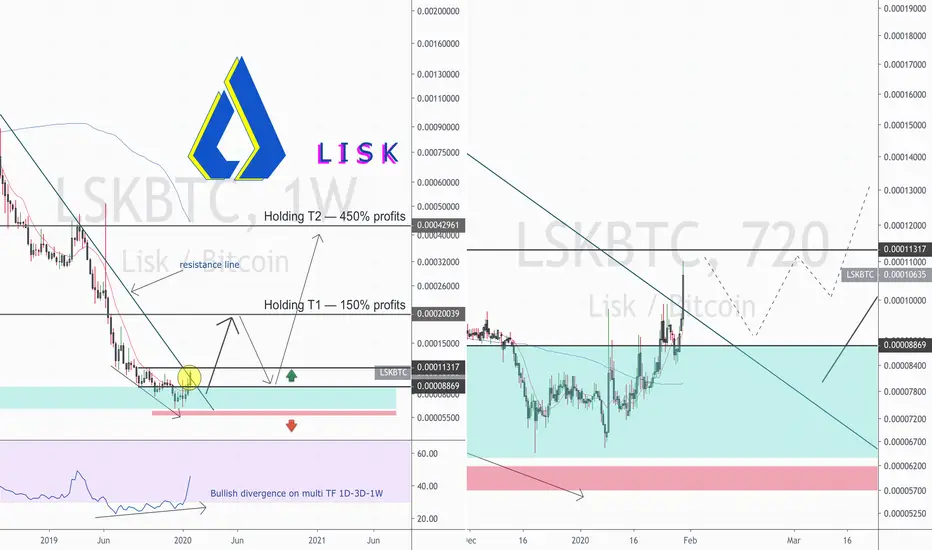
LSK/BTC (Minor Rally Up? - up to 30% profit target)LSK/BTC
-Bearish flat line of support
-We could still expect another minor rally
-Upside target is the downward trendline resistance
-Key stoploss is below 100MA

Lisk Has Entered Low Interest Zone | Be Ready For Bullish MoveOn 7th Feb 2020 I posted an article where we have seen that the priceline of Lisk was moving towards $1.67 resistance level. And I predicted that if the price line will be able to breakout this resistance then it we can easily target the point of control of the volume profile of the complete price action of the Lisk. And we have seen that after breaking out the 1.67 dollars resistance level the price action even moved beyond the POC of volume profil. That was more than 65% bullish move but from 11th Feb 2020 up to 13th March 2020 the priceline turned very strong bearish and dropped down. As I have placed the volume profile on the complete price action of Lisk and as result at that time we had the trader’s interest very low below $0.98. Therefore when the price action moved down than that level then it moved up again. And at this time it is moving sideways.
Strong support of 100 SMA:
If we switch to the 2 day chart then we will see another very strong support that has stopped the price action to drop down more. And this support is 100 simple moving average. Even though we can see on the candlesticks of 11th, 13th , 15th , and 17th March 2020 the price action has been moving down below this simple moving average but no candlestick has been completely opened and closed below this support therefore so far the Lisk is failed to breakdown the strong support of 100 simple moving average on 2 day chart.
Down channel:
Now if we switch back to the daily chart then it can be clearly observed that the price of Lisk has formed a down channel. We have recent two more touches at the resistance of the channel one is on 20th March and other one is on 23rd March 2020. After that the priceline is likely to move down but this time it can be expected that the priceline will not hit up to the support of this down channel. because the bollinger bands is expanded up to $0.72. Once the price action will touch at this bollinger band support then it will stop the priceline to reach up to the support of the channel.
Formation of bullish BAT can lead the priceline down for short term:
Lisk is taking another move that is showing the tendency of moving down on short term time period. That move is the formation of bullish BAT pattern on daily chart. We can examine first leg was started on 13th March and it has been completed on 20th March. After that the price action is retraced between 0.382 to 0.50 Fibonacci level. That is the first confirmation of BAT pattern. Then B to C leg is projected upto 0.886 Fibonacci projection level and this is the projection of A to B leg. Now if the final I will be completed then we can expect the retracement between 0.786 to 0.886 Fib level that can be from $0.70 up to $0.62. But I am not expecting that any candlestick during this bearish move will be closed below the 100 simple moving average support on 2 day chart that we have discussed earlier. We can have only a spike up to this level of potential reversal zone of this bullish BAT. And from this potential reversal zone the price action can again take another powerful bullish divergence.
The volume profile is showing more positive results:
Now if we see the volume profile of a complete range of List price action then we receive more positive results. In my previous post the traders interest was very low below $0.98 but now we can see that the traders not interested to trade below $1.15. And previously we had the point of control of the volume profile at $2.09 and this time the point of control of the volume profile is moved little bit more up to $2.15. And at this time the price action is moving in the area where the interest of traders is very low therefore the price action can again take another powerful bullish divergence to hit at least up to point of control of the volume profile and that is $2.15 very soon.
Conclusion:
After hitting the channel’s resistance the priceline can move down little bit more on short term to complete the BAT pattern. But eventually it will be turned again bullish and break out the resistance of the channel and we can expect the bullish rally at least up to $2.15. So this time it can produce upto 246% profit.
Note: This idea is education purpose only and not intended to be investment advise, please seek a duly licensed professional and do you own research before any investment.

Lisk Is Has Taken 424% Bullish Move | Should We Buy Here?Since Dec 2018 the Lisk started forming the bullish Butterfly pattern on 2 week chart and after final leg was retraced between 1.27 to 1.618 Fibonacci and this was the final potential reversal zone of this pattern from where the priceline was supposed to take bullish divergence at any time and at last in Jan 2020 the price action gave a new year surprise to its holders and traders and took a very powerful bullish divergence and gave more than 424% gains from lowest $0.29 to recent highest $1.52 and now the price action is in 0382 to 0.786 Fibonacci projection of A to D leg of this bullish Butterfly pattern.
The Oscillators And Idicators:
On long term month chart If we see the oscillators and indicators then it can be clearly seen the moving average convergence divergence (MACD) is turned strong bullish as the histogram is appeared in green indicating that the momentum has been completely shifted in favor of bulls and moving averages of MACD has also given bull cross in the meanwhile the stochastic has given bull cross from oversold zone and relative strength index (RSI) is still in oversold zone its mean that RSI has still very vast capacity to move up.
An Alligator Mouth A Very Strong Bullish Signal:
If we see the move of simple moving averages with time period of 25, 50, 100 and 200 then 25 SMA has crossed up all moving averages and after that the 50 SMA has crossed up the 100 SMA and soon it will cross up the 200 SMA and this golden cross can produce a very strong wave and once we have the order of moving averages from down to top as below:
200 SMA then 100 SMA then 50 SMA and then 25 SMA above all
Then a complete alligator’s mouth will be opened then the most powerful rally can be started.
When the alligator’s mouth was opened in May 2019 it leaded the price upto $4.6.
How Can We Enter In This Bullish Move?
At this time the price action is very closed to the price level $1.67 where it could not resist in Jul 2019 and dropped more than 73%.
But if we see the visible range of complete price action of Lisk then we are far below than the POC of volume profile and traders interest can be seen upto $2.35 very strong and every candle stick is being closed above exponential moving averages 10 and 20.
In my opinion if anyone wants to enter in this bullish trend or interested in buying Lisk here then he/she should wait until the price action completely hits the $1.67 resistance and breakout this resistance coz sofar a correction move is due since it has taken bullish divergence.
Now the price action may have a pull back from this resistance and hit the EMA10 or EMA20 and take a bounce to breakout this resistance or can break this resistance without any correction.
The secure buying would be needed an aggressive thinking and that would be: we should wait for breakout from this resistance and wait for some correction most of the times when the price action breaks the resistance then it retests the previous resistance as support so after breaking out the resistance we can place buying at $1.67 and also use this support as our stop loss and in this case if the price action doesn’t break down the $1.67 support then we can easily target the POC of volume profile at $2.35.
However I will keep posting more updates on Lisk when receive any developments.
Regsrds,
Atif Akbar (moon333)

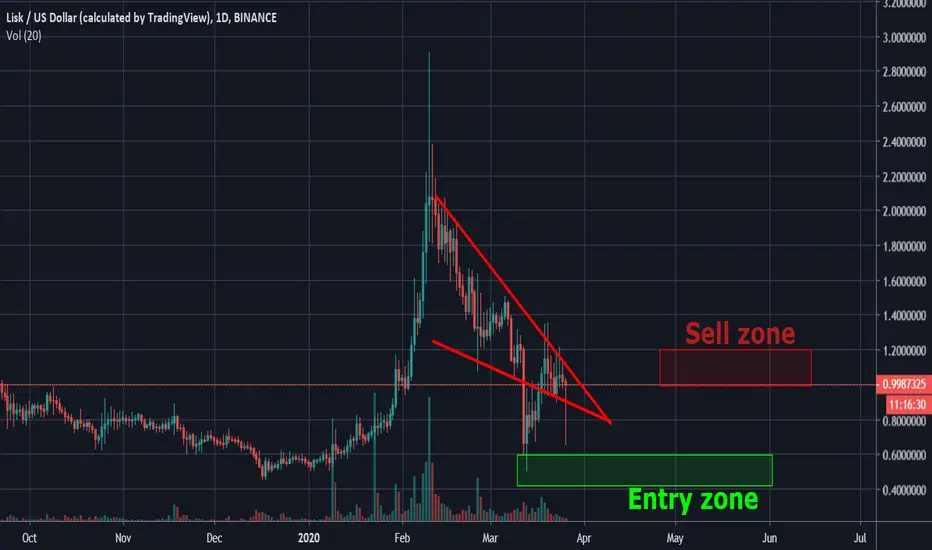
Lisk bottom testing
LSK shows a lot of demand around our minimum of December 2019. Personally, I'm waiting for the $ 0.5 level to be tested. This can be a good time to buy.
Golden pocket safe lsk?
Possible reflection from the fibo 786 level to the lower limit of our resistance from the $ 1.2 green box. Watch out for Bitcoin moves.

Boredom on Lisk...
I'm tired of this poison on Lisk. The upcoming falling vedge and decreasing volume which is very painful is very disturbing. Personally, I am after LSK

LISK in the growth channel
LSK moves in the upward channel. The best time to buy in the current situation is $ 1.37 for LSK. Lisk has been moving in this channel for some time and respects him.
Everything looks great.
Previous TA:

LSKUSD - bullish ascending triangle (shortterm trade)Hey guys, I'm taking a shortterm LSKUSDT trade.
Looks like an ascending triangle on the 4 hour chart.
25% Upside Target...
Happy Trading


LSK good sign. Trend broken.LSK broke the downward trend lines. This was not a strong breakout but it was the first good sign for further increases. You must now wait for the D1 candle to close. If we close the trend line above it is a good sign. Secondly, another important place would be to close the D1 candle above the level of the green box.

LSK good opportunity to short to 1$.Lisk is still unable to break the downward trend line. The situation is good enough to know that we can prepare for an attack around $ 1,1 for LSK. In the near future I expect a strong downward moment to rebound from the lower levels of fibo 786 and an upward move to $ 1.4. It is worth observing.
*I changed the development of analysis on the binance market because there is a larger volume there.
Previous TA:

Time is running out and BTC makes it difficult for us to make d.Take into account that ALTS grow best when BTC saves a given level for a long time and does not fluctuate significantly. In this situation, take into account possible strong increases on BTC or a decrease, you have to consider three scenarios for LSK. I personally think that the orange scenario has the best chance of occurring and is getting ready for it. It should also be remembered that in the face of big drops on BTC, even LSK will finally make a strong drop below the level of $ 1.2 and leave the zone of possible rebound up.

Congratulations LSK. And we're back to the inheritance
LSK rebounded from the price of $ 1.2 and soared up to test the downward trend lines. As you can see the volume was nice but the trend line turned out to be too strong. Personally, I advise against entering positions now. It's better to wait for $ 1.2 again.
Previous TA:

LISK plays the way he wants.The LSK course bounced back from where I expected it. Personally, I have already obtained 7% of earnings, because I think that LSK will fly even lower to around $ 1.2 and it is possible that then it will break the mountain from the downward channel to around $ 2.2
Previous analises:

Good opportunity for 100% on Lisk?
The Lisk course exploded from the bottom of 2016 to the last peaks of 2019. The resistance at 2.2 turned out to be strong enough to act as a supply zone, which is understandable due to the long consolidation at that place in 2019. What is the plan:
The price after such big increases will probably fall to 618 fibbo (green box). After posting this level, I expect a rebound around the last maxs on LSK. If the demand side turns out to be strong enough, we can break the level of ~ $ 2.2 and go further. However, at this moment it is best to wait and see what will happen. Bounce back (red box) is very likely and possible 100% profit.

Lisk - The Lisk SDK.Lisk - one of the many most oversold cryptocurrencies during last bear market. Now with huge progress on the technical side. Developers are already utilising Lisk newest product - lisk-sdk. 2 decentralised exchanges are being built with 2 different solutions. Independent interoperability solution is being researched by Lisk Foundation. Lisk-SDK allows to build decentralised apps within few lines of code which are highly efficient. Lisk order book is very shallow yet, this coin can really fly to the moon.

LSK/BTC 250% profit within few Days#LSKBTC 250% profit:
#LSK hit our all Targets.
still if you holding then you can book your profit.
please like and follow me for latest crypto updates

LSKBTC - 9 3 19 TD SEQUENTIALI am long LSKBTC, a 9 13 9 in the monthly chart, could not have asked for more than this.
Lisk is a great project, just check out there github and you will find out, that they are developing like fools!
I think it is an under the radar project, not getting the media attention that it should, but that's just my opinion.

LSKBTC 45% profit within 2 Days#LSKBTC 45% Profit Update:
#LSK after Retest went upto 1225 Sat.
total 45% Profit within 2 Days.
Enjoy guys
and
you can book profit Partially.
This is power of Technical Analysis.
Please like and follow me for latest crypto updates and Chart.

Lisk on the Move. Be careful near resistance.Price seems like breaking out from downtrend resistance. But it looks for me like it will retrace in short-term within range of 11300 and 9000. Other inputs on the chart.
Previous chart:

LSKBTC Bullish Breakout Upward#LSKBTC Chart Update:
#LSK now Bullish after Channel Breakout upward.
Entry: bellow 940 Sat.
Targets: 1133/1441/1764 Sat.
Stop Loss: 840 Sat.
#DYOR
Like and follow for Crypto news and each and every updates.
