LTC-BTC


LTCBTC set to blast offBreak the black resistance line and it will blast straight up to the falling wedge target. If not it will wiggle inside a triangle than blast off, or drop out depending on market conditions.

LTCBTC, forming a head and shouldersif it plays out, target is 0.00582, however we must see if it can punch through support at 0.006221.

Anybody else waiting for this to happen?If you are bullish on Bitcoin, Litecoin must be a no brainer if it were to reach 0.0050 - 0.0052 range.
Very strong support of the 1:1 extension of the entire structure, the bottom of the parallel channel
and the negative 1.236 Fib level.
I get suspicious when it is this obvious.... but let's find out if it gets there.

LTCBTC testing major resistanceAnd at present is rejected but may try again and break up.
A break up is very bullish, and a break out of the 5 month descending channel will confirm Alt season.


Potential Upward Channel Forming?After being in a descending channel/wedge for the past 6 months, it looks like an upward channel may be forming.
If the bottom trend line holds another time, this could be stronger indication of an upward channel. Not to mention the LTC halvening happened 5 months ago and the BTC halvening is in 4ish months. Combine this knowledge with the recent 6 month downtrend 5 months before BTC block reward gets cut in half? Just food for thought.
The channel could change slightly, but this is my lizard brain guess at it.
This will definitely be another interesting year of crypto.

Litecoin (LTCUSDT) long.All description on the chart.
Please, don't forget to like and follow.
Thank you.

Litecoin (LTCBTC) short.All description on the chart.
Please, don't forget to like and follow.
Thank you.


Litecoin (LTCUSDT) short.All description on the chart.
Please, don't forget to like and follow.
Thank you.

LTC/BTC Long trade ideaRSI has been diverging. Triple bottom / Falling wedge pattern looks ready for reversal.
With BTC looking like it could range and BTC dominance looking ready to test its trendline and potentially fall... Alts look ready to rumble.
Not going to gamble on this one tho. Locking in the majority of my profits within the current wedge pattern.
Entry now would still provide good RR in this trade. I will be laddering down to the zone listed on this trade.


LTCBTC keeps testing longterm trendlineSecond times in days. Will it break up. Previously it was violently rejected.
Currently blue path is preferable, a bearish divergence and a retest of the trendline after break up. however price action in a rising wedge which is bearish. A breakdown of the rising wedge will complete a head and shoulders and take the price to 0.05959.
Keep in mind that in cryptos especially the btc pairs, price action have a mind of their own. We can complete the head and shoulders then produce a 5% failure going straight back up.
LTC. 12% drop incoming?Made Lower Low and Lower High.
Now trading in chop-chop zone.
Global Support is lower and LTC has room for 12% drop after retracement.
Once it will hit it - it should bounce at least to resistance which marked at chart.

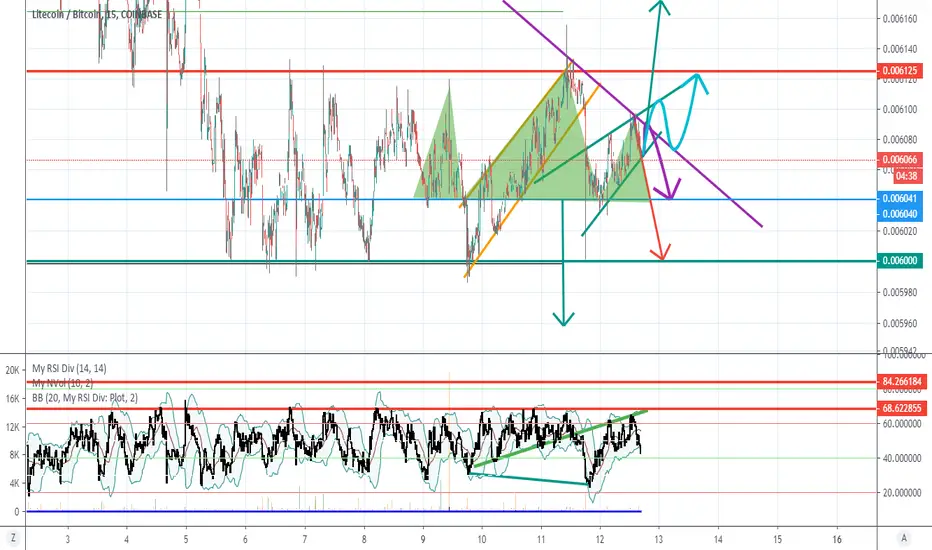
LTCBTC testing strong resistancesA break above is very bullish. Rejection will bring price to the previous lows. The diagonal resistance in purple is very significant because it is long term and price action has failed to break above it for months.
The price action is currently in a rising wedge which has tendency to break down. RSI above 60 but there is still space to go up to 80 the all time RSI highs. There is a bullish divergence on the RSI.

Litecoin (LTCUSDT) long.All description on the chart.
Please, don't forget to like and follow.
Thank you.

$ltc its been a whileLast mid/long term chart didnt pan out for me, i figured wed go higher than 020 or whatever it was 6 months back due to halfing. All good though. Refueling under .007 recently.
Is this the bottom for the next 6 months or just a delay consolidation until dec 4th (thx dj thislte), its a good question.
alts generally dont spend alot of time in consolidating sideways compared to straight up and straight rekt.
I think ltc will do the following in the coming weeks/months.
not break .0125 for a long while. or straight to .022 break. or none of the above. these HTF forecasts are just forecasts, not short term and so not trades.
Good luck friends.

LTCBTC, what ifLTCBTC recent price action looks fairly symmetrical, the rising part is mirrored by the falling part in angles and structures. What if the pattern continues and the large dump is mirrored by a spectacular pump?
There is a fairly sizable bullish divergence on the RSI that has been going on for quite a while.


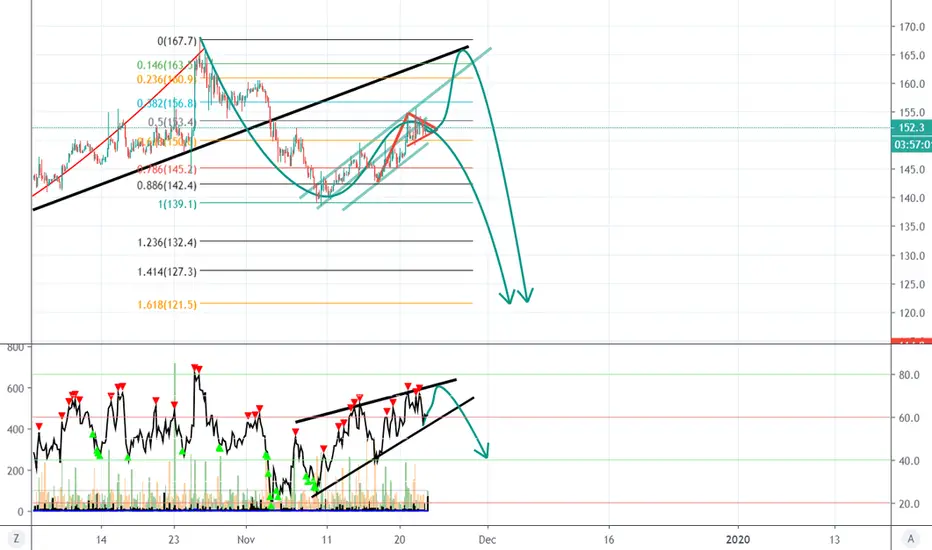
BTC to LTC ratio broke up from bull pennant, will LTC die?heading to 166 is equivalent to 6024 mBTC in terms of LTCBTC pair. This means there will be a big dump for LTCUSD, larger than that of BTC by more than 9%. This is because the volatility for LTC is higher than that of BTC.
The good news is that after the ratio tests the midterm rising channel, it might go down again if it is rejected meaning ltcusd will go up.
And if the ratio is not rejected and go back into the midterm rising, then it is doom for LTCUSD, seeing 22 and lower will be possible.

BTC to LTC ratio in a bull pennantMight break up, might break down. Classic TA calls for a break up with a measured move that will retest the mid term channel (black trend line) that price action fell out of. Elliot wave theory shows a 3 wave ABC correction with 1:1 scale that has completed.
The RSI is in a rising wedge so the drop is confirmed, but the RSI does not give any clue if there is a direct break up or breakdown of the price action. If anybody has an indicator or a method that can give a clue about the breakout of such a setup, please share in the comment section.
The BTC to LTC ratio is the inverse of the LTCBTC pair. So this analysis is useful if you trade LTCBTC, just in reverse.