LTC/USDT 4H Chart ReviewI invite you to review the LTC to USDT chart also on a four-hour interval. At the beginning, we can use the blue lines to mark the downward trend channel in which we move along the lower border.
Let us now move on to determining supports for the LTC price in case the current correction deepens and here we can notice that we are at the support level of $59.12, but if we break out of it below, the next support will be at $55.99.
Looking the other way, similarly using the fib Retracement tool, we can determine the resistance areas that the price must face. And here we see that the first resistance zone is from $61 to $63, then we have the second zone from $64 to $66, then resistance at $68.18, and then strong resistance at $70.69.
The CHOP index indicates that the energy has been used up and is slowly growing, on the RSI we exceed the lower limit, which may end the current correction or slow it down, while looking at the STOCH indicator we see that the energy is running out, which can also give us a moment of rest before further movement.
LTC

LTCUSD: Ascending Broadening Wedge with a Confirmed Partial RiseWe have confirmed the partial rise of the Ascending Broadening Wedge and have failed to break above the major support/resistance level. I now expect the price of LTC to go even lower than 40 and perhaps to around $25-$19 as that would be the HOP level of the Bullish Bat it is currently BAMMing from, but it is possible we get a reaction at around $35 as that would be the 88.6% Retrace, but the most confluence is at the $25-$19 area.

LTC: Support BreakoutLitecoin (LTC) technical analysis:
Trade setup : Following a bearish breakout from a Channel Down pattern, price has now also broken below $65 support zone, resuming its downtrend. That support area held up recently in August but also in March and Dec 2022, thus its significant sign of weakness to see that level broken. Price could revisit $50 support next.
Trend : Downtrend across all time horizons (Short- Medium- and Long-Term).
Momentum is Mixed as MACD Line is above MACD Signal Line (Bullish) but RSI < 45 (Bearish).
Support and Resistance : Nearest Support Zone is $65, which it broke, then $50. The nearest Resistance Zone is $75 (previous support), then $100.

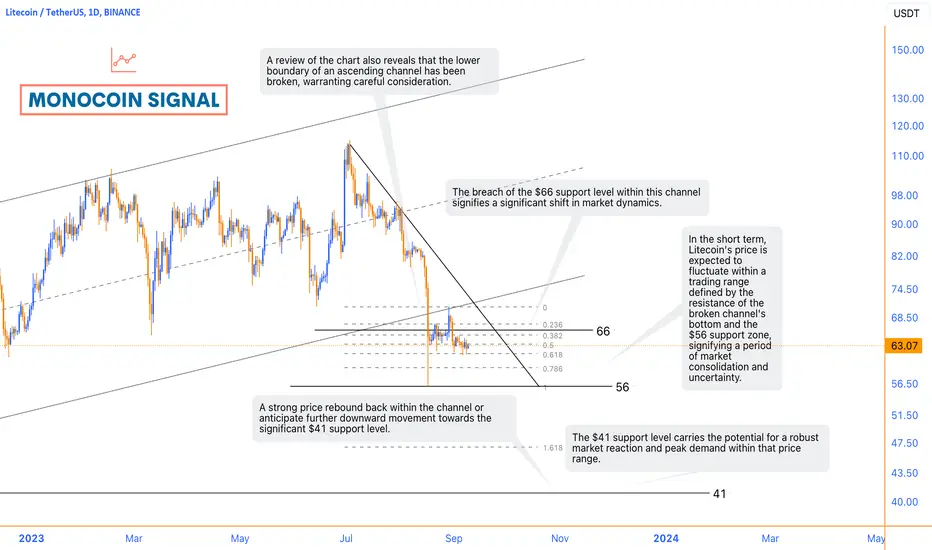
Recent Trends and Key Support LevelsOver the course of the last month, Litecoin (LTC) has persistently followed a declining trajectory within a short-term channel. This downward movement has notably coincided with a surge in selling pressure across the broader market. This alignment of factors has led to a significant breach of the channel's bottom, effectively breaking through a support level that was previously deemed sturdy at around $66.
In addition to this breach, an examination of the chart reveals that even when considering the presence of an ascending channel, the lower boundary of this channel has been breached as well. This dual breach prompts us to carefully assess the current situation.
In light of these developments, there are two primary courses of action that traders and investors should contemplate. Firstly, we may opt to patiently await a robust resurgence in Litecoin's price that brings it back within the confines of the channel. Alternatively, we could also consider the possibility of the ongoing downward trend persisting, potentially leading the price towards the support level situated around $41.
It's important to note that this $41 support level carries significant importance, as it possesses substantial potential for a strong market reaction. In such a scenario, demand for Litecoin could surge, possibly reaching its highest point in this specific price range.
In the short term, we anticipate Litecoin's price to exhibit a trading range, oscillating between the resistance formed by the previously broken channel's bottom and the support zone around $56. This range-bound movement signifies a period of uncertainty and consolidation in the market, as traders assess the evolving dynamics of Litecoin's price within the context of the broader market conditions and prevailing trends.
PROFIT: Finding TRADES on RED WEEKSHi Traders, Investors and Speculators of Charts📈📉
The markets are trading in the red and it can be hard to spot good trading opportunities during bloodbaths. On the charts, we're looking at:
CHEWY NYSE:CHWY
Spot position, anticipating trading back up towards the gap. +17% , low risk high reward trade
WALT DISNEY NYSE:DIS
Spot accumulation, potential for +153% increase. Very low risk and high reward setup
TESLA NASDAQ:TSLA
Long from trendline support, anticipated +28%, medium risk high reward setup
LITECOIN BINANCE:LTCUSDT
Short to next support zone, +12% medium risk medium reward setup
_______________________
📢Follow us here on TradingView for daily updates and trade ideas on crypto , stocks and commodities 💎Hit like & Follow 👍
We thank you for your support !
CryptoCheck

LTC A breakout is around the cornerLooking at the LTC chart, it strongly bounced back after having continuous down trend.
A major resistance is waiting around 64.5$
If LTC breaks this resistance successfully then we can expect a decent upward movementum.
I'm planning to enter a LONG position after a successful breakout with a tight stoploss.
Checkout the chart for trade details, use trailing stoploss to secure your profit and catch maximum profits.
Stoploss is must!
Follow us for more updates.
Cheers!

Is Litecoin hinting at an upward move? Long trade #4Historically, in previous years, the price of Litecoin was one of the first to start a growth trend globally and at the same time one of the first to correct.
If the previous sentence has aroused your interest, you can check out our previous ideas on the LTCUSDT ticker, where we described it in more detail and showed it on charts.
So, let's try to assume that the painful correction of the LTCUSD price is already over, which means it's time to grow. Therefore, we suggest a long trade for LTC on the following conditions:
Enter = 66.51
Stop = 63.97 (-3.9%)
TP = 80.24 (+ 20.6%)
P/L ratio = 5.4
Traditionally, we allocate $10,000 for this trade . In the event of a mistake, we will lose $390. If the trade works according to our scenario, we will receive a profit of $2060.
What do you think of this trade, and what is your vision of the Litecoin market? Write about it in the comments!

LTC Fractals : Unlocking the Power of Repetition 📊🔁ŁGreetings, fellow traders! 🚀 Let's delve into the captivating world of fractals – a concept that reveals the art of repetition in trading patterns. Today, we'll explore the phenomenon of the Double Bottom pattern on the Litecoin chart. Brace yourself for insights into the power of fractals in forecasting market movements.
🔍 Understanding Fractals: Picture fractals as the echoes of patterns across different time frames. Just as nature exhibits patterns that repeat at various scales, trading charts also showcase fractals – smaller patterns that resemble larger ones.
📉 The Double Bottom Tale: A Double Bottom is a classic bullish reversal pattern. It consists of two distinct troughs at nearly the same price level, forming a "W" shape on the chart. This signifies a potential trend reversal from bearish to bullish.
🔄 Fractal Repetition: Here's where fractals come into play. A Double Bottom pattern on a smaller time frame can mirror a larger Double Bottom pattern on a higher time frame. The repetition of this pattern underscores the market's inclination to follow similar dynamics.
🚀 The Power of Recognition: Identifying a Double Bottom pattern on the Litecoin chart can offer insights into potential price movements. A successful breakout above the pattern's neckline could signal a bullish momentum.
💡 Insights for Traders: The concept of fractals teaches us to look beyond the surface and recognize patterns that repeat across time frames. Understanding these echoes can equip traders with enhanced analytical skills.

Litecoin rejected from $70- where to next?After the LTC halving the coin has been in a strong downtrend. The previous bounce on 29 August saw the FVG partially filled. Fib extension levels showed the $60.31 and $43.4 levels are the next downward targets that Litecoin could reach in the coming months
Entry: $70.7 (mid-June low)
Take-profit: $56 (17 August low but LTC could drop much lower)
Stop-loss: $75.84
R:R- 2.79

LITECOIN LTC long idea DAILY !This is a swing trade and be patience or else dont take the trade.
BUY IN PARTS between the two order blocks
TAKE PROFIT at the green levels..
NO STOPLOSS as it is a spot trade or consider it below 64.
NFA DYOR

BTCBINANCE:BTCUSDT
BTC still hanging around this 4H OrderBlock
I would like to see a clear break down from the OB, or another shot at a break to the upside, for me to consider a position here.
You have to think we have a few more measured bullish moves before the rug gets pulled at some point...

#LTC when to Short?LTC dumped pretty much after Halving.
Currently its in the range.
We may expect some bounce from current price level. But will it reach the resistance levels (red lines) that I mentioned on the chart - big question.
Anyways here are possible scenarios:
1. LTC bounces until 73$ where it faces W FVG where we may expect bear reaction. In this case possibility to 46$ support level increases
2. LTC breaks through 73$ resistance and comes to another resistance at 82 - 86$ and eather we see bears reaction is can be bearish divergence on LTF or bearish candles. And in this case coin may go lower back to 73$ which will stand as support.
3. LTC breaks below 73$ support and it may lead the coin back to 50 - 60$
4. LTC breaks above 86$ resistance, would be nice to see retest of that level and in this case the coin may go higher.

LTC/USDT Technical Analysis 1HThe LTC/USDT pair, based on the provided indicators, appears to be in a moment of indecision with a slight bearish slope. However, the price above the 50-period SMA and the RSI indicate that there is still no clear long-term direction.
The price is currently at 65.45 USDT with a trading volume of 47.56 LTC. At first glance, this volume appears to be relatively low, which could indicate a period of consolidation or a lack of clear decision by traders.
RSI(14): The RSI is at 49.15, almost in the middle of the 0 to 100 range. This indicates that the market is clearly not in an overbought or oversold zone and shows neutrality at the moment. periods indicates a medium-term upward trend.
Supports and resistances follow
Main support levels : 65.28 / 64.21
Main Resistance Levels: 65.62 / 65.81

TRADE ALERT - LONG LITECOIN (LTC)Another entry here for me in Litecoin. It actually missed my trigger buy at $77.50. But I didn't want to wait anymore. Bought at 77.12. SL is 71.69 for now. Will take profits along the way with an overall target of $106.
A little more on why I took this trade. Of course, fundamentally, you all probably know that halving occurred. The market sold the news and now from a technical standpoint, little Litecoin looks to be oversold. You can see on the RSI chart below that every time we hit that ascending red TL, we popped for a gain of at least 50%. Every. Time. Thus, probability here remains largely in our favor just from this one indicator.
Now follow that black vertical line up the chart. You will notice that it intersects with our candle today which lies directly on strong support (red TL) from December of last year.
Could we break below these major trendlines I have drawn on all my charts and get stopped out? Well yeah. Of course! But I like my chances here.
This is not financial advice. Just showing you all what I am doing here.
Best,
Stew

DOGE vs LTC same pattern as 2019! bullrun eoy!?Doge vs LTC in back in 2017-2019
This is what im expecting

BTC buying opportunity aheadIf US dips into publicly acknowledged recession in Q3, we might see crypto correction, as a benchmark - BTC to 12000 in autumn.
I see this as an ultimate buying opportunity.
Pros:
recession is likely to happen
crypto needs much more accumulation for a good bullrun than it has now
I can't see a real bullrun without Fed pivot, only BTC/LTC/ETH speculations on banking collapse fear, it is not a proper fuel to 100k BTC.
Cons:
fiats hyperinflation might trigger earlier hype in crypto, then no such deep correction will occur
Fed might make early changes to monetary policy to assure banking system safety, this will hurt crypto accumulation and cancel the dip

LTC/USDT 4H Interval ReviewHello everyone, I invite you to review the LTC chart on the four-hour interval. As we can see, the price is moving below the main downtrend line, while locally we can see that the price is moving sideways from the local downtrend line.
Let's start by marking the price support points and we see that we first have strong support at $53.39, but if the price goes lower then we have another support at $44.74 and then a strong support zone from $37 to $31 $.
Looking the other way, we can similarly determine the places of resistance that the price has to face. And here we see that the price is currently fighting resistance at $66.59. There is still resistance at $72.97, once price breaks it it will move towards resistance at $78.28, and then it has to break through the strong resistance zone from $83 to $91.
The CHOP index indicates that there is a lot of energy for the upcoming move, on the RSI we see an increase towards the middle of the range despite very little price movement, while the STOCH indicator is moving in the upper part of the range, which may affect the price drop in the coming hours.

🔥 Litecoin Huge 5-Year Head & Shoulders: Prepare For Dump 🚨Recently I've made some analyses on LTC and its halving. In every analysis I compared LTC's post-halving price action in history and came to the conclusion that the LTC halving is a sell the news event, see below. For the foreseeable future I'm quite bearish on LTC, but even more bearish on the LTC/BTC pair - it will lose value against BTC.
I'm waiting for LTC to break below the neck-line of the H&S pattern. Target at the 2018 lows, stop around 50$. Be patient for the break out.

LITECOIN's Post-Sell-Off Potential:Navigating the Crypto Storm..Capitalizing on Crypto Chaos: Litecoin's Post-Sell-Off Potential
The cryptocurrency world experienced a sudden seismic shift yesterday as Bitcoin's abrupt plunge sent shockwaves rippling through the entire sector. This downward spiral was set into motion by a Wall Street Journal report that SpaceX, a significant proponent of the digital currency, had marked down its Bitcoin holdings for 2021 and 2022 by a staggering $373 million through cryptocurrency sales. The markets responded with a frenzied overreaction, prompting a wave of sell-offs across the retail sector. However, a closer examination reveals that SpaceX's actions had been taking place quietly over the course of the past two years, rather than being a sudden decision made yesterday.
The sharp and swift selling frenzy can be attributed to a temporary loss of confidence stemming from the perception that one of Bitcoin's staunchest backers was now heading for the exit. While it may seem logical for Bitcoin's value to continue sliding, as other blockchain projects have long been offering features that Bitcoin either couldn't fulfill or chose not to, the chain reaction of this sell-off has created an unexpected silver lining: excellent buying opportunities.
In the midst of this cryptocurrency chaos, Litecoin emerges as a beacon of promise and a potentially lucrative long position. The highly anticipated halving event, which has historically led to substantial rallies, defied expectations by triggering a 10%+ sell-off. Yet, this unexpected response can also be seen as a sign of the maturation of the crypto sector.
A deeper look into Litecoin's long-term fundamentals reveals its potential as a game-changer in the world of cryptocurrency. It encompasses all the necessary elements required to disrupt traditional fiat transactions. Moreover, Litecoin has managed to carve out a significant adoption rate within a plethora of high-growth, high-value industries including gaming, sports betting, digital peer-to-peer payment processing firms, and globally recognized brands.
The aftermath of the post-halving sell-off is where the real opportunity arises, amplified by the aftershocks of Bitcoin's tumultuous trajectory. While short-term volatility is expected as bulls and bears lock horns over the next move, those who dare to venture into Litecoin's waters during these times could be rewarded handsomely. History provides a compelling precedent: the LTC/USD pair has a history of rebounding with vigor following extreme sell-offs.
Over the last six weeks, the LTC/USD price plummeted from its previous heights of $114+ to below $56. However, this downward trajectory seems to mask a more bullish outlook than what the market has seen in recent years. Despite the one-day slump triggered by Bitcoin's turmoil, the forecast for LTC/USD remains cautiously optimistic, with the potential for a turnaround that could defy current pessimism.
As the crypto market grapples with uncertainty and Bitcoin's reverberations continue to be felt, Litecoin appears poised to prove its resilience and potential as a rewarding long-term investment. In these tumultuous times, where opportunities emerge from chaos, Litecoin's path might just be the one leading to significant gains for those willing to navigate through the storm.

SasanSeifi 💁♂️LTC 👉12H🔻 77$ / 70$ Hey there! As you can see from the 12-hour timeframe, there's a corrective trend going on right now, with the current trading price around $81. I'm kinda expecting the price to adjust down to the $77 liquidity zones. To get a clearer picture, it'll be interesting to see if that support range holds up, right? If it gets a good confirmation around that price, we might see some positive fluctuations. On the flip side, if it doesn't hold up, we could be looking at further corrections possibly down to the $70 range. Let's keep an eye on it!
Just keep these scenarios in mind as you analyze the market. Remember, things can always change unexpectedly, so stay flexible in your trading approach.❗
Wishing you loads of success in your trading adventures, my friend!✌
❎ (DYOR)...⚠️⚜️
Sure, if you have any more questions or need further clarification, feel free to ask. I'm here to help!
And if you found my analysis helpful, I would appreciate it if you could show your support by liking and commenting. Thank you!🙌

LTC/USDT 1DAY UPDATE BY CRYPTO SANDERS !!hello, welcome to this LTC/USDT update by CRYPTO SANDERS.
CHART ANALYSIS:- Litecoin (LTC) fell by as much as 15% on Friday, as a red wave washed over the cryptocurrency market.
LTC/USD fell to a low of 61.76 late on Thursday, which came following a high of 74.73 earlier in the day.
This decline pushed LTC to its lowest point since December 19, when the price traded to a low of 61.00.
As a result of this sell-off, the relative strength index (RSI) fell below the 30.00 level, which means the price is oversold.
the index is tracking at 18.21, its weakest point since November 2018.
The price has since moved away from earlier lows and is currently trading at 64.80.
I have tried to bring the best possible outcome to this chart.
Hit the like button if you like it and share your charts in the comments section.
Thank you

LTCUSDT support and resistances for high time frame tradesThe price hit the monthly support MS1 and bounced from there. It is currently trading above the monthly support MS1 and currently consolidating in price range around 64. This is kind of no trade zone for high time frame. All the high time frame resistances and supports are marked on the chart. A long is favorable if the price taps into the monthly support MS1 again. On the resistance side, first it will face 4h resistance 4HR1 around 73.5-75.5. That will be a level to short but not the best one. Next resistance level is daily resistance DR1 around 81.5-84 which is a better level to go short. Above that there is a weekly resistance level WR1 sitting around 91-94 offering the best shorting or offloading any long. For short term trade opportunities, we should look at lower time frame charts. If requested, I will look at low timeframe trade setups and share in a separate post.

LTC around 25USD?I hope I'm wrong, dropped out of the triangle and top 3 times before. This is not entirely positive for LTC.
Also, the existence of other cryptocurrencies with similar or better properties (XRP ?) may affect the demand and value of LTC. Competition in the cryptocurrency space is very strong, so it is important to monitor the innovation and development of competing projects.
