LTCBTC DailyY Chart TechnicalsLTCBTCspiked up yesterday and closed with a solid bullish candle.
LTCBTC tested 0.00379 BTC resistance and closed below it.
We need a support from BTC.D for LTCBTC to continue the bullish move.
Bitcoin Dominance shall remain neutral or bearish for this move.
Above 0.003790 BTC, we will see 0.00405 BTC, which is a minor CRYPTOLEAN resistance.
The next main resistance in the daily chart for LTCBTC is 0.00443 BTC.
LTCBTC is trading as doji candle so far.
LTCBTC

LTCBTC Cup and Handle aiming at 0.00600Litecoin (LTCUSD) has been greatly overperforming against Bitcoin (BTCUSD) since June 13 and last week even broke above the Lower Highs trend-line that has been holding since the April 2019 Highs.
This rally is coming after the completion of a technical Cup and Handle (C&H) pattern, after breaking above the 1D MA50 (blue trend-line) and having the 1D MA200 (orange trend-line) as Support since late August.
Technically, the pattern targets the 2.0 Fibonacci extension, which is just above 0.00600.
-------------------------------------------------------------------------------
** Please LIKE 👍, SUBSCRIBE ✅, SHARE 🙌 and COMMENT ✍ if you enjoy this idea! Also share your ideas and charts in the comments section below! This is best way to keep it relevant, support me, keep the content here free and allow the idea to reach as many people as possible. **
-------------------------------------------------------------------------------
You may also TELL ME 🙋♀️🙋♂️ in the comments section which symbol you want me to analyze next and on which time-frame. The one with the most posts will be published tomorrow! 👏🎁
-------------------------------------------------------------------------------
👇 👇 👇 👇 👇 👇
💸💸💸💸💸💸
👇 👇 👇 👇 👇 👇

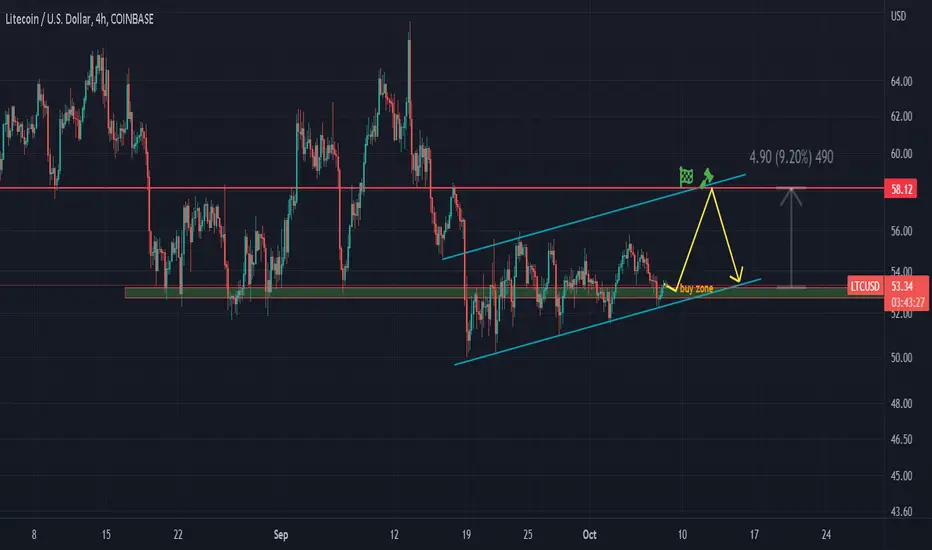
LTCUSDT planEntry at breakout is either under 55 or a top trendline. We might also have bearish ABCD that's when we short at the 63 - 65 area, as you can see we also have some resistance over there. Enjoy...
Some take profit points for short 58, 56, 50

LTC/BTC Ready for Another -70% Fall ..?#LTC/BTC Technical Analysis:-
#Litecoin Is currently trading around 0.0036 BTC level.
As Per chart Big Resistance Level is 0.0044 BTC
If Break 0.0044 BTC level then I am expecting Big Move upward side but IMO not break and It will test again New Low’s.
So Be ready for Both Scenario and Never open any trade Blindly.
I am Fully Prepared for Next Bull Market and Working hard for you also.
I want Next Bull run you all wealth 10x-50x
Now Coming to The chart…
If Rejected from 0.0044 BT.LC Level resistance then I am expecting it will test 0.0025 BTC ( Which is approx -38% from Rejection level.
And Also Expecting more down fall if break 0.0025 Level then It will test 0.0012 Level in Few Months. ( -70% from Current Level )
So Guys Trade with Mind not FOMO
Support:- 0.0025/0.0012 BTC
Resistance:- 0.0044 BTC
Please Like and Appreciate ❤️❤️❤️

LTC for another leg upI have a sell order in at 70.40
We are ready for another pump as this bull flag finishes forming.

Litecoin - 2000% profit! Last chance to buy low.
The bottom is in for Litecoin, and you have the last chance to buy cheap Litecoin these days!
20x is a reasonable target to take profits because you want to be greedy. It's been almost 5 years of sideways price action.
If you like Gandalf or Litecoin, then hit the like button right now!
As you can see on the chart, there is a running flat pattern, which is an Elliott Wave corrective pattern that may occur after a strong impulse wave. This pattern has been completed after almost 5 years.
If you didn't know that, Litecoin was the first altcoin, which can be mentioned in the Guinness World Records book. This is pretty impressive, isn't it?
Let me know in the comment section if you want to buy Litecoin or if you already hold litecoin. I look forward to your comments!
If we take a look at the MACD indicator, we can spot a bullish histogram on the weekly chart, and we can also see 3 peaks, which indicates a diagonal wave.
Litecoin experienced a massive bull run in 2015–2017. Another bull run is, of course, very likely in my opinion, and it can be very soon.
Litecoin was released via an open-source client on GitHub on Oct. 7, 2011.
The cryptocurrency was created based on the Bitcoin (BTC) protocol, but it differs in terms of the hashing algorithm used, hard cap, block transaction times and a few other factors.
For more analysis, hit "Like" and "Follow"!

Litecoin: Attempting to Break Free From a Multi-Year-DowntrendA few years ago Litecoin was trading at this very level and at the time the idea was that it would eventually make a higher low and give us a Bullish Bat-Action-Magnet-Move which would result in LTC confirming a harmonic W structure and revisiting the 88.6% Retrace Above to Finalize a Bearish Bat Pattern; After many months we finally set in the higher low we were looking for and began to go for the 88.6% Retrace to complete the pattern, once hit we began what would now soon be a Multi-Year-Decline.
However now we seem to be showing Signs of Seller Exhaustion in the form of Double MACD Bullish Divergence and an Oversold RSI and now it is testing the Downtrending Line to see if there's enough supply there to keep it down or if the sellers truly are too exhausted to continue this downtrend much longer. If the trendline breaks Bullishly which i do think it likely will my First target will be to take us back to the level this downtrend first bagan (the initial zone of reversal) which i labeled "The Danger Zone" back before the intital Bearish Reversal happened but if things get truly insane I think it could see as high as the 1.618 Fibonacci Extension at $700-$2200 depending on rather or not you're looking at it from a Linear Scale or Log Scale basis.
Along with that LTC since around Nevember of last year has been showing Bullish Variables against it's BTC Pairs, The Total Cryptomarket Cap, and Oher Individual Alts such as BCH and ETH. It would be alot to go into the full details of all of those variables here in this post, but i have posted these variables live as price action has progressed over the years so if you want to see the details of these variables, I'v listed them below in the Related Ideas Section.

LTC/USDT - LONG 12H TF----- Welcome, dear followers! -----
- Here is my trading methodology. I trade with a normal system and analysis of resistance and support, as well as price reversal patterns.
- For the record, I do not place a stop loss within my trades. So that I only risk 1.5% of my total capital in order to support the loss due to a price reversal against me.
- If a price reversed against my expectation and touched the drawn line r3, then I transferred targets to the entry point and waited for the price to close at it with a loss equal to almost zero.
- Today's deal is shown in the chart, and here are the entry and exit points below.
-- Support me with numbers and follow up on my account for other deals in the future. Thank you for coming to this part. --
-------------------------------------------------------
⚡️⚡️ #LTC/USDT ⚡️⚡️
Client: My-Binance Futures
Trade Type: Breakout (Long)
Leverage: Cross (1X)
Entry Targets:
1) 68.87 - 100.0%
Take-Profit Targets:
1) 78.22 - 20.0%
2) 85.49 - 20.0%
3) 96.92 - 20.0%
4) 115.44 - 20.0%
5) 133.96 - 20.0%
Trailing Configuration:
Entry: Percentage (1.5%)
Take-Profit: Percentage (0.75%)
Stop: Breakeven -
Trigger: Target (1)

LTCUSDTanalysis was shared few days ago
analRUning in 30% profit already
now breaking resistance incase breakout expecting 50% another impulse

LTC/BTC to .00330000Expecting a rise from the bottom of this channel, with a potential for a third touch making the top line valid
who knows
nfa

LTC/USDT - LONG----- Welcome, dear followers! -----
- Here is my trading methodology. I trade with a normal system and analysis of resistance and support, as well as price reversal patterns.
- For the record, I do not place a stop loss within my trades. So that I only risk 1.5% of my total capital in order to support the loss due to a price reversal against me.
- If a price reversed against my expectation and touched the drawn line r3, then I transferred targets to the entry point and waited for the price to close at it with a loss equal to almost zero.
- Today's deal is shown in the chart, and here are the entry and exit points below.
-- Support me with numbers and follow up on my account for other deals in the future. Thank you for coming to this part. --
-------------------------------------------------------
⚡️⚡️ LTC/USDT ⚡️⚡️
Exchange: Binance Futures
Trade Type: Breakout (Long)
Leverage: Isolated (5.0X)
Entry Orders:
1) 52.35 - 100.0% (177.9822 USDT)
Take-Profit Orders:
1) 55.57 - 75.0%
2) 57.53 - 20.0%
3) 60.33 - 5.0%
Trailing Configuration:
Stop: Breakeven -
Trigger: Target (1)

LTCBTCundervalued here imo
1st EVER altcoin
just feels like it cant goto 0
fib structures fit so theres some kind of market structure to it..
idk most confusing f/a coin in crypto tbh

LtcbtcHi. Can we see successful break up in ltc. Support and resistance are in chart Fibonacci basically.

LTC - 1H another bearish legThe LTC price will fall from these prices. We have had a zone that couldn't pump the price for 2 days, showing buyers' weakness after that falling leg. It seems the pullback has been completed, and the price can decrease more with a strong bearish candle.

LTCUSD small pump LTCUSD sitting on the support.
Buy now and sell at the resistance.
As Bitcoin is still consolidating, we expect 9 % pump and then getting rejected and coming back down.
Good luck
LTC CAN FALLI think the neo-wave triangle is complete and we are making small pullbacks to the trends and will go down again.

LTCNot financial advice. The essence of investing & trading is the intelligent and patient preying on the greed, fear, impatience, addiction and ignorance of the majority. It's definitionally Darwinian.

LTC ON CUSP OF BREAKOUT So close. LTC had 2 clean bounces above the range and is eyeing for $60. We have hidden bullish divergence on 15min so let’s see how much it can contribute and If she can break through…

LTC Cheat Sheet for 2022.Let's see how true this plays out going into 2023. I prefer to trade long term and create guides like this for myself to keep me on track. Hope it becomes useful for others as well.
Not Financial Advice.

LTC Litecoin Price TargetLTC Litecoin looks bearish right now, due to the market conditions.
My price target for LTC Litecoin is the Covid lockdown level of $23.
Looking forward to read your opinion about it.

Litecoin LTC Bearish Sentiment Major cryptocurrencies have seen heavy coin inflow into exchanges recently.
I expect a strong sell pressure on LTC Litecoin.
LTC/USDT short
Entry Range: $52 - 55
Price Target 1: $42
Price Target 2: $36
Price Target 3: $24
Stop Loss: $63

LTC/USDT - SHORT MEDIUM-TERM----- Welcome, dear followers! -----
- Here is my trading methodology. I trade with a normal system and analysis of resistance and support, as well as price reversal patterns.
- For the record, I do not place a stop loss within my trades. So that I only risk 1.5% of my total capital in order to support the loss due to a price reversal against me.
- If a price reversed against my expectation and touched the drawn line r3, then I transferred targets to the entry point and waited for the price to close at it with a loss equal to almost zero.
- Today's deal is shown in the chart, and here are the entry and exit points below.
-- Support me with numbers and follow up on my account for other deals in the future. Thank you for coming to this part. --
-------------------------------------------------------
⚡️⚡️ LTC/USDT ⚡️⚡️
Exchange: Binance Futures
Trade Type: Breakout (Short)
Leverage: Cross (1.0X)
Entry Orders:
1) 49.92 - 100.0% (148.91248 USDT)
Take-Profit Orders:
1) 46.58 - 80.0%
2) 42.56 - 19.999%
Trailing Configuration:
Stop: Breakeven -
Trigger: Target (1)

