LTCEUR
New ATH target for Litecoin - 500/700 EUR over the coming daysHistoric long term support and resistance line forming a very smooth flag pattern on the 4HR chart. Volume has increased in the last few days for the first time in quite a while. Stochastic RSI lines also just crossed in oversold territory. Overall pattern looking very bullish in my opinion. I also think Litecoin is fairly undervalued at the current moment - I expect significant upward movement over the next few days.
LTC vs EUR looks bullishLTC formed a perfect 'Symmetrical Triangle'. So a breakout or breakdown is to be expected.
As Charlie Lee tweeted, a lot of volume was moved within LTC.
twitter.com
Those two combined are the perfect mix for a breakout according to:
www.investopedia.com
Within the next three days LTC should breakout. At least an 80% increase is to be expected.
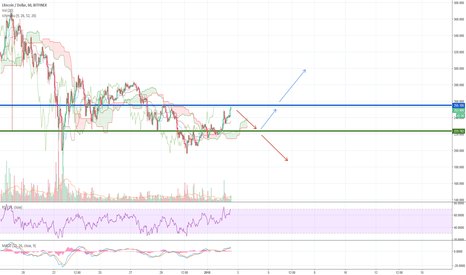
LTCs lovely start in 2018if you hodld this little coin over from last year your christmas came early (like 355 days early). we have seen a nice bull run after that 225$ resistance and down trend combo breach, but i think that good news will stop for now, we are at another very persistent resistance that might bounce our coin back down to that 225$ mark. but before shorting wait for conformation.
LTC bull or bear start of 2018don't forget to write 2018 instead of 2017.
there is no indication where this little coin will go at the moment, but we will get the answer before the end of this day. we can either breach top trend line and we start our year with bull coin or we can bounce back below 225$ and we will not stop till 200$. be patient wait for conformation and react according to the new information.
LTC up movement before christmasHappy new year guys, and wow what a rush this last day of 2017. LTC broke channel quickly volume is greater than the last few hours but its not as big as i would like it to be to confirm upward movement. but it looks like that our friendly little coin is forming a flag, its not yet confirmed but we could see yet another jump up so stay tuned, and save those champagnes for later.
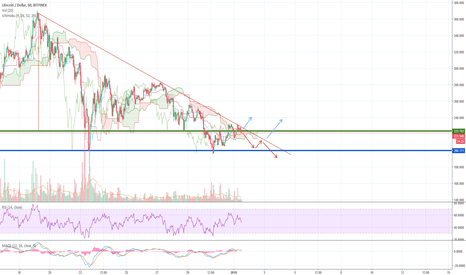
LTC is strugglingso we have breached 225 support and it now became our resistance. selling pressure was strong when we hit 200$ but never the less we quickly jumped back into the channel and the same thing happened at 225$. buying pressure was strong but we bounced back down again. that was classic bear trap, if you didn't wait for candle to close above 225$ resistance and you bought immediately after it breached you got burned. now we are in this weird channel where we can't be sure where the price will move, we can either wait for one line to be broken or we can make short term trades, but one thing is sure, if we manage to breach 225$ resistance we will see upward movement and we can open some long positions but if we stay in this channel long enough that we touch downward trend line, we should see price plummet below 200$ mark
previous idea:
will LTC hit low in mid January1H graph for LTC looks like one giant descending triangle that will bring sadness to people still HODLing this coin. i think that we might see this coin fall to 200$ if it breaches resistance at 225$. that can happen in few days and than who knows where we will go from there. upward movement is also possible if it breaches top trend line with nice volume, which seems unlikely in current market participation
LTC broke supportLike i said in my previous TA, bounce from support was not supported with great volume, and over time descending triangle formed and it pushed price bellow the support line, great for SHORTing. now we have a new formation, that could be a downward facing flag and we could see another corresponding dip.
A very good setup I see on LTCBTC chart.A very good setup, multiple signals shown on the 4 hour chart, MACD about to golden cross, ascending triangle, risking 10% to gain 45% isn't bad but considering the current situation that BTC is in, I will only risk 10% of my crypto portfolio on this trade.
TRADE WITH YOUR OWN RESPONSIBILITY, THIS IS NOT AN ADVICE.


