Trading balanceTrading balance The price of the asset has rebounded from the balance zone. With the prospect of growth into the resistance zone.
LTCUSD

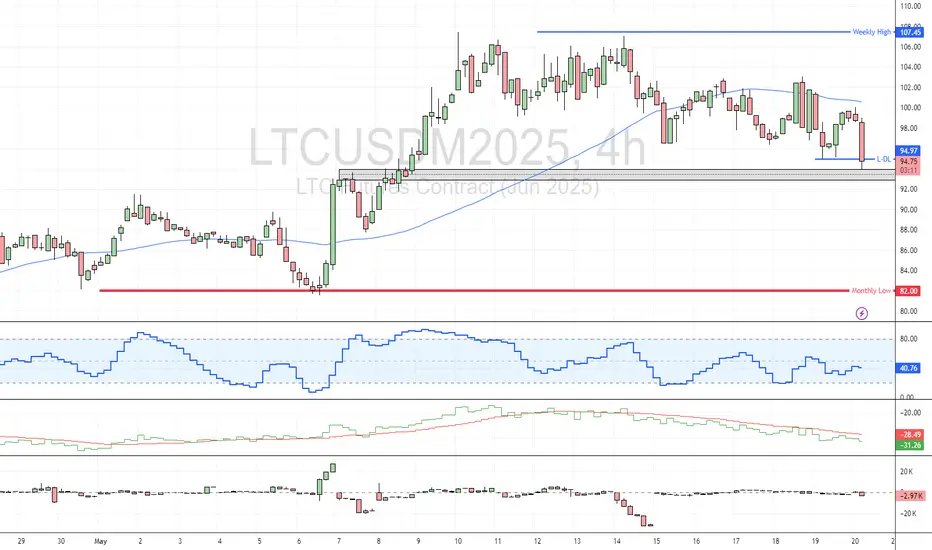
Litecoin is Oversold—Is a Rebound Coming? FenzoFx—Litecoin swept liquidity below the previous week's low, aligning with the monthly low at $81.01, a strong support zone.
LTC trades near $83.70 with weak bullish sentiment. Stochastic at 11.00 signals an oversold market, suggesting potential consolidation or a rebound.
A bullish wave may emerge if LTC holds above $81.01, targeting $91.92. Closing below this level invalidates the bullish outlook.

LTCUSD INTRADAY oversold bounceback supported at 865Trend Overview:
LTC/USD remains in a bullish trend, characterized by higher highs and higher lows. The recent intraday price action is forming a continuation consolidation pattern, suggesting a potential pause before a renewed move higher.
Key Technical Levels:
Support: 865 (primary pivot), followed by 845 and 820
Resistance: 956 (initial), then 1000 and 1045
Technical Outlook:
A pullback to the 865 level, which aligns with the previous consolidation zone, could act as a platform for renewed buying interest. A confirmed bounce from this support may trigger a continuation toward the next resistance levels at 956, 1000, and ultimately 1045.
Conversely, a daily close below 865 would suggest weakening bullish momentum. This scenario would shift the bias to bearish in the short term, potentially targeting 845 and 820 as downside levels.
Conclusion:
LTC/USD maintains a bullish structure while trading above the 865 support. A bounce from this level would validate the consolidation as a continuation pattern, with upside potential toward the 956 area. A breakdown below 865, however, would invalidate this view and suggest deeper corrective risk.
This communication is for informational purposes only and should not be viewed as any form of recommendation as to a particular course of action or as investment advice. It is not intended as an offer or solicitation for the purchase or sale of any financial instrument or as an official confirmation of any transaction. Opinions, estimates and assumptions expressed herein are made as of the date of this communication and are subject to change without notice. This communication has been prepared based upon information, including market prices, data and other information, believed to be reliable; however, Trade Nation does not warrant its completeness or accuracy. All market prices and market data contained in or attached to this communication are indicative and subject to change without notice.

LTCUSD💡 LTC/USDT – 4H Chart Setup
Bullish Divergence spotted on the 4H timeframe.
📌 Trade Plan
Entry (Buy Stop): 91.08 (Break of Lower High)
Stop Loss (SL): 81.95
Take Profit 1 (TP1): 98.89
Take Profit 2 (TP2): 106.86
📈 Risk Management
Open 2 positions
Once TP1 is hit, trail SL to Entry (EP) to secure risk-free run toward TP2
🧠 Reasoning:
Bullish divergence indicates potential reversal. Entry planned above the LH to confirm momentum shift.

Litecoin - Expecting Bearish Continuation In The Short TermM15 - Clean bearish trend with the price creating series of lower highs, lower lows.
No opposite signs.
Expecting further continuation lower until the two Fibonacci resistance zones hold.
If you enjoy this idea, don’t forget to LIKE 👍, FOLLOW ✅, SHARE 🙌, and COMMENT ✍! Drop your thoughts and charts below to keep the discussion going. Your support helps keep this content free and reach more people! 🚀
--------------------------------------------------------------------------------------------------------------------
Disclosure: I am part of Trade Nation's Influencer program and receive a monthly fee for using their TradingView charts in my analysis.

LTCUSDT 1D AnalysisLTC ~ 1D Analysis
#LTC Buy after successfully breaking this resistance line with a short term target of at least 10%+ from here.

Litecoin Consolidation Nears End—New Downtrend Ahead?FenzoFx—Litecoin's consolidation near $91.0, marking 50% of its previous bearish leg, may be nearing its end as a long-wick bearish candlestick forms on the 4-hour chart.
Key support lies at $88.7, and a close below this level could trigger a downtrend targeting $87.00 and $86.00. The bearish outlook remains intact below $92.39 resistance.

Bearish Pressure Eases—Can Litecoin Recover?FenzoFx—Litecoin remains bearish after breaking below $93.55, though selling pressure eased near $83.0. Currently, LTC/USD is testing the bearish Fair Value Gap at $87.5.
A recovery toward $93.55 is possible if price closes above the $88.0–$90.0 zone, allowing bullish momentum to extend toward $92.00.
However, a dip below $85.0 would invalidate this outlook, with the next bearish target at $81.0.

Litecoin’s Sharp Drop—Will the Downtrend Continue?FenzoFx—Litecoin dropped 6.2% yesterday, marking its largest daily range this week. It failed to hold within the High Volume Node box, and selling pressure in the Asian session pushed the price below weekly support to a new low of $89.3.
Currently, LTC/USD is consolidating near the 61.8% Fibonacci retracement level, a key resistance zone. If this level holds, the downtrend may resume, targeting weekly support levels.
Given that Litecoin has already reached its average daily range, no major moves are expected today.

#LTC/USDT#LTC
The price is moving within a descending channel on the 1-hour frame, adhering well to it, and is heading for a strong breakout and retest.
We are seeing a bounce from the lower boundary of the descending channel, which is support at 92.48.
We have a downtrend on the RSI indicator that is about to be broken and retested, supporting the upward trend.
We are looking for stability above the 100 moving average.
Entry price: 97.44
First target: 100.24
Second target: 102.45
Third target: 105.26

LTC Consolidates After Taking the Buy Side LiquidityFenzoFx—Litecoin surged to $99.5 in the Tokyo session but failed to hold gains, dropping below $97.85. LTC/USD is now consolidating at $96.60, with sellers gaining control.
Since LTC has already exceeded its daily range, a further pullback is expected. The weekly low zone of $93.50–$93.00 could offer a low-risk buy entry.
The bullish outlook remains intact as long as LTC holds above $93.00, with targets at $96.5 and $97.88 this week.

LTCUSD INTRADAY uptrend continuation supported at 930Trend Overview:
Litecoin (LTC/USD) maintains a bullish structure, supported by an ongoing rising trend. The recent intraday price action suggests a corrective pullback, which may provide an opportunity for trend continuation if key support levels hold.
Key Technical Levels:
Support: 930 (primary), followed by 900 and 874
Resistance: 1,040 (initial), then 1,090 and 1,120
Technical Outlook:
A pullback to the 930 level, which aligns with a prior consolidation area, may present a bullish setup. A confirmed bounce from this support could initiate the next leg higher, with upside targets at 1,040, 1,090, and 1,120 over the longer term.
On the downside, a daily close below 930 would invalidate the bullish outlook, opening the door for a deeper retracement toward 900 and possibly 874.
Conclusion:
LTC/USD remains bullish above the 930 support level. A successful retest of this level could trigger continuation toward the 1,100+ range. However, a break below 930 would turn the short-term outlook bearish, signaling potential for deeper downside extension.
This communication is for informational purposes only and should not be viewed as any form of recommendation as to a particular course of action or as investment advice. It is not intended as an offer or solicitation for the purchase or sale of any financial instrument or as an official confirmation of any transaction. Opinions, estimates and assumptions expressed herein are made as of the date of this communication and are subject to change without notice. This communication has been prepared based upon information, including market prices, data and other information, believed to be reliable; however, Trade Nation does not warrant its completeness or accuracy. All market prices and market data contained in or attached to this communication are indicative and subject to change without notice.

LTC Eyes $97.88: Bullish Momentum HoldsFenzoFx—LTC/USD surged to $95.4 in the London session, stabilizing above Tokyo’s session high. Institutional traders increased long orders, signaling further upside potential. A bullish hammer at $93.5 confirms this critical support level. The expected target is $96.5, followed by $97.88 later this week.
The bullish trend holds unless LTC falls below $93.1, which would invalidate the outlook.

LTC Approaching Key ResistanceFenzoFx—Litecoin (LTC) gained $2.0, reaching $96.9 and approaching weekly highs. During the London session, it is preparing for the next bullish move, with a potential test of $97.88 in New York to complete its range increase.
However, entering long at this level is risky in the short term. A retest of the FVG area ($94.0–$95.0) may occur in the late New York session before further gains.
As long as LTC holds above $93.1, the bullish trend remains intact, with $97.8 as the immediate target and $104.0 expected later this week.

Litecoin is Profit Taking at Critical Juncture FenzoFx—Litecoin's uptrend started at $92.34 and hit a weekly high of $102.5, tested by buyers in today's Tokyo session. This resistance may be retested in London or New York.
The selling push at $102.5 left a long-wick candlestick but lacked strong volume, indicating buyers are still active. Today's range is 76% of yesterday's move, supporting this outlook.
Bearish View : LTC/USD remains bearish below $103.0. We expect a retest at this level during the London session before declining toward $99.0.
Invalidation : If LTC/USD closes above $103.0, the bullish target shifts to $110.0.

Litecoin H4 | Falling toward an overlap supportLitecoin (LTCUSD) is falling towards an overlap support and could potentially bounce off this level to climb higher.
Buy entry is at 92.64 which is an overlap support.
Stop loss is at 86.50 which is a level that lies underneath a swing-low support and the 38.2% Fibonacci retracement.
Take profit is at 104.78 which is a swing-high resistance.
High Risk Investment Warning
Trading Forex/CFDs on margin carries a high level of risk and may not be suitable for all investors. Leverage can work against you.
Stratos Markets Limited (tradu.com/uk):
CFDs are complex instruments and come with a high risk of losing money rapidly due to leverage. 63% of retail investor accounts lose money when trading CFDs with this provider. You should consider whether you understand how CFDs work and whether you can afford to take the high risk of losing your money.
Stratos Europe Ltd (tradu.com/eu):
CFDs are complex instruments and come with a high risk of losing money rapidly due to leverage. 63% of retail investor accounts lose money when trading CFDs with this provider. You should consider whether you understand how CFDs work and whether you can afford to take the high risk of losing your money.
Stratos Global LLC (tradu.com/en):
Losses can exceed deposits.
Please be advised that the information presented on TradingView is provided to Tradu (‘Company’, ‘we’) by a third-party provider (‘TFA Global Pte Ltd’). Please be reminded that you are solely responsible for the trading decisions on your account. There is a very high degree of risk involved in trading. Any information and/or content is intended entirely for research, educational and informational purposes only and does not constitute investment or consultation advice or investment strategy. The information is not tailored to the investment needs of any specific person and therefore does not involve a consideration of any of the investment objectives, financial situation or needs of any viewer that may receive it. Kindly also note that past performance is not a reliable indicator of future results. Actual results may differ materially from those anticipated in forward-looking or past performance statements. We assume no liability as to the accuracy or completeness of any of the information and/or content provided herein and the Company cannot be held responsible for any omission, mistake nor for any loss or damage including without limitation to any loss of profit which may arise from reliance on any information supplied by TFA Global Pte Ltd.
The speaker(s) is neither an employee, agent nor representative of Tradu and is therefore acting independently. The opinions given are their own, constitute general market commentary, and do not constitute the opinion or advice of Tradu or any form of personal or investment advice. Tradu neither endorses nor guarantees offerings of third-party speakers, nor is Tradu responsible for the content, veracity or opinions of third-party speakers, presenters or participants.

Litecoin Approaches $104 ResistanceFenzoFx—Litecoin's uptrend from $93.35 continued, reaching $100.00.
Price is now targeting the $103.00–$104.00 resistance zone, where selling pressure may emerge. A pullback to $98.00 is possible if the level holds. Traders should watch for bearish signals during the NY session.
Trade LTC/USD with FenzoFx, Low Spread, No Commission, No Swap.

LtcusdLitecoin is currently trading at $95.84, testing resistance near $97.22. A breakout above this level could target $100, while support is seen around $92.65. Monitoring key levels for potential opportunities.

LTC Started the Bullish Move We Were ExpectingFenzoFx—Litecoin is holding strong at the $93.35 support, fueling a new bullish wave. Bears tested this level in the last session, but it remained intact.
As long as LTC stays above $93.35, the next target is $100.12, with potential for $102.95 if buying pressure increases.
>>> Trade LTC swap free at FenzoFx.

LTC Once Again Presents a Buying Opportunity for ScalpersFenzoFx—Litecoin once again is testing the $93.0 resistance area, while the price has been below the 50-period simple moving average. This level hasn't been fully tested; therefore, if it holds, LTC will likely rise toward the $100.0 resistance.
Please note that a new bearish wave toward $88.0 could develop if LTC/USD dips and stabilizes below the aforementioned support area.
Litecoin H4 | Falling toward a pullback supportLitecoin (LTCUSD) is falling towards a pullback support and could potentially bounce off this level to climb higher.
Buy entry is at 92.64 which is a pullback support that aligns with the 50.0% Fibonacci retracement.
Stop loss is at 86.50 which is a level that lies underneath a swing-low support.
Take profit is at 101.86 which is a swing-high resistance.
High Risk Investment Warning
Trading Forex/CFDs on margin carries a high level of risk and may not be suitable for all investors. Leverage can work against you.
Stratos Markets Limited (tradu.com):
CFDs are complex instruments and come with a high risk of losing money rapidly due to leverage. 63% of retail investor accounts lose money when trading CFDs with this provider. You should consider whether you understand how CFDs work and whether you can afford to take the high risk of losing your money.
Stratos Europe Ltd (tradu.com):
CFDs are complex instruments and come with a high risk of losing money rapidly due to leverage. 63% of retail investor accounts lose money when trading CFDs with this provider. You should consider whether you understand how CFDs work and whether you can afford to take the high risk of losing your money.
Stratos Global LLC (tradu.com):
Losses can exceed deposits.
Please be advised that the information presented on TradingView is provided to Tradu (‘Company’, ‘we’) by a third-party provider (‘TFA Global Pte Ltd’). Please be reminded that you are solely responsible for the trading decisions on your account. There is a very high degree of risk involved in trading. Any information and/or content is intended entirely for research, educational and informational purposes only and does not constitute investment or consultation advice or investment strategy. The information is not tailored to the investment needs of any specific person and therefore does not involve a consideration of any of the investment objectives, financial situation or needs of any viewer that may receive it. Kindly also note that past performance is not a reliable indicator of future results. Actual results may differ materially from those anticipated in forward-looking or past performance statements. We assume no liability as to the accuracy or completeness of any of the information and/or content provided herein and the Company cannot be held responsible for any omission, mistake nor for any loss or damage including without limitation to any loss of profit which may arise from reliance on any information supplied by TFA Global Pte Ltd.
The speaker(s) is neither an employee, agent nor representative of Tradu and is therefore acting independently. The opinions given are their own, constitute general market commentary, and do not constitute the opinion or advice of Tradu or any form of personal or investment advice. Tradu neither endorses nor guarantees offerings of third-party speakers, nor is Tradu responsible for the content, veracity or opinions of third-party speakers, presenters or participants.

LTC Short & LongI am calling this trade on 05/19/2025. Looking at my markups you will see both short and long term entries and exit opportunities as we buy low and sell high.
#LTCUSD
#NextBigTrade
update coming soon after 50 PIP profit.

LTCUSDT 1D Analysis LTC ~ 1D Analysis
#LTC Buy after successfully breaking this resistance line or buy when retesting this support block with a short term target of at least 10%+.
