Litecoin H4 | Falling toward an overlap supportLitecoin (LTCUSD) is falling towards an overlap support and could potentially bounce off this level to climb higher.
Buy entry is at 92.64 which is an overlap support.
Stop loss is at 86.50 which is a level that lies underneath a swing-low support and the 38.2% Fibonacci retracement.
Take profit is at 104.78 which is a swing-high resistance.
High Risk Investment Warning
Trading Forex/CFDs on margin carries a high level of risk and may not be suitable for all investors. Leverage can work against you.
Stratos Markets Limited (tradu.com/uk):
CFDs are complex instruments and come with a high risk of losing money rapidly due to leverage. 63% of retail investor accounts lose money when trading CFDs with this provider. You should consider whether you understand how CFDs work and whether you can afford to take the high risk of losing your money.
Stratos Europe Ltd (tradu.com/eu):
CFDs are complex instruments and come with a high risk of losing money rapidly due to leverage. 63% of retail investor accounts lose money when trading CFDs with this provider. You should consider whether you understand how CFDs work and whether you can afford to take the high risk of losing your money.
Stratos Global LLC (tradu.com/en):
Losses can exceed deposits.
Please be advised that the information presented on TradingView is provided to Tradu (‘Company’, ‘we’) by a third-party provider (‘TFA Global Pte Ltd’). Please be reminded that you are solely responsible for the trading decisions on your account. There is a very high degree of risk involved in trading. Any information and/or content is intended entirely for research, educational and informational purposes only and does not constitute investment or consultation advice or investment strategy. The information is not tailored to the investment needs of any specific person and therefore does not involve a consideration of any of the investment objectives, financial situation or needs of any viewer that may receive it. Kindly also note that past performance is not a reliable indicator of future results. Actual results may differ materially from those anticipated in forward-looking or past performance statements. We assume no liability as to the accuracy or completeness of any of the information and/or content provided herein and the Company cannot be held responsible for any omission, mistake nor for any loss or damage including without limitation to any loss of profit which may arise from reliance on any information supplied by TFA Global Pte Ltd.
The speaker(s) is neither an employee, agent nor representative of Tradu and is therefore acting independently. The opinions given are their own, constitute general market commentary, and do not constitute the opinion or advice of Tradu or any form of personal or investment advice. Tradu neither endorses nor guarantees offerings of third-party speakers, nor is Tradu responsible for the content, veracity or opinions of third-party speakers, presenters or participants.
LTCUSD

Litecoin Approaches $104 ResistanceFenzoFx—Litecoin's uptrend from $93.35 continued, reaching $100.00.
Price is now targeting the $103.00–$104.00 resistance zone, where selling pressure may emerge. A pullback to $98.00 is possible if the level holds. Traders should watch for bearish signals during the NY session.
Trade LTC/USD with FenzoFx, Low Spread, No Commission, No Swap.

LtcusdLitecoin is currently trading at $95.84, testing resistance near $97.22. A breakout above this level could target $100, while support is seen around $92.65. Monitoring key levels for potential opportunities.

LTC Started the Bullish Move We Were ExpectingFenzoFx—Litecoin is holding strong at the $93.35 support, fueling a new bullish wave. Bears tested this level in the last session, but it remained intact.
As long as LTC stays above $93.35, the next target is $100.12, with potential for $102.95 if buying pressure increases.
>>> Trade LTC swap free at FenzoFx.

LTC Once Again Presents a Buying Opportunity for ScalpersFenzoFx—Litecoin once again is testing the $93.0 resistance area, while the price has been below the 50-period simple moving average. This level hasn't been fully tested; therefore, if it holds, LTC will likely rise toward the $100.0 resistance.
Please note that a new bearish wave toward $88.0 could develop if LTC/USD dips and stabilizes below the aforementioned support area.
Litecoin H4 | Falling toward a pullback supportLitecoin (LTCUSD) is falling towards a pullback support and could potentially bounce off this level to climb higher.
Buy entry is at 92.64 which is a pullback support that aligns with the 50.0% Fibonacci retracement.
Stop loss is at 86.50 which is a level that lies underneath a swing-low support.
Take profit is at 101.86 which is a swing-high resistance.
High Risk Investment Warning
Trading Forex/CFDs on margin carries a high level of risk and may not be suitable for all investors. Leverage can work against you.
Stratos Markets Limited (tradu.com):
CFDs are complex instruments and come with a high risk of losing money rapidly due to leverage. 63% of retail investor accounts lose money when trading CFDs with this provider. You should consider whether you understand how CFDs work and whether you can afford to take the high risk of losing your money.
Stratos Europe Ltd (tradu.com):
CFDs are complex instruments and come with a high risk of losing money rapidly due to leverage. 63% of retail investor accounts lose money when trading CFDs with this provider. You should consider whether you understand how CFDs work and whether you can afford to take the high risk of losing your money.
Stratos Global LLC (tradu.com):
Losses can exceed deposits.
Please be advised that the information presented on TradingView is provided to Tradu (‘Company’, ‘we’) by a third-party provider (‘TFA Global Pte Ltd’). Please be reminded that you are solely responsible for the trading decisions on your account. There is a very high degree of risk involved in trading. Any information and/or content is intended entirely for research, educational and informational purposes only and does not constitute investment or consultation advice or investment strategy. The information is not tailored to the investment needs of any specific person and therefore does not involve a consideration of any of the investment objectives, financial situation or needs of any viewer that may receive it. Kindly also note that past performance is not a reliable indicator of future results. Actual results may differ materially from those anticipated in forward-looking or past performance statements. We assume no liability as to the accuracy or completeness of any of the information and/or content provided herein and the Company cannot be held responsible for any omission, mistake nor for any loss or damage including without limitation to any loss of profit which may arise from reliance on any information supplied by TFA Global Pte Ltd.
The speaker(s) is neither an employee, agent nor representative of Tradu and is therefore acting independently. The opinions given are their own, constitute general market commentary, and do not constitute the opinion or advice of Tradu or any form of personal or investment advice. Tradu neither endorses nor guarantees offerings of third-party speakers, nor is Tradu responsible for the content, veracity or opinions of third-party speakers, presenters or participants.

LTC Short & LongI am calling this trade on 05/19/2025. Looking at my markups you will see both short and long term entries and exit opportunities as we buy low and sell high.
#LTCUSD
#NextBigTrade
update coming soon after 50 PIP profit.

LTCUSDT 1D Analysis LTC ~ 1D Analysis
#LTC Buy after successfully breaking this resistance line or buy when retesting this support block with a short term target of at least 10%+.

Litecoin: The Bullish Cycle Starts Now!Huge difference between Litecoin and Ethereum. Litecoin can be seen truly trading at bottom prices. It would be an understatement to say that it is still early.
Why the market isn't likely to drop?
Because we are already at the bottom, from the bottom we grow.
Why is the market very likely to move up?
Because we are seeing price action happening low-near support, from the bottom we grow.
Look at May 2021. The All-Time High.
From the top, a bear market develops.
When the bearish cycle hits bottom the market goes sideways until the next bullish cycle starts.
So Litecoin has been sideways since June 2022, the bear market bottom. All this time is a long-term consolidation period. From this still bottom we grow.
Litecoin is preparing for a new bull market, something like 2021.
Be ready for growth. (A new All-Time High is possible!)
Namaste.

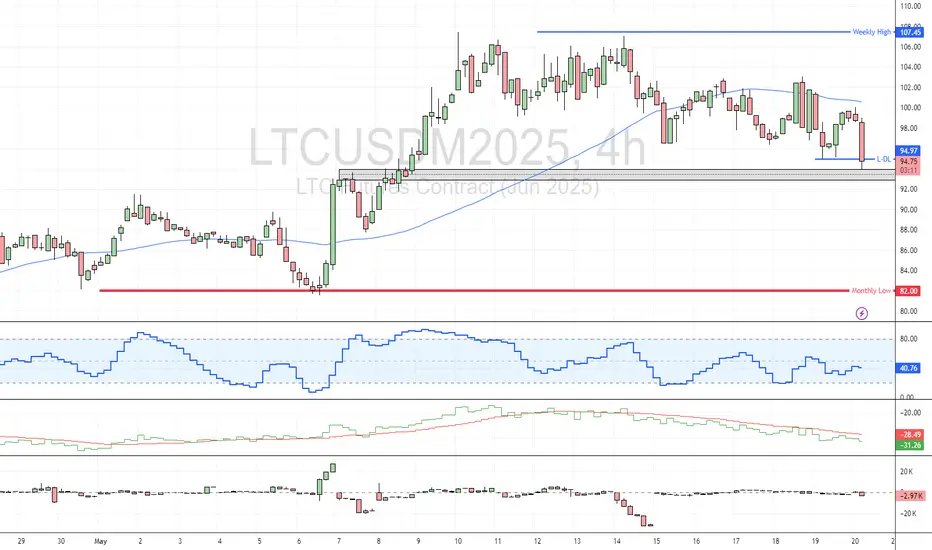
Litecoin H1 | Swing-low support at 61.8% Fibonacci retracementLitecoin is falling towards a swing-low support and could potentially bounce off this level to climb higher.
Buy entry is at 97.47 which is a swing-low support that aligns with the 61.8% Fibonacci retracement.
Stop loss is at 94.80 which is a level that lies underneath a multi-swing-low support and the 38.2% Fibonacci retracement.
Take profit is at 104.78 which is a multi-swing-high resistance.
High Risk Investment Warning
Trading Forex/CFDs on margin carries a high level of risk and may not be suitable for all investors. Leverage can work against you.
Stratos Markets Limited (tradu.com):
CFDs are complex instruments and come with a high risk of losing money rapidly due to leverage. 63% of retail investor accounts lose money when trading CFDs with this provider. You should consider whether you understand how CFDs work and whether you can afford to take the high risk of losing your money.
Stratos Europe Ltd (tradu.com):
CFDs are complex instruments and come with a high risk of losing money rapidly due to leverage. 63% of retail investor accounts lose money when trading CFDs with this provider. You should consider whether you understand how CFDs work and whether you can afford to take the high risk of losing your money.
Stratos Global LLC (tradu.com):
Losses can exceed deposits.
Please be advised that the information presented on TradingView is provided to Tradu (‘Company’, ‘we’) by a third-party provider (‘TFA Global Pte Ltd’). Please be reminded that you are solely responsible for the trading decisions on your account. There is a very high degree of risk involved in trading. Any information and/or content is intended entirely for research, educational and informational purposes only and does not constitute investment or consultation advice or investment strategy. The information is not tailored to the investment needs of any specific person and therefore does not involve a consideration of any of the investment objectives, financial situation or needs of any viewer that may receive it. Kindly also note that past performance is not a reliable indicator of future results. Actual results may differ materially from those anticipated in forward-looking or past performance statements. We assume no liability as to the accuracy or completeness of any of the information and/or content provided herein and the Company cannot be held responsible for any omission, mistake nor for any loss or damage including without limitation to any loss of profit which may arise from reliance on any information supplied by TFA Global Pte Ltd.
The speaker(s) is neither an employee, agent nor representative of Tradu and is therefore acting independently. The opinions given are their own, constitute general market commentary, and do not constitute the opinion or advice of Tradu or any form of personal or investment advice. Tradu neither endorses nor guarantees offerings of third-party speakers, nor is Tradu responsible for the content, veracity or opinions of third-party speakers, presenters or participants.

LTC/USDT 1-Hour Chart – Symmetrical Triangle Alert! Litecoin is gearing up for a big move on the 1-hour chart!
We’ve got a textbook Symmetrical Triangle forming, with LTCUSDT squeezing tighter and tighter between converging trendlines. The price is now approaching the upper resistance of the triangle around $104. This setup is screaming breakout potential!
If LTC clears the triangle’s resistance, we could see a strong push toward the $111.01 target — a key resistance level to watch. On the flip side, if it fails to break out, the $92.16 level (now potential support) will be critical to hold. Volatility is coming, and I’m ready for it — are you? Let’s see if Litecoin can spark a rally!
Key Levels to Watch:
Support: $92.16 (previous resistance, now support)
Resistance: $104 (triangle upper boundary)
Target: $111.01 and $125 (next major resistances)
What’s your take, traders? Are we breaking out or pulling back? Drop your thoughts below!

LITCOIN SIGNALSHello dears
You see that after a good growth, the price was in a range and then we had a decline until the support area was identified, which is also a good area and it was able to record a new ceiling, which is a good sign. Now the best and least risky thing is to buy steps.
We have identified the buying steps for you and the targets...
Note that this analysis is in daily time and may take a while, so if you are not patient, do not enter.
*Trade safely with us*

LTC/USD Tests Critical Resistance LevelFenzoFx—Litecoin is testing the supply zone, highlighted in the 1-hour chart. The primary trend is bullish, as the price is above the 50-period simple moving average.
However, the price action techniques show that sellers exist in the resistance area, which expands from \$105.0 to \$107.0. Therefore, going long is risky at this price, since it is expensive.
That said, if the immediate resistance at \$107.0 holds, LTC/USD will likely dip toward \$100.0, aligning with yesterday's low.

Valuable Demand Zone Amid Weak Market ConditionsLTCUSDT Analysis: Valuable Demand Zone Amid Weak Market Conditions
I believe the blue box in LTCUSDT is highly valuable as a demand zone. Given the overall market conditions are not strong , I’ve identified a lower entry point that aligns with more favorable risk-reward scenarios.
This blue box stands out due to its significance from multiple perspectives . I used heatmap , cumulative volume delta (CVD) , and volume footprint techniques to accurately define this zone as a potential buyer area.
Key Points:
Market Conditions: Currently weak, favoring conservative entry levels.
Blue Box: A carefully identified high-value demand zone.
Techniques Used: Heatmap, CVD, and volume footprint for precise demand mapping.
If you'd like to learn how I use these advanced techniques to define accurate demand zones, just DM me!
If you think this analysis helps you, please don't forget to boost and comment on this. These motivate me to share more insights with you!
I keep my charts clean and simple because I believe clarity leads to better decisions.
My approach is built on years of experience and a solid track record. I don’t claim to know it all, but I’m confident in my ability to spot high-probability setups.
If you would like to learn how to use the heatmap, cumulative volume delta and volume footprint techniques that I use below to determine very accurate demand regions, you can send me a private message. I help anyone who wants it completely free of charge.
My Previous Analysis
🐶 DOGEUSDT.P: Next Move
🎨 RENDERUSDT.P: Opportunity of the Month
💎 ETHUSDT.P: Where to Retrace
🟢 BNBUSDT.P: Potential Surge
📊 BTC Dominance: Reaction Zone
🌊 WAVESUSDT.P: Demand Zone Potential
🟣 UNIUSDT.P: Long-Term Trade
🔵 XRPUSDT.P: Entry Zones
🔗 LINKUSDT.P: Follow The River
📈 BTCUSDT.P: Two Key Demand Zones
🟩 POLUSDT: Bullish Momentum
🌟 PENDLEUSDT.P: Where Opportunity Meets Precision
🔥 BTCUSDT.P: Liquidation of Highly Leveraged Longs
🌊 SOLUSDT.P: SOL's Dip - Your Opportunity
🐸 1000PEPEUSDT.P: Prime Bounce Zone Unlocked
🚀 ETHUSDT.P: Set to Explode - Don't Miss This Game Changer
🤖 IQUSDT: Smart Plan
⚡️ PONDUSDT: A Trade Not Taken Is Better Than a Losing One
💼 STMXUSDT: 2 Buying Areas
🐢 TURBOUSDT: Buy Zones and Buyer Presence
🌍 ICPUSDT.P: Massive Upside Potential | Check the Trade Update For Seeing Results
🟠 IDEXUSDT: Spot Buy Area | %26 Profit if You Trade with MSB
📌 USUALUSDT: Buyers Are Active + %70 Profit in Total
🌟 FORTHUSDT: Sniper Entry +%26 Reaction
🐳 QKCUSDT: Sniper Entry +%57 Reaction
I stopped adding to the list because it's kinda tiring to add 5-10 charts in every move but you can check my profile and see that it goes on..

LTC Mid Term Analysis As far as I can see, Litecoin is still moving within a wide channel that has remained reliable for years.
If you ignore the volatility and short-term fractals, Litecoin has consistently provided profits to early investors who were patient enough to wait.
Before this summer, I anticipate that LTC will reach at least $100 to $106.
The main target should be much higher, but predicting the future is a bit more difficult at the moment.
Due to new U.S. policies and other fundamental events, the target price should be kept at moderate levels for now.

The LTC Bullish case to $10k and why it can happen this Bull RunEveryone is ignoring LTC, Digital Silver.
If we are to look at the network hash for Litecoin and where it was during the previous seasons peak, Jan 2018 and May 2021, we can see the network has was at 100TH and ~210TH in 2021..
We are currently at 2.3 - 2.5 PH, that is 12-25x previous values during the Price top in the last 2 bull runs.
Looking at the NVM (Network Value Model) for Litecoin, we can notice the network has constantly grown while the price is now pretty much unchanged and at the same level as 4 or 7 years ago.
Lastly if we are to look at the BTCLTC and LTCBTC chart, both are displaying a clear picture, it's Litecoin's time to shine and show why it is called Digital Silver and Bitcoin Digital Gold..
Litecoin is valued at 0.1 of BTC based on previous charts and ATH, that easily puts Litecoin at the 5 digits range, tehnically Litecoin can surge to 430 - 700x, time will tell if we go to $20-30k or more, it also depends where Bitcoin will meet it's peak this run. Will it be $150-190k or $250-490k??
This will dicated Alts top and of course Litecoins too.
Let's not forget that ETH was $70-90 in 2017-2018, it did not stop it going to EUROTLX:4K and it will not stop it from moving now into 5 digits, Litecoin can and will do the same.
It's a solid network, there are a ton of miners, tehnically it's in a 5 year Triangle and breaking out, we are going to see ETF listings for LTC soon, news will start to pile and retail will want to buy the cheaper Bitcoin, the one with real and actual Payment Utility!
Let's see where we are in 3 months and end of this Year.
I am predicting we teleport to $300-500 sooner rather than later!

LTCUSD INTRADAY bullish breakout supported at 927.00The LTC/USD pair maintains a bullish overall sentiment, underpinned by a sustained upward trend.
Key Levels:
Support: 927.00 (primary), followed by 904.06 and 880.00
Resistance: 1,100.00, with extended targets at 1.130.00 and 1,150.00
A corrective dip toward the key support zone at 927.00 could offer a bullish rebound opportunity. A successful bounce from this level would reinforce the uptrend and pave the way for a test of the 1,100 resistance. A breakout above this level may open the door to further gains toward 1,130 and 1,150 over the longer term.
Conversely, a decisive break and daily close below 927.00 would invalidate the bullish setup, potentially triggering a deeper pullback toward the 904.06 and 880.00 support levels.
Conclusion:
While the broader trend remains bullish, LTC/USD is currently consolidating. Traders should watch the 927.00 support closely—its defence may confirm trend continuation, while a breakdown could signal a short-term bearish reversal.
This communication is for informational purposes only and should not be viewed as any form of recommendation as to a particular course of action or as investment advice. It is not intended as an offer or solicitation for the purchase or sale of any financial instrument or as an official confirmation of any transaction. Opinions, estimates and assumptions expressed herein are made as of the date of this communication and are subject to change without notice. This communication has been prepared based upon information, including market prices, data and other information, believed to be reliable; however, Trade Nation does not warrant its completeness or accuracy. All market prices and market data contained in or attached to this communication are indicative and subject to change without notice.

LTC Faced Resistance: What's Coming is InterestingFenzoFx—Litecoin faced resistance at $93.55 and has started consolidating below this level. Despite the pullback, the market remains bullish, with the price holding above the VWAP and 50-SMA.
Support is at $91.20, and resistance remains at $93.55. A sustained move above support could push the price toward $96.60.
Bearish Scenario: If Litecoin drops and stabilizes below $91.20, momentum may weaken further, targeting the next support at $89.30.

Litecoin Consolidates: Wait for This Before BuyingFenzoFx—Litecoin surged from $80.0 as anticipated. A candlestick pattern signaled this move yesterday morning. Although the bullish wave broke above the $91.9 resistance, the uptrend has since paused. Currently, the price trades slightly below this level, consolidating gains.
In swing trading, the key rule is to buy at the dip and sell at the high. Thus, we are not entering at this stage. Notably, the LTC/USD 1-hour chart shows a long-wick bearish candlestick, confirmed by another bearish close, with a decline in volume.
The trend stays bullish above the 50-period simple moving average. With immediate resistance at $93.65, the bearish momentum may test the previous day's high at $89.5. If this support holds, the uptrend could resume toward the $96.7 target.

The key is whether there is support near 95.73
Hello, traders.
If you "Follow", you can always get new information quickly.
Please also click "Boost".
Have a nice day today.
-------------------------------------
(LTCUSDT 1D chart)
The key is whether the price can be maintained above the M-Signal indicator on the 1M chart.
Accordingly, the key is whether there is support near 95.73.
If it fails to rise, you should check whether there is support near 79.84.
In order for the stepwise uptrend to begin, it is likely to start by rising above 113.39.
If you are trading LTC, you should check whether there is support near 95.73 and create a trading strategy.
-
Thank you for reading to the end.
I hope you have a successful trade.
--------------------------------------------------
- Here is an explanation of the big picture.
I used TradingView's INDEX chart to check the entire range of BTC.
I rewrote it to update the previous chart while touching the Fibonacci ratio range of 1.902(101875.70) ~ 2(106275.10).
(Previous BTCUSD 12M chart)
Looking at the big picture, it seems to have been following a pattern since 2015.
In other words, it is a pattern that maintains a 3-year bull market and faces a 1-year bear market.
Accordingly, the bull market is expected to continue until 2025.
-
(Current BTCUSD 12M chart)
Based on the currently written Fibonacci ratio, it is displayed up to 3.618 (178910.15).
It is expected that it will not fall again below the Fibonacci ratio of 0.618 (44234.54).
(BTCUSDT 12M chart)
Based on the BTCUSDT chart, I think it is around 42283.58.
-
I will explain it again with the BTCUSD chart.
The Fibonacci ratio ranges marked in the green boxes, 1.902 (101875.70) ~ 2 (106275.10) and 3 (151166.97) ~ 3.14 (157451.83), are expected to be important support and resistance ranges.
In other words, it seems likely that they will act as volume profile ranges.
Therefore, in order to break through these ranges upward, I think the point to watch is whether they can receive support and rise near the Fibonacci ratios of 1.618 (89126.41) and 2.618 (134018.28).
Therefore, the maximum rising range in 2025 is expected to be the 3 (151166.97) ~ 3.14 (157451.83) range.
In order to do that, we need to see if it is supported and rises near 2.618 (134018.28).
If it falls after the bull market in 2025, we don't know how far it will fall, but based on the previous decline, we expect it to fall by about -60% to -70%.
Therefore, if it starts to fall near the Fibonacci ratio 3.14 (157451.83), it seems likely that it will fall to around Fibonacci 0.618 (44234.54).
I will explain more details when the bear market starts.
------------------------------------------------------

LTCUSD INTRADAY supported at 809.00LTC/USD shows a bullish price action sentiment, supported by a sustained upward trend. Recent intraday activity indicates sideways consolidation, hinting at potential accumulation before a breakout.
Key Levels:
Support: 809 (primary), followed by 777, and 738
Resistance: 938, with extended targets at 963 and 1000
The 809 level remains the key pivot and prior consolidation zone. A pullback to this level, followed by a bullish rebound, would reinforce the current trend and open the path toward resistance at 938, with potential extensions to 963 and 1000 over the longer term.
Alternatively, a confirmed break and daily close below 809 would invalidate the bullish outlook, signalling the risk of a deeper correction. In this scenario, support levels to watch include 800, followed by 777 and 738.
Conclusion:
LTC/USD is currently consolidating within a broader bullish trend. Holding above the 809 support level is critical for continued upward momentum. A breakdown below this level would shift focus to lower support zones and suggest increased downside pressure.
This communication is for informational purposes only and should not be viewed as any form of recommendation as to a particular course of action or as investment advice. It is not intended as an offer or solicitation for the purchase or sale of any financial instrument or as an official confirmation of any transaction. Opinions, estimates and assumptions expressed herein are made as of the date of this communication and are subject to change without notice. This communication has been prepared based upon information, including market prices, data and other information, believed to be reliable; however, Trade Nation does not warrant its completeness or accuracy. All market prices and market data contained in or attached to this communication are indicative and subject to change without notice.

Litecoin Invites BuyersFenzoFx — Litecoin has extended its decline from $89.5 to a key support at $81.5, the April 30 low. Strong selling pressure pushed the Stochastic Oscillator below 20, signaling oversold conditions.
Support at $80.8 could pause the downtrend, potentially leading to a rebound toward $85.5.
Bearish Scenario: If LTC/USD closes below $80.80, the decline may continue toward $79.80.
>>> Prop Trading
>>> No Deposit Bonus
>>> %100 Deposit Bonus
>>> Forex Analysis Contest
All at FenzoFx Decentralized Forex Broker

LTCUSD INTRADAY uptrend supported at 840LTC/USD shows a bullish price action sentiment, supported by a sustained upward trend. Recent intraday activity indicates sideways consolidation, hinting at potential accumulation before a breakout.
Key Levels:
Support: 840 (primary), followed by 800, 777, and 738
Resistance: 938, with extended targets at 963 and 1000
The 840 level remains the key pivot and prior consolidation zone. A pullback to this level, followed by a bullish rebound, would reinforce the current trend and open the path toward resistance at 938, with potential extensions to 963 and 1000 over the longer term.
Alternatively, a confirmed break and daily close below 840 would invalidate the bullish outlook, signalling the risk of a deeper correction. In this scenario, support levels to watch include 800, followed by 777 and 738.
Conclusion:
LTC/USD is currently consolidating within a broader bullish trend. Holding above the 840 support level is critical for continued upward momentum. A breakdown below this level would shift focus to lower support zones and suggest increased downside pressure.
This communication is for informational purposes only and should not be viewed as any form of recommendation as to a particular course of action or as investment advice. It is not intended as an offer or solicitation for the purchase or sale of any financial instrument or as an official confirmation of any transaction. Opinions, estimates and assumptions expressed herein are made as of the date of this communication and are subject to change without notice. This communication has been prepared based upon information, including market prices, data and other information, believed to be reliable; however, Trade Nation does not warrant its completeness or accuracy. All market prices and market data contained in or attached to this communication are indicative and subject to change without notice.
