LTC short to 203
1) The five-wave Elliott wave series started on December 10th at $75 and ended at 337 on Apr 17th giving a good 4-month run-up in a beautiful 5 wave series, here are few confirmations why I think this is a 5 wave series:
a) Wave 1 started low at $70
b) Wave 2 is a zig-zag correction of W1 at 61.8% correction at $119
c) Wave 3 extended a little over 100% of Wave 1 to $246
d) Wave 4 is a zig-zag correction but sine Wave 2 is a longer correction, Wave 4 is a shorter correction ending around $153
e) Since Wave 1 & Wave 3 are short waves, Wave 5 is extended to 100% of the distance between the start of Wave 1 & Wave 3 i.e.(246-71=175) so Wave 5 started from $153 and went up by another $175 so total $153+$175=$328 (FIB 100% extension)
2) So, now we know that the perfect 5 wave Elliott series completed, what's next? I think it's going to be a BIG CORRECTIVE WAVE for the whole 5-wave series. Corrective waves are of three types Zig-zag, flat, and triangle correction, and the retracement can be at the following levels also touching the bottom of the long-term monthly channel coming from December 2020 :
a) FIB 38.2% - $234
b) FIB 50% - $202
c) FIB 61.8% - $171
e) FIB 78.6% - $125
I personally think that the market will retrace back to FIB 50% retracement at $202 before it picks back up again.
Appreciate everyone's feedback, happy trading
Ltcusdforecast

LTC/USD LONG SET UP (HODL)LTC/USD lLONG SET UP)
BUY AT- $265.00/ $255.00/ $245.00
SL $230.00
TP.1- $300.00
TP.2- $325.00
TP.3- $350.00
TP.4- $375.00
Support: $265.00/ $255.00/ $245.00
Resistance: $300.00/ $325.00/ $350.00/ $375.00

LTCUSD - LONG- patiently acquiring positions HODL!
Movement will come, direction is waiting for enough positions to take it off or will come down to
see if there is positions left to take liquidity wise. "Patience is Key"
Most probable chance is a a buy limit at 208-215.
Best of luck Traders!
Comments are welcome! Have your say.

LTC/USD LONG SET UP Title/(Date): LTC/USD LONG SET UP
Asset:CRYPTO
Symbol: LTC/USD
Order Type: Market execution/BUY LIMIT
Time Frame:1D
Entry Price 1: $196.50 (ACTIVE)
Entry Price 2: $186.50 (Pending)
Stop Loss: $176.50 (200 Pips)
Take Profit 1: $216.50 (200 Pips)
Take Profit 2: $236.50 (400 Pips)
Take Profit 3: $256.50 (600 Pips)
Take Profit 4: $276.50 (800 Pips)
Take Profit 5:$296.50 (1,000 Pips)
Status: 🚨Pending🚨

LTCUSDT 4H-TIMEFRAME ANALYSIS✨LTCUSDT 4H-TIMEFRAME ANALYSIS✨
Hello ladies and gentlemen
This is my new idea for Litecoin LTCUSDT
I expect the price to move higher...
I hope my idea is clear
Support me by like and share
Stay Safe💯
Good luck💰

LTC - 2h. Buyers kept the growth trend!Despite the sharp drop in LTC prices provoked by BT C, the price range is important $126-131 withstood the blow.
The price of LTC remained in the white growth channel. The sellers tried to break through this range at high volumes. After the formation of a false breakdown , buyers seized the initiative.
If the local fall wave is complete, the price should not fall below the range of $126-131 today. This signal will allow you to make a short-term trade with a target of $150 .
The current wave of fall has reached the first target of our previous idea. In addition, the preliminary idea has a global LTC growth target. If you haven't viewed it - click on the link below :
_____________________
We create both short-term ideas (for a local understanding of the market situation) and medium-term forecasts of price movements.
Subscribe to us and get daily concise analytics!

LITECOIN Parabolic move - Will it reach 330.00 level (.786 Fibo)LITECOIN
On December 2017 year end Litecoin has visited the high level around 430.00 And seen a rapid selling from that level and the earlier 2000% gains were wiped out entirely and it has started its upward journey In 2018 December as we can see
the cycle repeats itself during the year end as its pumped around 500% which is a 25% of the previous year end jump.
And from January month onwards its again started to falling towards 25.00 level. And we can see that 25.00 level has acted as strong support for the bull. Since end of 2019 this level has not breached and bear failed at this level.
From October 2020 the parabolic move has stared and its still running and its has managed to reach 2019 high level which is 145.00 level and even LTCUSD has managed to break this level and the retest has also happened and went above the .382 Fibonacci retracement level. The next major key testing ground was 0.50 Fibonacci level comes around 220.00.
From this level we can see a profit taking scenario might happen and we can expect short term fall back towards 0.382 Fibonacci. If that happened it would be a nice buying opportunity.
The 50,100,200 EMA's are acting as good support for the bull and Ichimoku cloud is also supporting the bullish trend . In Bollinger band it has reached around upper side of the band short term fall back towards middle band was expected.
Disclaimer!
This is not a financial advice

Litecoin- Bearish Triangle is formingLTCUSD
After reaching the 69.00 level price felled towards 45.33 and got some minor support and bounced up to 49.50
We can see a triangle formation in a bearish trend which will further triggered the selling of litecoin
In 4hr timeframe head and shoulders pattern is formed and the bullish trend line is also broken on September 02, 2020 with the long bearish candle
The price is just below the 50.00 mark which is a major psychological level and acting as a resistance level. just above at 50.71 the 61.8% Fibonacci level is also acting as a resistance
The next target would be 40.00 which is also a major psychological level and low volume area and profit taking area. At this level we can expect minor rebound of LTCUSD.
Please give us a thumbs up if u like our work and do follow us so that you can get a regular update about upcoming setups and ideas
Disclaimer
It’s not a financial advice. Do the analyze and take a decision.

LTC to see an uptrend! (1 D) | Ichimoku indicating bullish bias Market in last 1 week
-LTCUSD saw sideways movement with rejection from 65
-Price volatility was very high. The market moved ~27.5%, between $65 and $51
Today’s Trend analysis
-LTCUSD expected to see an uptrend as Bollinger Band expands
-Price at time of publishing: $60.28
-XRP’s market cap: $3 Billion
-Oscillator indicators are mostly neutral. RSI at 69 about to reach overbought region.
-Moving average indicators are biased towards an uptrend. Ichimoku Cloud is neutral, the conversion-base line has bullish crossover
-Volume indicators saw a decrease in the volume in last few candles from 133K to 33.06K.
Price expected to see an uptrend as Bollinger Band expands with higher lows being observed in the last few candles. Most of the Oscillator indicators are neutral. MACD histogram is positive, size decreasing in the positive region. RSI at 69, about to enter the overbought region with a upmove. CCI at 88, in the neutral region decreasing downwards from last few candles. Another interesting point to notice here is that Ichimoku Conversion line has crossed over the Base line suggesting a bullish crossover.
----------------------------------------------------------------------------------------
The analysis is based on signals from 28 technical indicators, out of which 17 are moving averages and remaining 11 are oscillators. These indicator values are calculated using 1 D candles.
DM to get details of the above analysis and list of indicator & their values used to arrive at the above conclusion.
Note: Above analysis would hold true if we do not encounter sudden jump in trade volume .
----------------------------------------------------------------------------------------
If you find the analysis useful, please like and share our ideas with the community!
- Mudrex

Litecoin Trade Idea!LTCUSD Trade
You can wait to enter long in support level.
Profit Target 1 : 5%
Profit Target 2 : 10%
for short term you can take a short trade now to gain a 5 % Profit but it will be risky! So better wait to enter long!

LTCUSD (litcoin)looking at lit coin usd i see short sell to $57 before a final push up
check my previous analysis i tagged below and see how they all went as i forecast please follow me for more updates

LTCUSD litcoin congratultions updatefrom our last analysis which i tagged below close to the comment section you will the big sell i forecaster
i will wait for candle formation to update buy or sell


LTCUSD mid term forecastIdea : i think of a scenario that can occur if prices reverse are supported by falling wedge reversal and potential inverted H&S patterns formation
**Disclaimer** the content on this analysis is subject to change at any time without notice, and is provided for the sole purpose of assisting traders to make independent investment decisions.
Traders!! if you like my ideas and do take the same trade like i do, please write it in comment so we can manage the trade together.
_____________________________________________________________________________________________________________________
Thank you for your support ;)
GWBFX

LTCUSD reversed from resistance, potential drop!
LTCUSD reversed off its resistance at 68.78 where it could potentially drop further to 38.14.
Trading CFDs on margin carries high risk.
Losses can exceed the initial investment so please ensure you fully
understand the risks.


LTCUSD Litecoin SHORT 1 HR Bad Day for CrytosHello to all watching my charts.
LTCUSD is in Short mode like ETHUSD also.
Here in LTC Litecoin its in addition
a broken trendline which has been last from 17.10.2019
till now and Litecoin have been sitting up and jumped
up from that line at least minimum 5 times.
If such an important Long trendline is broken there is
something change big coming in short , thats my oppinnion.
If you want to know more about my trading style
please send my a mail.
Good trades
Renkotrade


LTCUSD Market Structure Analysisif you have your market view, please share it in comments
Also, you can ask me questions...
Have a great day everyone!

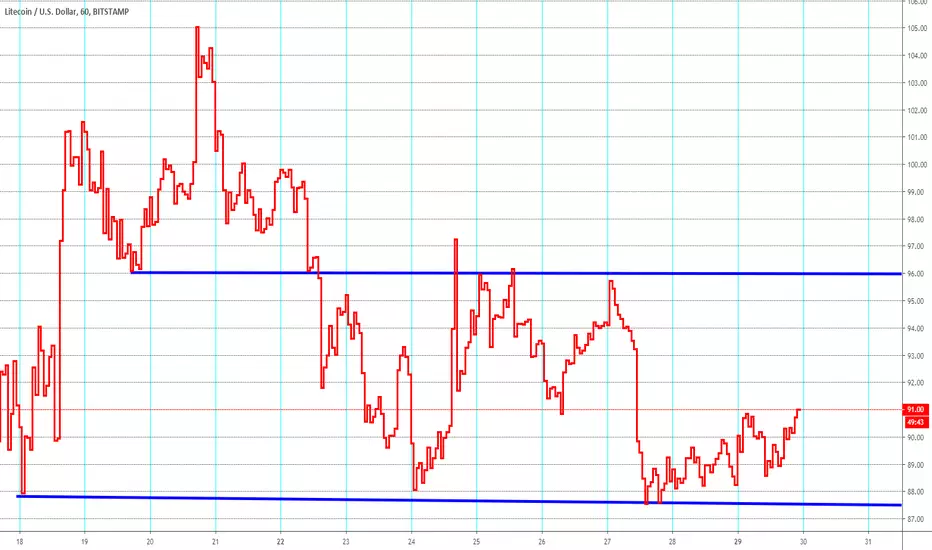
LTUSD Litecoin NEUTRAL in Trading range 1 HR Chart#Litecoin #Bitcoin #Ethereum
Hello to all watching my charts
Litecoin similar to other cryptos is catched in a trading range
between Low Support at
87.50
and High Resistance at
96.00
Only after a breakout in 1 direction above resistance or below support
we are able to analyse a clear status.
At the moment its a Neutral Status
No reason to trade here.
Good trades
If you want to support my charts and my work please like the,,,
Renkotrade
LTCUSD Bear BreakLTCUSD broke bearish after losing support at 89.99 im now sitting all cash waiting for some clear patterns to be established on the 4 hour chart.

Litecoin LONG Today only Pullback 1 HR Chart#Litecoin #Bitcoin #Ethereum #ETHUSD
Hello to all watching my charts
Today we have a normal pullback maybe to the breakout level of the
inverse head and shoulder formation which has beeen stablished and formed
yesterday (Please watch my black line here)
But nothing to worry about at the moment
What is to mention is, the best for long positions
is my black line holds as maximum pullback level down.
If that level will not hold, last exit would be at my blue line level.
Trading below that is critical for long not even short
but than it will be the really really "pay attention time" for longs.
Good trades
If you want to support my work and my trades, please like them..
Renkotrade
