LTC/USD LONG SET UP (HODL)LTC/USD lLONG SET UP)
BUY AT- $265.00/ $255.00/ $245.00
SL $230.00
TP.1- $300.00
TP.2- $325.00
TP.3- $350.00
TP.4- $375.00
Support: $265.00/ $255.00/ $245.00
Resistance: $300.00/ $325.00/ $350.00/ $375.00
Ltcusdidea

Litecoin, LTC - only in that case we'll grow...Litecoin looks not so bad as other coins. Price formed a clear local line. Only in the case, when LTC starts squeezing, I'll wait for a breakout and further growth.
Write in the comments all your questions and instruments analysis of which you want to see.
Friends, push the like button, write a comment, and share with your mates - that would be the best THANK YOU.
P.S. I personally will open entry if the price will show it according to my strategy.
Always make your analysis before a trade

Litecoin briskly and surely aiming for new ATH !Litecoin hit another target of 325! Once it close above the trend line, next target would be 380..


LTC bouncing from the demand zoneLitecoin is bouncing from the demand zone and now trading at the local support zone. This is a good opportunity to add some LTC for the mid-term. LTC has not pumped much like other big caps and a rally is pending.
Buy Zone: $260 - $265 (add more in dips)
Target: $288 - $317 - $344 - $382 - $424 - $478 - $514 - $565 - $620 (will touch $1000 in long term)

LTCUSD - RealityThe reality of this coin is that complete liquidation from the whales is not over yet. We are creating key structure to the left which at some point will need to get purged before we shoot for a new high.

LTC 1D Pattern "Cup with a handle" or continued growth?We would like to bring to your attention a global idea on the chart of the LTCUSDT pair
This instrument has a long history of trading and makes it possible to see how this pair has been trading since mid-2013.
In our opinion, the price of LTCUSDT is approaching the critical level of $285, in the area of which one of two scenarios may begin to be realized:
1) It can be assumed that the global pattern Cup with a handle is forming on the chart. In this case, having reached $285, the price may start a rather deep downward correction.
A tasty buying area for an investment long can be considered $90-125
2) In case of breaking through $285 upwards, and consolidation from above this level, we can consider the scenario of a powerful rocket to the moon.
First, ATH breaks of $365-370, and then you can start the dream of growth to $785
Still, in 2014-2016, LTC was called silver, which will go right after the gold BTC, but then ETH appeared and something went wrong ...)
To the pluses of the 2nd scenario, you can add what we see on the LTCBTC chart
(It's a pity that the BTC-e exchange no longer exists, it had the longest trading history)
So, on the chart, there are weekly candles, and they have been moving downward in a clear channel for the last year. They were close to refresh the all-time low but received a strong upward momentum.
In case of a possible breakout upward and the continuation of the movement along a given vector, we can expect another +100%, because it is there that the first powerful liquid zone is located.
Well, let's see if "there is life in the old dog yet" named Litecoin
Will it be able to at least partially repeat the growth trajectory as in 2017, when LTCUSD made x100-x200 from $2-4 to $370 in a year.
_______________________________
Since 2016, we have been analyzing and trading the cryptocurrency market.
We transform our knowledge, trading moods and experience into ideas. Each "like under the idea" boosts the level of our happiness by 0.05% . If we help you to be calmer and richer - help us to be happier :)

LTCUSD BIG POTENTIAL BUY/LONG INCOMING!Technical Analysis
1. Pennant Pattern Breakout
2. Waiting for the pullback before we re-enter to reach 340.00 which is at Fibonacci Expansion 1.618 Take Profit Zone
3. Fibonacci Retracement and 1st Take Profit has been completed.
4. Waiting for Fibonacci Expansion 2nd Take Profit
Note, should there be consolidation at Fibonacci Level 1 (Grey Zone) we will prepare for a push up without the pullback
The entry point for the pullback is at 205.65 and Take Profit at 340.00

Litecoin, LTC/USDT - go go goThe coin has been forming a triangle for over 2 months. I like to trade it. I expect for entry point after retest. Keep in mind this coin.
Write in the comments all your questions and instruments analysis of which you want to see.
Friends, push the like button, write a comment, and share with your mates - that would be the best THANK YOU.
P.S. I personally will open entry if the price will show it according to my strategy.
Always make your analysis before a trade

#LTCUSD Continuation of the triangle break expectedAfter a super health breakout, it is possible a retracement and a continuation of the uptrend

LTCUSD to break out: A Comparison With BTC in October 2020So how do you draw horizontal lines while trading Crypto?
I cannot stress enough on the importance of VPVR when drawing support and resistances. Here I present and example using BTC:
In 2020, most people were showing 14000 (2019 top) and 20000 (2017 top) to be areas of resistance. TA and patterns only work if the assumption behind those TA systems and patterns are valid. If those price actions had very little volume, you cannot really trust them. IN REALITY, very few people trade at the very top of a bubble. If you imagine a line of FOMOers, at these tops it’s the very last people in the line who are buying. Hence these regions NEVER hold as resistances. Check the previous ATH levels for BTC, BTC blasted through every one of them. NOW if you look at VPVR, the “real top” as far as volume is concerned was 12.4k. It was game on after it broke above this level. THIS is true price discovery.
For LTC, this level is 250 USD. LTC spent very little time above this level for the price action to be meaningful. As a result, LTC has been chopping ever since it came close to 250 USD. This is a key long term price region when analyzed on the ultra long term idea that I posted earlier (and I will keep updating).
Bottomline: IF you are a LTC HODLER, please for the love of GOD don’t sell at previous high once we break above this last zone of resistance. Price should reach between 500-700 USD (1.236-1.618 on fib levels) on bullish momentum.
For ultra long term cycle charts on LTC, follow my related chart ideas below.

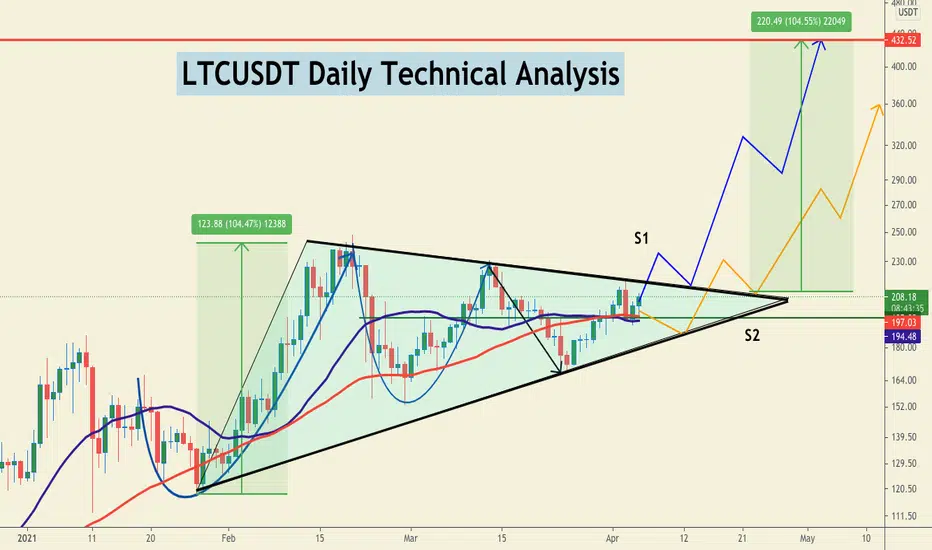
#LTC/USDT looks ready for $400!Welcome to this quick update.
LTC is trading above $208 while I am writing this update.
Every single coin is up a minimum of 3x to almost 100x! Like WRX!
LTC is ready for the breakout, I am expecting either a direct breakout from this level which is scenario 1, or a retest of the $187 level which will possibly be the last opportunity to buy LTC under $200 shown as in Scenario 2 in my chart.
I believe accumulating $LTC at any level around $200 could be highly profitable for you.
Not financial advice Please DYOR )
Do hit the like button if you like my setups and Follow me for more future updates and highly profitable setups.
#PEACE
Litecoin crossed first hurdle. On it's way to 272Nice close above the trend line. Now once it closes above the box, it should be on it's way to ATH, with possible intermediate pauses at 272, 325 ...

Triangle patternFirst of all, I apologize for not being able to update the analysis due to personal issues.
In the daily chart, the first target of the uptrend can be around $ 526.
In the 240-minute chart over review, a Triangle Pattern is under formation, of which it could have ended in this point or it could have extended up to the $ 177 range in the e-wave, and then the ascending movement begins.
We can get the main confirmation for the uptrend, when the price crossing the range of $ 217

LTCUSDT Symmetric triangle formationLTCUSDT (Day CHART) Technical Analysis Update
Waiting for the Symmetric Triangle Breakout
LTC/USDT currently trading at $203
Buy-level: Above $215 (only buy if the 4H candle closes above the symmetric triangle)
Stop loss: We will update once we see the breakout
Target 1: $240
Target 2: $275
Target 3: $300
Target 4: $350
Max Leverage: 3X
ALWAYS KEEP STOP LOSS...
Follow Our Tradingview Account for More Technical Analysis Updates, | Like, Share and Comment Your thoughts.

LTC may test 180 - 165 support then to $500as we cans see the short resistance black line which litecoin failed to break it 3 times.
a daily red engulfing candle has closed below the black resistance line..
it will be amazing opportunity to catch any ltc between 180 -165
once a daily candle close below 160 ... we can say at that time that we are bearish
but till the moment we r completely bullish and $500 - $1000 is coming !

believe or not .... LTC TO $1000 in that caseLTC shows strong bullish ascending channel so far and strong support , faced resistance $250 before n wouldn't able to break it .
once we close a week candle above $370 so we can predict $1000 easily
Please click Like button and Appreciate my hard work.
Must follow me for latest crypto real time updates.
Thank you.

LTC/USD analyshere we have triangle pattern which is going to be completed.
this pattern can belong to D1 time frame.
please comment your own idea i will be happy to know them. COINBASE:LTCUSD

💡LTC: BUY Trade🚀🚀🚀🚀🚀🚀 #ALTSEASON2021📈#LTCUSDT
➡️Entry: 163$
🎯Target 1: 190$
🎯Target 2: 205$
🎯Target 3: 225$


Ascending H&S I hope this doesn't pan out, but this isn't a good sign for the bulls. Could indicate a breakdown to sub 100s


LTCUSD H&S FormationNO trade until confirmation.
👇 Follow for more daily forex content and education 💪
Good luck to you!
Don't forget to like and share, it really helps.
Stay tuned.
This is just an idea, not financial advice.
