LtcUsd outlook- Sell ralliesLitecoin is writing a different story than Bitcoin.
With sellers defending 50 zone very well I would expect a drop for this cryptocurrency and I will look for selling opportunities around 49 with a 42.50 target.
I will remain bearish as long as the price is under 50.
Ltcusdidea

LITECOIN-Battle between active and shadow area🎉 Please give us a thumbs up if u like our work and do follow us so that you can get a regular update about upcoming setups and ideas
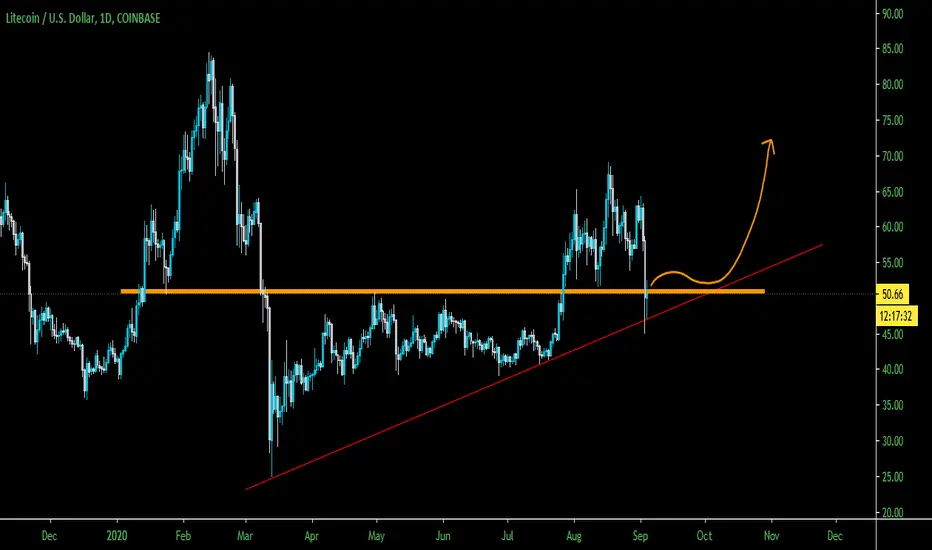
LTCUSD
Is trading within a triangle pattern and its about to break the triangle pattern in coming days as in recent days most of the crypto currencies are trading within a confined range. LTCUSD is currently trading above the.382 Fibonacci level and around key price action level where we can expect some resistance to the bull.
50.305 area is acted as both support and resistance for the past 08 months. If the bull want to remain in control it has to broke the key price action level.
If its happened then the next upside swing target would be around 64.00 is the place where we can see a previous left and right shoulder pattern was formed in the august month.
During the initial period of pandemic it has seen a massive sell off due to the lost in market confidence and the investors flew in to safety. From March 13 LITECOIN is in uptrend after this period the bear cannot take control.
If the Key price action level was broken then the next upside hurdle would be a .50 Fibonacci retracement level comes around 54.140.If LTCUSD managed to bruise through the shadow area we can expect massive upside or downside rally. But the current market condition is supporting the bullish rally
💌 Leave your valuable comments and suggestions related to this idea in the comment section.
Thanks for your time. Good day guys 💝

LITECOIN is trading within a falling channelLTCUSD
Is currently trading within a downward channel and the price action suggests that the upward momentum is slowing and we can expect sudden drop like one previously happened.
In longer timeframe Head and shoulder pattern is formed and felled towards 42.00 level
If the price move below the current level then the expected target level will be around 40.00
Please give us a thumbs up if u like our work and do follow us so that you can get a regular update about upcoming setups and ideas

LTC LONGLTC USDT TA ✌ 🤲
Invest 50% At Current Price
Another Entry Will Be At Lower Support If Price Comes At Dip
Hit The Like Button & Appreciate My Hard Work
Sell At Upper Resistance

Litecoin- Bearish Triangle is formingLTCUSD
After reaching the 69.00 level price felled towards 45.33 and got some minor support and bounced up to 49.50
We can see a triangle formation in a bearish trend which will further triggered the selling of litecoin
In 4hr timeframe head and shoulders pattern is formed and the bullish trend line is also broken on September 02, 2020 with the long bearish candle
The price is just below the 50.00 mark which is a major psychological level and acting as a resistance level. just above at 50.71 the 61.8% Fibonacci level is also acting as a resistance
The next target would be 40.00 which is also a major psychological level and low volume area and profit taking area. At this level we can expect minor rebound of LTCUSD.
Please give us a thumbs up if u like our work and do follow us so that you can get a regular update about upcoming setups and ideas
Disclaimer
It’s not a financial advice. Do the analyze and take a decision.

Cryptocurrency LITECOIN buy signals on D1.Litecoin (LTC/USD), D1: Support line + Hammers & Spinning Tops + Hidden divergence

Litcoin Trading SetupPrice is holding lower trend line support on daily , we are good as long as we hold this trend line.
closing above orange line is really good for long
For Funsies LTCEh why not nothing to prove so a little wyckoff prediction Could it really hit into single digits? meehhhh Long then short than long then short THAN LOOONNGGG lol

Litecoin massive buy signalLitecoin big buy signal
A huge bullish divergence can be observed on the weekly chart
I believe this is the last test and breakout of the symmetrical triangle that has formed.


LTCUSDt AnalysisHello friends.
Please support my work by clicking the LIKE button(If you liked).Thank you!
Everything on the chart.
until we are higher than 42.5 we're bullish
targets: 53 - 55 - 57
after first target reached move ur stop to breakeven
stop: under 42.5 (depending of ur risk). ALWAYS follow ur RM .
Good luck
Follow me on TRADING View, if you don't want to miss my next analysis or signals.
It's not financial advice.
Dont Forget, always make your own research before to trade my ideas! If i help you to earn some money i will RLY VERYVERY appreciate for your donate.
Open to your questions or suggestions(PM to me).

LTC|USDHello, everyone. Thanks for reading.
You can buy, risk reward is good.
Thanks for reading
Dont foreget to leave a like if you liked my idea

LTC|USD Hello, everyone. Thanks for reading.
You can buy, risk reward is good.
Thanks for reading
Dont foreget to leave a like if you liked my idea


Litecoin Trade Idea!LTCUSD Trade
You can wait to enter long in support level.
Profit Target 1 : 5%
Profit Target 2 : 10%
for short term you can take a short trade now to gain a 5 % Profit but it will be risky! So better wait to enter long!

LTC/USD - looks shorts.Signs of shorts position:
- Maximum downshifting.
- EMAs are showing a downtrend.
- AO shows a falling trend.
- RSi is in a bearish trend.
- Strong resistance 43$
Canceling the short position, going over $43 level.
Push ❤️ if you think this is a useful idea!
Before to trade my ideas make your own analysis.
Thanks for your support!


LTC/USD - Pattern head & shoulder. Pattern head shoulders.
It's worth waiting for the neck to break.
Or a neck break from the neck level.
Looking for an entry point.
Canceling the pattern out of the $46 level.
Push ❤️ if you think this is a useful idea!
Before to trade my ideas make your own analysis.
Thanks for your support!

LTCUSDt AnalysisHello friends.
Please support my work by clicking the LIKE button(If you liked).Thank you!
Everything on the chart.
chart looking bullish
U can open a long-pos on a broken channel retest
Targets: 48$ - 54$ - 60$
(after first target will reached move ur stop to breakeven)
growth cancellation if we rollback and consolidation below 42$
Follow me on TRADING View, if you don't want to miss my next analysis or signals.
Good luck.
It's not financial advice.
Dont Forget, always make your own research before to trade my ideas! If i help you to earn some money i will RLY VERYVERY appreciate for your donate.
Also open to your questions or suggestions(PM to me).Will be glad earn some money for me and you.

LTC/USDHI
LTC/USD has reached its resistance line and will fall to the bottom of the specified arrow
This is the best time to trade.
I hope you enjoy this analysis.

LTCusd SIGNAL (long)Everything on the chart.
buy: market
stop 42.5
2 targets zone: 48 and 50
after reaching the first target, move the stop-loss to breakeven
Please support my work by clicking the LIKE button and following the Trading View profile.Thank you!
Dont Forget, always make your own research before to trade my ideas! If i help you to earn some money i will RLY VERYVERY appreciate for your donate. Also open to your suggestions.
