LITECOIN-Battle between active and shadow area🎉 Please give us a thumbs up if u like our work and do follow us so that you can get a regular update about upcoming setups and ideas
LTCUSD
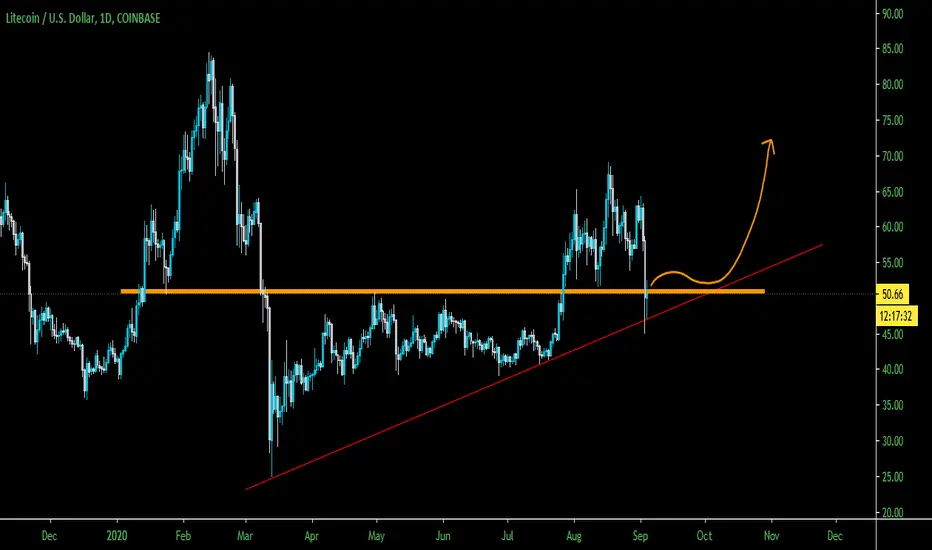
Is trading within a triangle pattern and its about to break the triangle pattern in coming days as in recent days most of the crypto currencies are trading within a confined range. LTCUSD is currently trading above the.382 Fibonacci level and around key price action level where we can expect some resistance to the bull.
50.305 area is acted as both support and resistance for the past 08 months. If the bull want to remain in control it has to broke the key price action level.
If its happened then the next upside swing target would be around 64.00 is the place where we can see a previous left and right shoulder pattern was formed in the august month.
During the initial period of pandemic it has seen a massive sell off due to the lost in market confidence and the investors flew in to safety. From March 13 LITECOIN is in uptrend after this period the bear cannot take control.
If the Key price action level was broken then the next upside hurdle would be a .50 Fibonacci retracement level comes around 54.140.If LTCUSD managed to bruise through the shadow area we can expect massive upside or downside rally. But the current market condition is supporting the bullish rally
💌 Leave your valuable comments and suggestions related to this idea in the comment section.
Thanks for your time. Good day guys 💝
Ltcusdlong


LTC BULLISH BREAKOUTLTC is currently breaking out of a decending triangle to the upside after consolidating above support. Taking a long here.

LTC LONGLTC USDT TA ✌ 🤲
Invest 50% At Current Price
Another Entry Will Be At Lower Support If Price Comes At Dip
Hit The Like Button & Appreciate My Hard Work
Sell At Upper Resistance

Cryptocurrency LITECOIN buy signals on D1.Litecoin (LTC/USD), D1: Support line + Hammers & Spinning Tops + Hidden divergence


Litcoin Trading SetupPrice is holding lower trend line support on daily , we are good as long as we hold this trend line.
closing above orange line is really good for long
LITECOIN BREAKOUT LONG| trading plan
LITECOIN IS BULLISH ANS HAS BROKEN A RESISTANCE, WAIT FOR CONFIRMATION AND SHORT ON PULLBACK|
X IF the candle closes above the level>>
X Wait for pullback>>>
X Go long
X SL below the resistance
X Targets on the chart
LIKE and SUBSCRIBE for LUCK!

LTCLTC possible slow and steady grind. might stall out in 80 dolla range...
The Content is for informational and entertainment purposes only, you should not construe any such information or other material as legal, tax, investment, financial, or other advice. This is not financial advice nor am I a financial adviser. :)

rocketbombquickidea LITECOIN 🔥Hello, dear friends! 🧡
Continue my hashtag #rocketbombquickidea for you🔥🔥
If you like such format of my quick analyzes, support idea with like. I'll try to find more opportunities for making 💰
Always in touch with you🧡
Sincerely Your Rocket Bomb🚀💣

Looks like it was a C and not a 3 on LTCAll i can see is :
A = C
Daily bearish divergence
Clean 5 waves count in C
Perfect channel hit.

Litecoin massive buy signalLitecoin big buy signal
A huge bullish divergence can be observed on the weekly chart
I believe this is the last test and breakout of the symmetrical triangle that has formed.

LTC breaks monthly/yearly downtrendAs you can see on the MACD, LTC has reversed its monthly course and broken out officially. There’s also a golden cross. LTC could lose 10% short term but I think we’ll see the 80s possibly sooner rather than later and then from there who knows? Bull market. Anything can happen...


LTC / USD are looking good here. Other alts seem to be hurtingLitecoin is looking strong while other alts are starting to look weak in comparison .

LTC going to $80LTC is showing strong signs with price and volume that it wants to push to $80 range.

$260 + by the end of 2021Keep this graph on your wall. You will make good money at most by the end of 2021. Keep long positions

LTCUSD just broke out if its long term downtrendLTCUSD
Just broke out of its long term downtrend on the weekly TF, great long term long opportunity IMO.
We’ve broken and retested previous resistance
Massive bullish volume
HH & HL’s
And with BTC and ETH pushing up to all time highs, LTC is sure to follow. Multiple take profit levels from a potential 53% to 500% if we get back to where we were in 2018!
I’m now looking for a pullback to hopefully around $51 to get my entry but my do staggered entries between $51-$56 and will hold this until at least the first target of $79 for a potential 30% minimum gain.


LTCUSD: Good opportunity for LongAt D1, the cloud is directing upward, indicating an uptrend. The RSI moved down to the level of 50 and the price found support on the Ichimoku cloud.
At H4, the cloud is directing downward, indicating a price correction at the D1 timeframe. Besides, you can see how the Falling Wedge Pattern is being formed and RSI is at the oversold level, which indicates the weakness of sellers.
We recommend buying LTCUSDT at the end of the Falling Wedge Pattern (near the 50% Fibonacci level) and take the profit near the level of 68.

LITECOIN TO $1,000- Litecoin could easily see minimum $1000 in the next 4 years
- The future support will $370-420
- Litecoin will shoot up up any time soon, once it does, it will not see 40s and 50s again for accumlation
- Lowest line once broken, will at least hit the 3rd line from top
- If Litecoin moons today and hits target line, then its $700, but this wont happen today, so it will be +$1000
This is long term and the lines proves, and if you don't believe it you're just delusional and still hating on "ded" coin.
See you later!

