LTCBTC BUY zoneHi Guys!)
Take a look on LTC. It is in good BUY zone. Especially it was not showing good growth on LTCUSDT chart yet. I think it has good growth potential.
If you compare two charts LTCBTC and LTCUSDT you can see that it always had good bull run in LTCUSDT after it was in BUY zone LTCBTC. For example compare price on two date in chart on 26 dec 2019 and 11 dec 2018 and action after this dates.
On LTCUSDT chart we also near BUY ZONE.
Anyway think your own head and decide what to do!) Trade in profit!
Ltcusdlong

Litecoin/Bitcoin Potential Major Bottom (LTC)This is the double bottom I mentioned in the last post as you can see it settling on the red support and green support.
Overall the btc pair looks really good.
My main confirmation is when I start to see the 3day and weekly start to show signs of green for a long term hold.
I wouldn't blame you if you got very aggressive around here for a long term hold.
Just need to see that trend change and support hold as we approach it.
Have an awesome day!

Litecoin Playing Games. (LTC)The best buy signal will be when we break the downward green Resistance. That's where we get interested for long term as the weekly is starting to show a turnaround to the upside but still very early and not green yet.
We cracked the red upward support and now have bounced into an area where Resistance sits from old support.
Has wiggle room to go around 54$ but it would have to move along the Resistance to get there.
If all S&R holds it might be possible to see a drop to the $23-$25 previous low level.
If you pull up ltcbtc you will notice that we have a potential double bottom but currently formed under Resistance.
I say place buy limit in mid 20s in case of a drop. See if we can build some accumulation
Will update on the weekly close as btc pair approaches this double bottom on btc pair
Not aggressive on this one just yet.
Let it breathe.
Have an awesome day!

LTCusd SIGNAL (long)Everything on the chart.
buy: market
stop 42.5
2 targets zone: 48 and 50
after reaching the first target, move the stop-loss to breakeven
Please support my work by clicking the LIKE button and following the Trading View profile.Thank you!
Dont Forget, always make your own research before to trade my ideas! If i help you to earn some money i will RLY VERYVERY appreciate for your donate. Also open to your suggestions.

LTCUSD - INTRADAY - 20. APR. 2020Welcome to our daily trade setup ( LTCUSD )!
-
1 HOUR
Price moving above our main sr level.
4 HOUR
Overall bullish market in a small pullback right now.
OVERALL
Expecting some more pressure shortly, good long entries!
-
CRYPTO INTRADAY
BUY LTCUSD
ENTRY LEVEL @ 43.610 $
SL @ 41.560 $
TP @ 44.100 $
Max Risk. 0.5% - 1%!
(Remember to add a few pips to all levels - different Brokers!)
Leave us a comment or like to keep our content for free and alive.
Have a great week everyone!
ALAN

#LTC/USD Clean Targets, $38 or $50?I will keep it simple as the chart is quite clear to you.
We're currently trading under a falling wedge channel and the green line is a very important support level.
If we can hold this support I expect $50 as the target. If it breaks then we an expect $38 and then a 20% rally towards $50.
Please hit that like button if you think it's helpful.
Stay tuned for more updates.
#Peace

LTCusdt local movement (LONG)Everyting on the chart. 2 scenarios but both long.
locally we are moving in the channel, 2 areas for profit taking, I would fix most part of the deal in the area of ~48$ coz it's may be complexity correction. If we go to area ~52-54$ on my estimation an impulse will be confirmed, there we fix the rest of the position and wait for the correction of the whole movement.
Hello everyone, almost year ago i have lost my deposit(almost 8btc and i'm still broke w/o deposit and job,I can’t do my favorite thing.) and now i'm trying to get back to the market. If i help you to earn some money i will RLY VERYVERY THANKFULL for your donate. Also open to your suggestions.

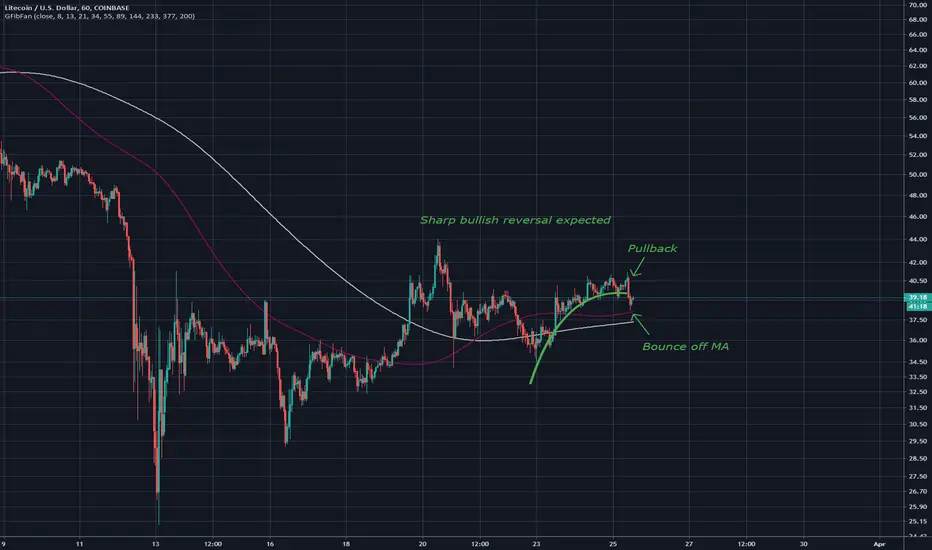
Litecoin in an uptrend channelLitecoin has been beaten by Zcash lately so I am hoping for a revenge rally. Long the bottom of the channel and that is where we are at now. If channel breaks I'll cut. Good Luck!

Some more litecoinAs you can see LTCUSD pair has formed an inverted ascending scallop formation against the resistance of the fibonacci spiral, broken out, formed a falling wedge and attempted to break out again. I believe this is the pullback before a larger rise, hence the C target. On the LTCBTC pair you can see the TopCap indicator showing the value of the pair at its peak, which increases as each day passes.

Low probability, high reward, low risk LTC / USD set upShort term resistance level on the 1D has been hit and has acted as support, with the 25 MA also adding support at the same level. There has been a large sell of recently of LTC / USD and one would expect a bounce here. A trend of repeated higher lows also adds confluence and a level of support, so a bounce seems imminent. There are no strong resistance levels near to this level, so the potential upside may be larger than the first level indicated. Entering Trade here.

Litecoin, Catch the Move!Best place ever you can catch to Buy Litecoin is the Range between 25-35 dollars per one LTC. I believe the bottom we will have in a few days. It's a strong and stable Cryptocurrency with a bright future! Invest now, take profit later.

Litecoin USD - downward wedge Hello
I look formed a shape of a descending wedge. and also stand above local support $ 40.9
I am waiting for a flat or accumulation inside the figure, and will leave the top to the resistance zone 43-44
This is just my opinion, and is not a call to action)
Looks good? Leave a like, share and leave a comment.
Thanks for visiting.

LTCUSD forming bullish Shark | A good long opportunity aheadFormation of new Shark pattern:
On short term hourly chart the price action of Litecoin is forming bullish harmonic Shark pattern and soon it will be entered in potential reversal zone.
Buying And Sell Targets:
The buying and sell targets according to harmonic Shark pattern should be:
Buy between: $41.14 to $40.69
Sell between: $41.66 to $42.70
Stop Loss:
The potential reversal zone area which is up to $40.69 can be used as stop loss in case of complete candle sticks closes below this level.
Possible profit and loss ratio:
As per above targets this trade has the profit possibility of 4.93% and as per above mentioned stop loss, the loss possibility is 1.1%.
Note: This idea is education purpose only and not intended to be investment advice, please seek a duly licensed professional and do you own research before any investment.

Litecoin's rise to $80Some interesting movements can be seen when LTC moved to $80
Can be seen to be rejected consistently at EMA levels, only to recover
Also can be seen to be moving in timeseries, parabolic move
This can be attributed to the formation of an inverse H&S

How far will LTCM20 PUMP..... Wave 3 elliot waves incoming ??11% PUSH TO FIRST TARGET 0.00619 (Fib extension 161.8)
20% PUSH TO SECOND TARGET 0.007189 (Fib extension 261.8)

Next Target for LTC $69.50Simple chart explains that if LTC is to visit the Fib retracement of 0.618, the next price target should be around $69.50 before making a decision.
I will remain long for LTC after this pop.
Considering the bullish market sentiment and recent BAKKT announcement that the will start trading BTC from September, I think these strong alts should bounce hard.

Litecoin long term downtrend brokenNot using the log chart for once we can see that the a long term downtrend for litecoin has broken with the formation of a recent descending scallop. Great entry point for longs. Linking my log chart which consists of symmetrical triangles.

LTCUSD has completed bullish setup for big bullish rallyA powerful bullish signal 2nd time appeared in history of LTC:
In June 2016 there was first time in the history of Litecoin the 50 simple moving average crossed up the 100 simple moving average on weekly chart. And this golden cross produced really very powerful bullish rally upto 8000%. This year in Feb 2020 second time in the history we have received the same strong bullish signals that the 50 SMA has formed the golden cross with 100 simple moving average but there is some difference between the both golden crosses. When the 50 simple moving average formed the golden cross with 100 SMA in 2016 at that time this cross was formed beneath the price action therefore the candlesticks did not have the resistance of 50 and 100 simple moving averages above them. But this time the golden cross has been formed above the candlestick therefore we the priceline had a very strong resistance of these two moving averages and eventually the price action could not break out this resistance level and dropped down again. But there is a very strong positive sign that so far the 50 moving average did not form a death cross with the 100 simple moving average and both simple moving averages are moving sideways. But if the 50 SMA will again form a death cross with 100 simple moving average then it cannot produce very strong bearish trend because the distance between the both moving averages is very low. If 50 SMA would be coming from the long distance and form the death cross with the 100 simple moving average then it could produce very disasters bearish rally.
In 2016 the golden cross formed beneath the candlesticks
Current golden cross formed above the candlesticks and working as resistance
Second strong bullish signal:
There is another very strong bullish signal is appeared on very long term monthly chart. And that is the priceline of Lite Coin is hitting at 50 simple moving average support second time in the history of LTC. Even though this month we have is very strong long bearish candlestick but if we see the momentum indicator then it is still turning bullish and ignoring this bearish trend. And the stochastic has given bull cross from very close to oversold zone area.
Before this the price action has touched the 50 simple moving average on this monthly chart in December 2018 and after that we have witnessed a very strong bullish rally up to 563%. Therefore if price action will be able to cross up the resistance of 50 and 100 simple moving averages on weekly chart then we can witness same kind of bullish rally again.
A big descending triangle:
Now I am switching back to the weekly chart. And here we can see that the price line of LTC is moving in a descending triangle. The price action was entered in this triangle on May 2017 and at this time we can observe that the price line has reached very close to the support of this triangle and moving up now. If we more closely observe the priceline then it can be clearly seen that this time the priceline is not able to hit at the support even though it was moved very close to the support. And the reason is that when the priceline had hit the support in the past at that time the Bollinger bands was also at the support of the triangle but at this time the bollinger bands is above the triangle and there is distance between the bollinger bands and the triangle support. Therefore the bollinger bands has stopped the price action to reach up to the support. I've also placed the volume profile on the complete price action moving within this triangle and as a result we can see that the trader’s interest is up to the support and that is bit critical but the point of control of this volume profile is at $61.5. Therefore tere are strong chances that soon the priceline will be pulled back to the POC level of the volume profile. After that there are also chances that priceline will again make another attempt to break out the resistance of the triangle. We can also see that at this time the triangle is quite squeezed and the movement of the price line is also getting quite narrowed and this is the decision making for the Litecoin’s priceline whether it has to break down or break out.
Formation of harmonic Crab a bullish reversal signal:
If we switch to the smaller time period 2 day chart then it can be clearly examined that at the support of this descending triangle the priceline has formed a bullish Crab pattern. The priceline has just hit the spike in the potential reversal zone of this Crab pattern and turned back and entered in the Fibonacci projection area of A to D leg between 0.382 to 0.786 Fib projection. But I am expecting that this pattern will be helpful for the price line to move up even the priceline can cross up the 0.786 Fibonacci protection level. And once it will be able to cross up the 0.786 Fib projection then it can use this level as support and make a powerful attempt to have a break out from the descending triangle’s resistance.
Conclusion:
All indicators chart parent and signals are in favour of bulls rather bears. Therefore there are less chances that priceline will break down the support of the descending triangle. So we should be ready for big profit gains.
But the support of triangle should be used as stop loss because if this support will be broken down then there can be power bearish move.
Note: This idea is education purpose only and not intended to be investment advise, please seek a duly licensed professional and do you own research before any investment.

Litecoin intraday ascending scallopAscending scallop, after a small pullback in this pattern formation a strong bullish movement upwards should be seen. Hourly chart. Happy trading!
LTC does not care about CORONA VIRUS Marty boots here trading the LTC pump
Crypto does not care about corona or the stock market
Crypto is leading the stock market and gold and silver in teh commodities section

LTC LONG TERM BUYDear Gamblers,
I am expecting one leg down still, but LTC looks to me ready to buy on the long term. There is a triangle forming on the larger timeframes and in my opinon is an asset way oversold with actual fundamentals to be used. I will not go leveraged instead i will buy on spot market.
If in the coming weeks, ltc does not reach this point, i will reasses.
If in the coming weeks, ltc crosses the 17 stop loss limit, i will reasses. (Note that will mean that the triangle did not play out).
This is not a trading strategy, rather, this is actual investing for 1 to 2 years.
STRATEGY
LIMIT BUY @ 25.30 USD
MANUAL STOP @17 USD
Positioning 20%
Thanks a lot for reading,
Happy trading,
BeniGo.
***I am not your financial advisor neither I intend to be, do you own research before risking your money***

LTCUSD forming bullish Crab | For a big bullish moveHi Folks hope you are well, here I have found another profit potential trading idea and this time on 2 day chart the Lite coin (LTC) is forming bullish Crab pattern, we need some more drop and then soon it will be entered in potential reversal zone to move up.
Let’s dig this pattern deeper to examine how perfect this pattern is formed:
After initial leg (X to A) the A to B leg is retraced between 0.328 to 0.618 Fibonacci and then B to C leg is projected between 0.382 to 0.886 of A to B Fibonacci projection area and last leg (C to D) should be retraced between 1.27 to 161.8 Fibonacci then the priceline will be ready to take bullish or upwards move.
Buying And Sell Targets:
The buying and sell targets according to harmonic Crab pattern should be:
Buy between: $22.75 to $5.83
Sell between: $35.88 to $67.63
So this trade has up to 162% big profit possibility.
Stop Loss:
The potential reversal zone area can be used as stop loss in case of complete candle stick closes below this level.
Note: This idea is education purpose only and not intended to be investment advise, please seek a duly licensed professional and do you own research before any investment.

LTCUSDT 30% GainLitecoin is at the crucial supportzone of 46$-49$ Zone.
The recent Swing low from 83$ to 47$ was 78.60% retracement of the last Swing high.
If litecoin stays above this support zone between 46$-49$ and the horizontal trend support line for more than one day. We can buy or initiate a long position from this zone.
