Will Litecoin find support at current levels?Litecoin - 24h expiry - We look to Buy at 90.01 (stop at 87.81)
Daily signals are bullish.
The sequence for trading is higher highs and lows.
The previous swing low is located at 87.98.
Preferred trade is to buy on dips.
50 1day EMA is at 90.08.
Bespoke support is located at 90.
Our profit targets will be 95.51 and 96.51
Resistance: 95.00 / 97.50 / 100.00
Support: 93.50 / 92.00 / 90.00
Please be advised that the information presented on TradingView is provided to Vantage (‘Vantage Global Limited’, ‘we’) by a third-party provider (‘Signal Centre’). Please be reminded that you are solely responsible for the trading decisions on your account. There is a very high degree of risk involved in trading. Any information and/or content is intended entirely for research, educational and informational purposes only and does not constitute investment or consultation advice or investment strategy. The information is not tailored to the investment needs of any specific person and therefore does not involve a consideration of any of the investment objectives, financial situation or needs of any viewer that may receive it. Kindly also note that past performance is not a reliable indicator of future results. Actual results may differ materially from those anticipated in forward-looking or past performance statements. We assume no liability as to the accuracy or completeness of any of the information and/or content provided herein and the Company cannot be held responsible for any omission, mistake nor for any loss or damage including without limitation to any loss of profit which may arise from reliance on any information supplied by Signal Centre.
Ltcusdlong

LTC looks good Now i have A B C These are possible scenarios.
what's your expected scenario from ABC?
please comment
check my previous Ideas.
NOTE: this is not a financial advice.

LTC : INCREASE VIEWLTC seems one of the interesting coins that show a volume range from June 2022, and until now in 2023 it still gains.
interesting to see if it's able to gain new levels and to increase to first target of $122

Litecoin update #LTCLitecoin (LTC) is a cryptocurrency that was designed to provide fast, secure and low-cost payments by leveraging the unique properties of blockchain technology.

LITECOIN LTC price is preparing for continued growthToday we will bring to your attention the medium-term trade LTCUSDT and something more, read to the end!)
Entry $69.1
Stop $60.23
Take profit $95.74
Profit/Loss ratio 3/1
Since the Fed will announce a new rate today, we expect increased volatility in the market, so we are putting the entry order of trade well below the current price.
This trade fits into the logic of the LTC price movement, which we described in our global idea a few months ago.
In general, the Litecoin price was one of the first to show quite good growth, outpacing even the growth of BTC
One of the reasons for the rapid growth of the LTCUSD price may be the fact that LTC halving occurs about six months earlier than BTC halving, although they occur on the same mined block. In 2023-2024, everyone is waiting for the mined block #840000
As you can see on the chart above, the BTCUSDT price has a powerful and long-lasting upward trend immediately after "halving".
The price of LTCUSDT, on the contrary, after "halving", goes into a stage of long-term correction. But after rapid growth, the LTC price reaches its maximum value 6-7 weeks before the planned "halving".
Therefore, we can assume that in the medium term, the LTCUSDT price will reach its high in June 2023.
We will publish our updates on Litecoin from time to time and if you are interested in this cryptocurrency, then put a like under the idea, write a comment and subscribe to us. And you will always be promptly informed about possible price changes.
_____________________
Did you like our analysis? Leave a comment, like, and follow to get more

LITECOIN USD (LTCUSD) 1W Trading Analisys (TA)1W Chart, LTCUSD , on January 25, 2023, the signals on MACD already crossed north from below the histogram, after piercing on July 2022; The RSI signal bounced on 50 and is now facing NE staying steady over 60 after the price has been steadly climbing since the beginning of the year, from $78 to $87, piercing up the 100 days MA signal, at this moment there is still plenty of room for the price to test from below the 200 days MA signal by $120, which is the optimistic approach, but remember "In this business if you're good, you're right six times out of ten. You're never going to be right nine times out of ten. I've found that when the market's going down and you buy funds wisely, at some point in the future you will be happy. You won't get there by reading: "Now is the time to buy". Today this ticker has a Volume of 455M with a Market Cap of 6.3M.
Good Luck!
Gráfico 1W, LTCUSD , el 25 de enero de 2023, las señales en MACD ya cruzaron hacia el norte por debajo del histograma, después de perforar en julio de 2022; La señal RSI rebotó en 50 y ahora se enfrenta al NE manteniéndose estable sobre 60 después de que el precio ha estado subiendo constantemente desde principios de año, de $78 a $87, perforando la señal MA de 100 días, en este momento todavía hay mucho espacio para que el precio pruebe por debajo de la señal MA de 200 días en $120, que es el enfoque optimista, pero recuerda: "En este negocio, si eres bueno, tienes razón seis de cada diez veces. Nunca vas a tener razón nueve de cada diez veces. Descubrí que cuando el mercado está bajando y usted compra fondos sabiamente, en algún momento en el futuro será feliz. No llegará allí leyendo: "Ahora es el momento de comprar". Hoy este ticker tiene un Volumen de 455M con una Capitalización de Mercado de 6.3M.
¡Buena suerte!
“I believe in analysis and not forecasting.” / "Creo en el análisis y no en el pronóstico".
REMEMBER : I am not a financial adviser nor is any content in this article presented as financial advice. The information provided in this blog post and any other posts that I make and any accompanying material is for informational purposes only. It should not be considered financial or investment advice of any kind. One should consult with a financial or investment professional to determine what may be best for your individual needs. RECUERDE : No soy un asesor financiero y el contenido de este artículo no se presenta como asesoramiento financiero. La información provista en esta publicación de blog y cualquier otra publicación que haga y cualquier material que la acompañe es solo para fines informativos. No debe considerarse asesoramiento financiero o de inversión de ningún tipo. Se debe consultar con un profesional financiero o de inversiones para determinar qué es lo mejor para sus necesidades individuales.

Litecoin heading to its fair value against Bitcoin?This chart shows the Master Litecoin Network Value Model.

LTC/USDT :: buyers have enough power ?!LTC/USDT :::
If the price is sufficiently supported in this range, it can easily break the channel and turn its ceiling into a strong support for itself, and if it cannot break it, it will move to the middle line again, and then again will try to break the channel .
<<<< Analyze simply with The_Best_Trader_1991 >>>>

LTC/USDT :: enters the range of $100 .LTC/USDT :::
The price is in the downward channel and touched its bottom some time ago, but the support line has played its role well and has led the price upwards.
Maybe it will return to the support line {blue line}, but the main target is the $100 range.

$LTC #LTC | LTF LONGGreen box and EQ might be worked as a support level .
The bottom of the green box, liquidity zone and around 88.97 will be the points I will observe as resistance.
With the loss of 77.95 (1H) , the first bounce of the price will be around 75.88 .
I wish everyone a good week.

LiteCoin LONGthink this will be one of the safest trades of the 1st half of 2023
-Litecoin halving Aug 2023. Price has a history of rising up to halving (see prior $LTC and $BTC halvings)
-Will be looking to TP between $150-$250

Litecoin TurtleLitecoin is the slowest coin to grow.
After the whole market rises, it wakes up and starts to overtake everyone.
He is like a turtle, from the cartoon "The Tortoise and the Hare", and no matter how fast the hare is, the turtle will reach the finish line before him.

LtcUSDT - LONGVery strong. Halving this year.
Good reclaims.
Looking to TP 80 and above.
Levels on chart.
80 - 84 - 94 - 103 - 107 - 113
If we get the relief rally you will see targets getting hit left and right.
SL - 65

Litecoin to find support at previous resistance?Litecoin - 22h expiry - We look to Buy at 71.01 (stop at 69.14)
Short term bias has turned positive.
20 8hour EMA is at 70.60.
Previous resistance at 71 now becomes support.
We look to buy dips.
Our profit targets will be 75.69 and 76.69
Resistance: 76.34 / 78.00 / 79.50
Support: 74.00 / 71.00 / 70.00
Please be advised that the information presented on TradingView is provided to Vantage (‘Vantage Global Limited’, ‘we’) by a third-party provider (‘Signal Centre’). Please be reminded that you are solely responsible for the trading decisions on your account. There is a very high degree of risk involved in trading. Any information and/or content is intended entirely for research, educational and informational purposes only and does not constitute investment or consultation advice or investment strategy. The information is not tailored to the investment needs of any specific person and therefore does not involve a consideration of any of the investment objectives, financial situation or needs of any viewer that may receive it. Kindly also note that past performance is not a reliable indicator of future results. Actual results may differ materially from those anticipated in forward-looking or past performance statements. We assume no liability as to the accuracy or completeness of any of the information and/or content provided herein and the Company cannot be held responsible for any omission, mistake nor for any loss or damage including without limitation to any loss of profit which may arise from reliance on any information supplied by Signal Centre.

$LTC | Long PositionIf you see some bullish breaker on 1H or below, you may think to open a long position

#LTC/USDT 1DAY UPDATE BY @CRYPTOSANDERS !!Welcome to this quick LTC/USDT analysis.
I have tried my best to bring the best possible outcome in this chart.
Reason for Analysis:-Litecoin (LTC) also rose in today’s session, with the token rebounding from its losses to start the week.
Following a drop to $73.52, which was the lowest level LTC/USD had hit since November 29, the token raced to a high of $79.52 earlier today.
This surge in price sent litecoin to its strongest point since December 7, which is the last time price was above $80.00.
Looking at the chart, today’s bullish momentum comes as the RSI bounced from a floor of 55.50, and it is now nearing a ceiling of 61.50.
This move has also sent the 10-day (red) moving average higher, a day after it appeared to be certainly heading for a downward trend.
What happens on Wednesday with the U.S. Federal Reserve will now dictate how cryptocurrency prices will move during the run-up to the Christmas period.
Remember:-This is not a piece of financial advice. All investment made by me is at my own risk and I am held responsible for my own profit and losses. So, do your own research before investing in this trade.
Hit the like button if you like it and share your charts in the comments section.
Thank you...

FRACTAL: LTC Litecoin LOVES Decembers ⬆Hi Traders, Investors and Speculators 📈📉
Ev here. Been trading crypto since 2017 and later got into stocks. I have 3 board exams on financial markets and studied economics from a top tier university for a year. Daytime job - Math Teacher. 👩🏫
Historically, December is a bullish month for Litecoin, with the price often going parabolic and increasing more than 100 % ! Previously, 4 out of 5 Decembers, the price of LTCUSDT has increased exponentially. A quick look at a fractal that played out during 2020 from this exact support zone that we are currently trading on ($68) shows a whopping 168% increase.
While you're here 👀 Here's a guide to risk reward ratios and how to setup the perfect position :
_______________________
📢Follow us here on TradingView for daily updates and trade ideas on crypto , stocks and commodities 💎Hit like & Follow 👍
We thank you for your support !
CryptoCheck

LTC Litecoin Buy When Breaks Out 20221211Signal: Red -> Green
Context: Green
Waiting for a Breakout
LTC, Litecoin, LTCUSD, LTCUSDT, LTCUSDTPERP, CRYPTO,CRYPTOCURRENCY
DISCLAIMER
This is only a personal opinion and does NOT serve as investing NOR trading advice.
Please make your own decisions and be responsible for your own investing and trading Activities.

LTC Litecoin will pump to 84 USDI bought litecoin here at 67USD, Expecting 84 USD.
Long term target would be more than 800 USD

LTCUSD Is a Good Bet Right NowI saw this in a prior analysis but thought I would elaborate a bit.
The horizontal in 2017 was a period of low volatility, extremely low. But it was a great place to buy. Price pumped to about $300.
The horizontal seen today shows low volatility again, on a grander scale. Can the pump points be compared?
As digital currency enters the mainstream Litecoin will win in this setting.

Litecoin (LTCUSD) Testing 1.5 YR+ Downtrend ResistanceLitecoin is breaking out above a major downtrend resistance connecting the May'21 and Nov'21 highs. The last pre-halving rally began roughly 7 mo before peaking (Jun'19) 2 mo ahead of the Aug'19 halving. If LTCUSD behaves as it did last cycle, w/ the next halving occurring Aug'23, and the pre-halving rally ending ard Jun'23, the 7 mo pre-halving rally has likely begun.
BINANCE:LTCUSD

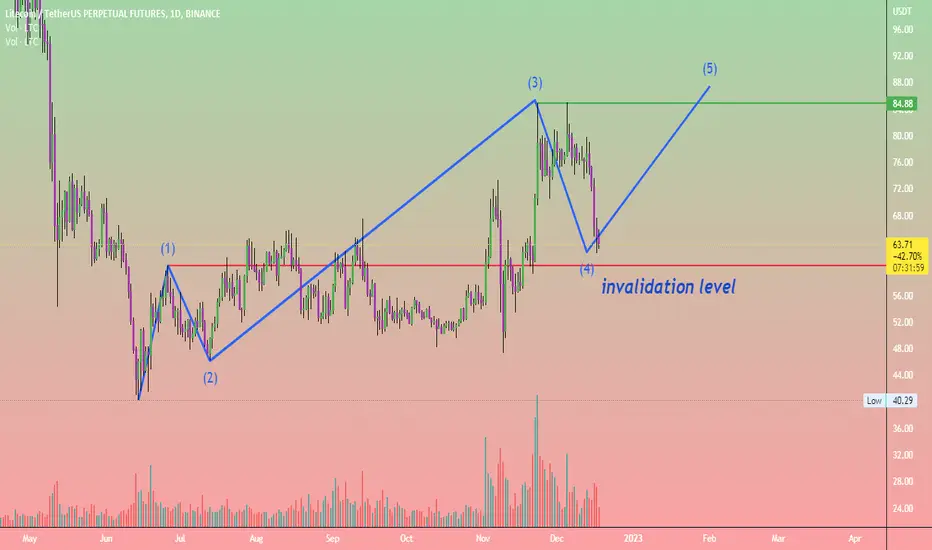
ltcusdtltcusdt is showing strength .It is not following btc .price is in harmony with volume on weekly time frame expecting to form 5 waves on ltc .
NFA DYOR
