LTCUSD approaching resistance, look out for potential reversal!
LTCUSD is approaching its resistance at 79.66 where it is could reverse down to its support at 62.75.
Trading CFDs on margin carries high risk.
Losses can exceed the initial investment so please ensure you fully
understand the risks.
Ltcusdshort

LTCUSD 17/09/2019Hello Traders!
We play with Smartmoney concepts, that means that we look mostly on PA to determine what will happen in future.
As we all know, price is moved by BIG players: Banks, Institutional traders, HFT bots (we call them all of them SM).
They can't play as we do, cause of a HUGE lot sizes, so cause of that they need to SELL to BUY and BUY to SELL for positioning them self in the best possible spot.
If u were learn about trading from free and accessible knowledge, u probably heard about BUYing LOW and SELLing HIGH?
So SM must BUY LOWER and SELL HIGHER :)
We as retail traders are just a small fish in this ocean, so we need to catch the waves which are created by SM.
CHARTS AGENDA:
SM - SMART MONEY
PA - PRICE ACTION
HEC - HIGH ENERGETIC CANDLE (LAST OPPOSITE CANDLE BEFORE MOVE) <- SM MUST SELL TO BUY AND BUY TO SELL :)
BITCOIN SIGN - MONEY POCKET (SL, BUY STOPS, SELL STOPS) - EQH - EQUAL HIGHS / EQL - EQUAL LOWS
BLACK ARROWS ARE ABOVE AND BELOW THESE MONEY SPOTS POINTING FUTURE TARGET
BLUE LINES - ENTRIES WITH SMART MONEY MITIGATION MOVE - SNIPER ENTRY FOR US
BLACK LINES FOOT PRINTS - SPOTS ON CHART WHERE SMART MONEY SHOULD COME BACK TO GET OUT OF THEIR POSITIONS IN DRAWDOWN (SM MUST SELL TO BUY AND BUY TO SELL) - POTENCIAL SNIPER ENTRIES
BLACK BOX - GAP's (IPA - INSUFFICIENT PRICE ACTION) - SPOTS ON CHART WHERE PRICE MOVED TOO FAST, AND LEFT SOME "WHOLES" IN PRICE ACTION WHERE ALGORITHMS WHAT TO COME BACK AND FILL IT BY "HEALTHY" PA.
If u have any questions feel free to ask:)
GOD BLESS U ALL!

LTCUSD reversed from resistance, potential drop!
LTCUSD reversed off its resistance at 71.69 where it could potentially drop further to 62.75.
Trading CFDs on margin carries high risk.
Losses can exceed the initial investment so please ensure you fully
understand the risks.

Ltc short 2019 - 9 - 7.................................................................................................................................................................................................................................................................................................................................................................................................................................................................................................................................................................................................................................................................................... Support me, follow and like

LTCUSD potential reversal!
LTCUSD expected to rise up to 1st resistance at 79.66 where it could potentially react off and drop down to 1st support at 62.75.
Trading CFDs on margin carries high risk.
Losses can exceed the initial investment so please ensure you fully
understand the risks.

LTCUSD potential reversal!
LTCUSD expected to rise up to 1st resistance at 79.66 where it could potentially react off and drop down to 1st support at 62.75.
Trading CFDs on margin carries high risk.
Losses can exceed the initial investment so please ensure you fully
understand the risks.


LTCUSD potential reversal!
LTCUSD expected to rise up to 1st resistance at 79.66 where it could potentially react off and drop down to 1st support at 62.75.
Trading CFDs on margin carries high risk.
Losses can exceed the initial investment so please ensure you fully
understand the risks.

LTCUSD very bullish upswing volume confirmation TP 1 : $73.81
TP2: $78.98
STOP @ $63.98
Set your stop-loss @ the red.
Have a wonderful weekend.
-@a1mtarabichi
Disclaimer
Market volatility makes priceaction subject to change at any moment. Hence the emphasis on ALWAYS SET YOUR STOP LOSSES! don't let your greed get the best of you.

LTCUSD bounced from support, potential for a further rise!
LTCUSD bounced off 62.75 where it could potentially rise further to 79.66.
Trading CFDs on margin carries high risk.
Losses can exceed the initial investment so please ensure you fully
understand the risks.

LTCUSD bounced from support, potential for a further rise!
LTCUSD bounced off 62.75 where it could potentially rise further to 79.66.
Trading CFDs on margin carries high risk.
Losses can exceed the initial investment so please ensure you fully
understand the risks.

LTCUSD Falling Wedge ."In the name of Allah, the Most Gracious, the Most Merciful"
LTCUSD Falling Wedge.
We need to wait for Full Breakout Confirmation.
Note: This is only for Educational Purpose this is not Investment advice.
Please support the setup with your likes, comments and by following on Trading View.
Thanks
Adil Khan.

LTCUSD bounced from support, potential for a further rise!
LTCUSD bounced off 66.09 where it could potentially rise further to 79.66.
Trading CFDs on margin carries high risk.
Losses can exceed the initial investment so please ensure you fully
understand the risks.

SHORT LTCUSD AFTER PULLBACKPrice is currently sitting at a solid point of support from which we may see price pullback back to our marked entry point @ 84.88 and then move towards our target @40.63
Stop loss has been marked at 105.03
Equity risked - 1%
Risk to reward ratio - 1:2


LTCUSD bounced from support, potential for a further rise!
LTCUSD bounced off 65.96 where it could potentially rise further to 85.32.
Trading CFDs on margin carries high risk.
Losses can exceed the initial investment so please ensure you fully
understand the risks.

LTCUSD bounced from support, potential for a further rise!
LTCUSD bounced off 65.53 where it could potentially rise further to 85.32.
Trading CFDs on margin carries high risk.
Losses can exceed the initial investment so please ensure you fully
understand the risks.

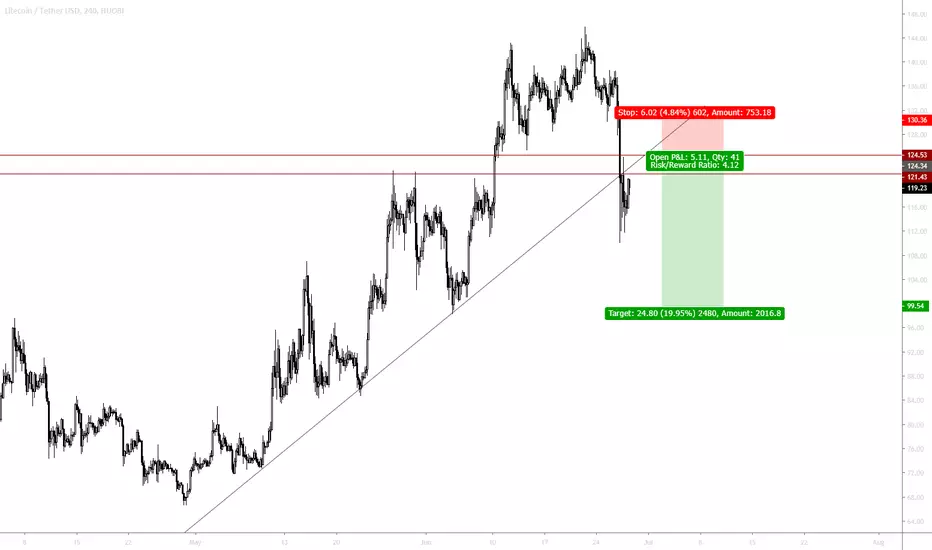
SHORT ON LTC! (LTC / USDT)Limit order on SHORT 124
Stop loss 130
Profit target 100 (profit trailing from 3 %)
BIG SHORT? (LTC / USDT)Hello to everyone!
Short opportunity on LTC / USDT
We can expect a big resistance on an area around 110
Entry 110/120
Stop-loss 130
Target 70
Profit trailing from 5%

LTCUSD H&S forming + bullish convergence on the DailyPossible H&S forming on LTCUSD pair if you don't consider the last little 'surge' as the second shoulder.
This means LTC is at a interesting price point to buy in with a tight SL to try and catch the shoulder up to the neckline around $98.
The support in case we drop down the support will be around $51 as the chart shows. Another support for this H&S claim is the bullish RSI convergence we are having on the chart (D).
What do you think?

LTCUSD bounced from support, potential for a further rise!
LTCUSD bounced off 65.53 where it could potentially rise further to 85.32.
Trading CFDs on margin carries high risk.
Losses can exceed the initial investment so please ensure you fully
understand the risks.

LTCUSD bounced from support, potential for a further rise!
LTCUSD bounced off 65.53 where it could potentially rise further to 85.32.
Trading CFDs on margin carries high risk.
Losses can exceed the initial investment so please ensure you fully
understand the risks.

LTCUSD approaching support, potential for a bounce!
LTCUSD is expected to drop to 1st support at 10.68260 where it could potentially react off and up to 1st resistance at 10.74490.
Trading CFDs on margin carries high risk.
Losses can exceed the initial investment so please ensure you fully
understand the risks.
