LTC/USDT Robbery Underway | Bullish Setup, Get In Now!🔥💎 LTC/USDT HEIST PLAN: ROB AT ANY PRICE! 💎🔥
🚨 Bullish Move Incoming | Layered Entries | Thief Trader Exclusive 🚨
🌟Hi! Hola! Ola! Bonjour! Hallo! Marhaba!🌟
Dear Money Makers & Market Robbers, 🤑💰💸✈️
The time has come for another high-stakes Thief Trading heist, and this time we're lockin' in on LTC/USDT – aka "Litecoin vs Tether" 💣💸
🎯 Thief’s Mission Plan: BULLISH AT ANY PRICE LEVEL!
We're going full stealth mode with a layering strategy — stacking multiple limit orders like a true pro thief preparing for a clean escape! 🔪📉📈
🚪 ENTRY: "Anywhere, Anytime" 🚪
📈 Buy from any price level — but for optimal entry:
🟢 Use Buy Limit orders near recent lows (15-30 min TF)
🔔 Don’t forget to set alerts for breakout confirmation!
🛑 STOP LOSS: Strategic Defense 🛑
🗣️ "Listen up, team! Stop loss ain’t a maybe — it’s your armor. Place it smart, or prepare for pain." 🔥
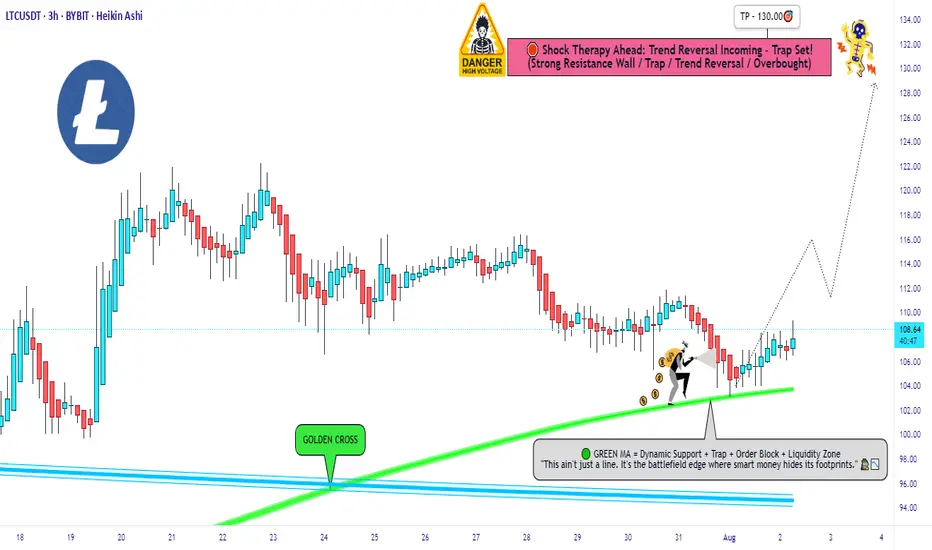
📍Recommended SL: 100.00
🔐 Adjust based on your lot size & how deep you stack your orders.
🏁 TARGET: 130.00 🏁
💸 But always Escape Early if the plan gets too hot!
Use a Trailing SL to lock in gains and slip out clean 😎🧨
🧠 PRO TIPS from the THIEF:
🔎 Only Buy. No Shorting!
💣 Scalpers: Jump in with the trend, not against it.
🧲 Swing Traders: Stay patient, and execute the full heist.
🚀 Use Trailing Stops – Let profit ride, but stay protected!
📢 MARKET INSIGHT:
🔥 Bullish Bias backed by:
✅ On-Chain Metrics
✅ Sentiment Shifts
✅ Macro Flows
✅ COT Reports
✅ Intermarket Divergence
⚠️ TRADING ALERT: Stay Sharp!
📰 News Events = Volatility.
💡 Avoid fresh entries during high-impact events.
📉 Use Trailing SL to secure your running trades.
💖 SUPPORT THE CREW 💖
🚀 Smash that Boost Button if you believe in the Thief Style Strategy
👑 Let's rob the market together, one level at a time.
🧠 Stay sharp, stay sneaky – and I’ll see you at the next target 🎯
— Thief Trader 🐱👤💰🚁🌍
LTCUSDT
LitecoinLtc usdt daily analysis
Time frame hourly
Risk rewards ratio >2.7👈👌
Short position
Target 100.5 $

LTC long turm Accroding to VSFA+ A.o.A All
Accroding to VSFA+ Strategy, LTCusdt long trum dump expected

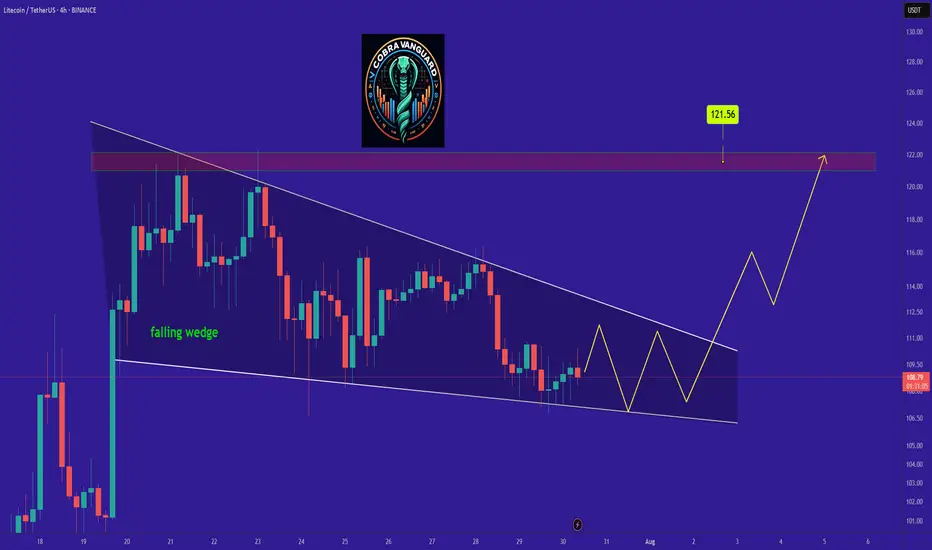
LTC is bullish now and many Traders don't see itSo if you pay attention to the LTC chart you can see that the price has formed a Ascending wedge which means it is expected to price move as equal as the measured price movement.( AB=CD )
NOTE: wait for break of the WEDGE .
Best regards CobraVanguard.💚
Litecoin Approaches $100 Support, Eyeing 17% Rally to $128Hello✌
Let’s analyze Litecoin’s upcoming price potential 📈.
BINANCE:LTCUSDT is approaching a solid daily support around the key psychological level of $100, which coincides with the 0.5 Fibonacci retracement. Holding this level could open the door for a 17 % upside, targeting $128 near a major daily resistance. Keep an eye on this setup for a potential bounce! 📉🔄
✨We put love into every post!
Your support inspires us 💛 Drop a comment we’d love to hear from you! Thanks , Mad Whale

LTC (the most dangerous chart in crypto)LTC / USDT
8 years of accumulation in this triangle and price is being squeezed around apex.. What is the result of this long accumulation?
It reminds me of XRP chart before the big breakout in last November
Keep an eye of it…

LTCUSDT 4H CHART ANALYSIS.Structure: Market is in a bullish trend, forming higher highs and retracing after a strong impulse move.
Liquidity Sweep (SSL): Recent candles show a sweep of sell-side liquidity, targeting the lows near $108, clearing out weak longs.
FVG (Fair Value Gap): Price is approaching a 4H imbalance zone ($104–$108), indicating an inefficiency that may attract buy orders.
POI & OB Zone: A Point of Interest (POI) and a Bullish Order Block (OB) rest just below FVG (around $102–$104), acting as a strong confluence for reversal.
Expectations: If price fills the FVG and reacts from POI/OB with a bullish engulfing or confirmation, we can expect a bounce targeting the previous high around $125+.
Ideal Setup: Look for entry around $102–$106, with SL below OB and TP 1.5–2x above previous high.
This setup aligns with Smart Money Concepts (SMC) – liquidity sweep, FVG fill, and OB reaction. ✅

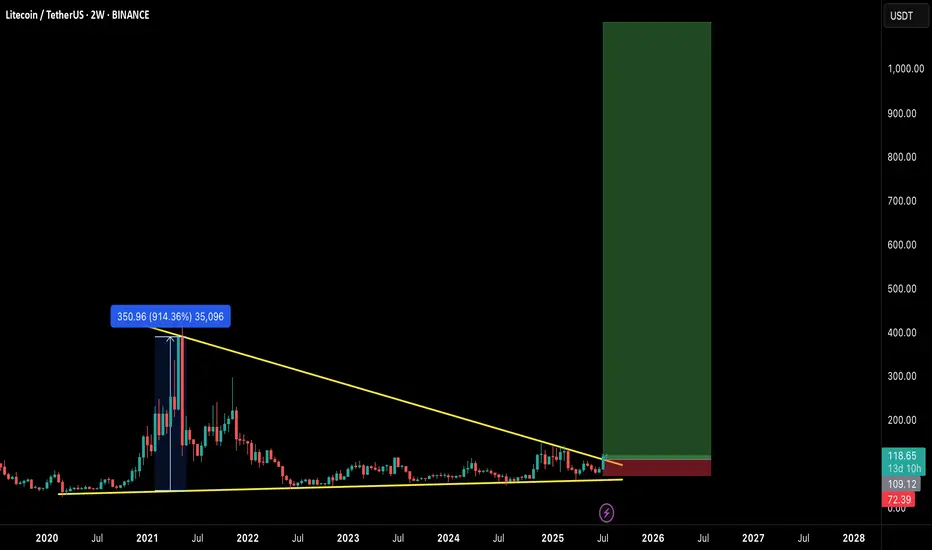
$LTC READY FOR EXPLOSION! THE COMEBACK OF THE OG?Litecoin has quietly formed one of the most massive macro structures in the market — a multi-year falling wedge on the 2-week timeframe, now breaking out with early confirmation.
This could be the start of a generational move, similar to the 2020 breakout. Let's break it down:
🧠 Technical Breakdown:
✅ Falling wedge forming since 2021 — 4 years of compression
✅ Volume and structure support breakout
✅ LTC already gave a 914% rally last time it broke a similar level
📏 Target zone extends above $900–$1000
🛒 Entry Zone:
Current Price: $118
🟢 Buy on breakout or dips near $105–$110 for safer entries
🎯 Target Zones:
TP1: $280
TP2: $400
TP3: $650
TP4: $950+
🛑 Stop-loss:
Breakdown below $72 (last higher low & wedge base)
⚖️ Risk-to-Reward:
High timeframe structure = High conviction play.
Potential R:R > 8x — Rare macro opportunities like this don’t come often.
🧩 Final Thoughts:
LTC may not be the flashiest alt anymore, but this setup is technically undeniable. If BTC enters full bull cycle, LTC could ride the wave explosively.
🔥 This could be a "buy and forget" macro play for 6–12 months.
💬 Let me know your thoughts in the comments & hit that ❤️ if you like macro setups like these!
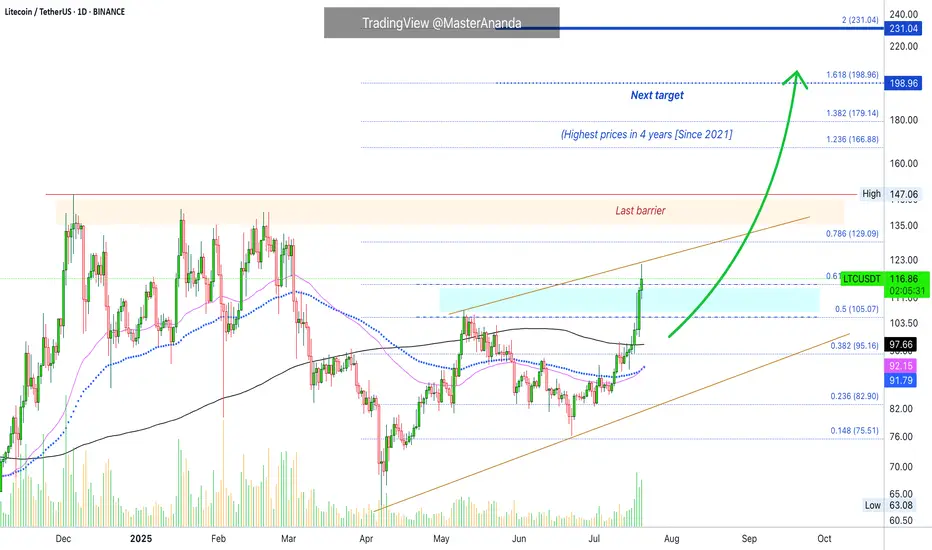
Litecoin's Path Beyond $200 Revealed · Daily TimeframeWe looked at Litecoin on the weekly timeframe which is the long-term picture, but we also need to consider the daily to see what is happening up-close.
As soon as we open this chart we have three signals that stand out:
1) Litecoin is now trading above MA200 safely and rising. This is a very strong bullish development and supports additional growth.
2) Trading volume has been rising significantly being now the highest since February 2025. The difference is that in February we were in distribution, resistance being confirmed with prices set to move lower. In this case, the action is rising from support and volume is rising rather than dropping.
3) May's peak has been broken. Many pairs are still trading below their high in May. Those that broke this level are the ones moving first and this signal exudes strength. Litecoin is now one of the top performers specially in the group with a big market capitalization.
The next barrier is the December 2024 high at $147. Short-term the next target is $129. As soon as the former breaks, we are going to be looking at the highest price since 2021.
Litecoin is fighting resistance today, 0.618 Fib. extension at $115. It is trading above this level but the confirmation only happens at the daily close. If it closes above, bullish confirmed. It if closes below, it means that there will need to be some struggling before higher prices. This struggling can last a few days just as it can extend. Seeing Ethereum and how it is moving straight up, Litecoin is likely to do the same.
Overall, conditions are good for Litecoin on the daily timeframe.
Thank you for reading.
Namaste.
LITCOIN BUY OR SELL !!!Hello friends🙌
🔊According to the price drop, you can see that the price has been below the specified resistance for a while and when it was able to break the resistance, it shows us the power of the buyers. Now, when we return to the previous resistance, which has now become a support, you can see that the buyers are providing good support and the price is expected to move to the specified targets.
Note that the most important rule in trading is capital and risk management So make sure to follow it.
🔥Follow us for more signals🔥
*Trade safely with us*

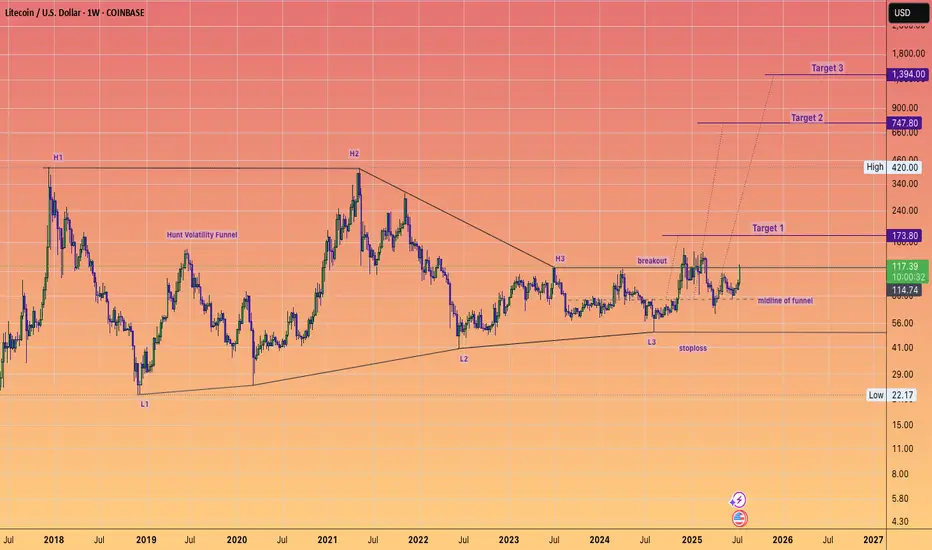
Litecoin has maintained it's HVF and can STILL do a 10X...in the coming years.
This is a massive pattern formed over 7 years and I expect over performance of target 3 ultimately.
The day to week price action really does not matter when you have beautiful setups like this.
Keep stacking at these low prices.
@TheCryptoSniper
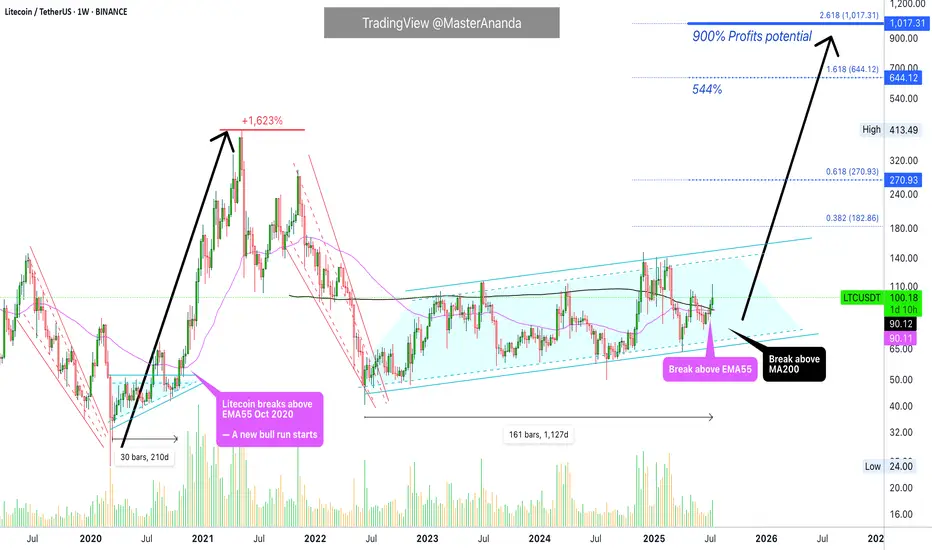
Litecoin $1,000 (900%) ExplainedBack in 2020, just 210 days of consolidation led to a 1,623% strong bull market. How much different market conditions we have now. Since 2022, Litecoin has been consolidating. The length of this consolidation is now 1,127 days. More than five times the previous consolidation and then some.
How much higher can Litecoin go compared to a past period?
How much more growth can a project produce when it has been building strength for so long?
LTCUSDT is now trading weekly above EMA55. When this happened back in 2020, what followed was sustained growth. Straight up, literally, for a period of 203 days. No stops.
Back in 2020, Litecoin moved above EMA55 first in August just to be rejected. The second time was the good one. This year the situation is the exact same. Litecoin broke above EMA55 in May and was rejected. The second time is happening now in July and this is the good one.
Litecoin is also trading above MA200 fully confirmed and there is a golden cross between EMA55 and MA200. We are very close to a major marketwide bull-run.
$644 in this bullish cycle is a high probability target for Litecoin, but prices can go higher, much higher because market conditions continue to improve and institutions will gain access to Litecoin through Exchange-Trade Funds (ETFs). This means that a standard price projection would be a disservice to us. We are aiming for $1,000+ on this bullish cycle but it can end up closing higher of course.
After the new all-time high is hit, it is normal to see a correction or even a bear market. This one should be short and small compared to previous ones. See you at 1K.
Namaste.
#LTCUSDT: On The Way To $200, Get Ready For Swing Buy! Hey there!
Evening Everyone,
The price of this crypto is currently in a bullish formation, and it looks like it’s on the rise, potentially reaching $200. The best thing you can do is wait for the price to break out of the downtrend and then keep going up. You could set a target at $150 and then $200, which would be a swing move.
Good luck and trade safely! 😊
Thanks a bunch for your unwavering support! ❤️🚀
If you’d like to lend a hand, here are a few ways you can contribute:
- Like our ideas
- Comment on our ideas
- Share our ideas
Cheers,
Team Setupsfx_

LTC - Time to buy again! (Update)Finally, this pattern was broken and had a positive impact, leading to significant growth. Now, with a slight price correction, higher price levels can be reached.
PREVIOUS ANALYSIS
Best regards CobraVanguard.💚

LITCOIN : So what is an ETF ?Hello friends
Be careful with the recent fluctuations of this coin because the movements of this coin have become unpredictable and we suggest that if you want to buy, buy in the specified support areas and in steps, of course with capital and risk management...
We have also specified targets for you.
*Trade safely with us*

Is This the Perfect Moment to Rob the LTC/USD Vault?🏴☠️ LTC/USD Heist Mode: The Moving Average Break-In Plan 💰📈
🌟Hi! Hola! Ola! Bonjour! Hallo! Marhaba!🌟
Calling all Market Bandits, Crypto Hustlers & Chart Raiders! 🤑💰🚀
🚨Mission Briefing
We’re eyeing a bullish breakout hit job on the LTC/USD chart — all based on the elite 🔥Thief Trading Style🔥 with a touch of candle science, moving average vault-cracking, and some solid day/swing setups. This ain’t your grandma’s trade plan — this is high-level lootin’ with precision.
🕵️♂️ 🎯 ENTRY PLAN — Unlock the Vault at $86.00
Wait for the MA breakout + candle close above that sneaky Moving Average line.
➡️ Execute Buy Stop orders above MA
➡️ OR place Buy Limit during a pullback to swing low/high zones in 15m–30m timeframe.
📌 Pro tip: Set an alert – catch the breakout live, don’t chase it later.
🛑 STOP LOSS — Your Getaway Route
Place your Thief SL near the recent swing low (82.00 using 3H chart).
🎤“If you’re entering like a pro, stop loss goes where it should – not where fear lives. But hey, it's your ride or die. Choose wisely.” 🔥
💡Adjust SL based on lot size, risk %, & how deep your robbery goes.
🏴☠️ TARGET ZONE — Exit the Scene at $92.00
Get your bags packed, profits stacked, and be ready to escape before the market catches on.
💸 Grab the loot and bounce before the reversal gangs arrive!
📈 Why the Heist?
The LTC/USD crypto market is showing bullish momentum, backed by key analysis angles:
🔍 Fundamentals
📊 COT Report
💥 On-Chain Metrics
🧠 Sentimental Heat
🌍 Intermarket Structure
👉 Check your intel. React. Don’t sleep. 🔗🔗
⚠️ News Alert & Risk Tip
🗞️ Stay clear of trades during volatile news releases
🔐 Use trailing stops to lock in gains
🚫 Protect your positions – don't let profits slip through cracks.
📌Disclaimer:
This ain’t financial advice — it’s just a shared plan for market raiders. Trade at your own risk, and don’t forget to bring your own map. Market shifts faster than a getaway car — so adapt & react smartly. 🧠💡
💖 BOOST the Plan 💥
Hit that Boost Button if you're vibin’ with the robbery crew. It powers up the strategy and supports the movement. Together, we trade to take — The Thief Trading Way. 💸💪🎉
🚀 Catch you on the next breakout. Stay sneaky, stay sharp. 🐱👤🤑

When YouTubers Say 'No'… We Say 'LTC Go!'I’m not here to drop some fancy technical analysis today.
I’m here to tell you… this might just be it.
A big, popular YouTube channel just announced they’re not too bullish on Litecoin this cycle.
And guess what? That might actually be our ultimate buy signal.
The chart’s looking bullish now — the trap has been set, and left behind us. 😎
They FUD, We Flood (Our Bags)
Why Litecoin? Beyond its unshakable fundamentals, if you genuinely understand and believe in crypto and digital freedom, Litecoin is the purest expression of that vision
That's it, that's the idea" - Good night !

#LTC Update #4 – July 10, 2025🔵 #LTC Update #4 – July 10, 2025
LTC was rejected from the fractal resistance left behind during its previous impulsive move. Just below this level lies an imbalance zone, which is likely to be filled first during any correction. If the downtrend continues, price could move toward $88, $87, and $86 levels.
Currently, long positions seem risky. However, a short setup around $91 with a 3% profit target could be an option for risk-takers. I’m personally not opening any trade at this time, but short-term traders may consider it.
On the upside, LTC is still holding above its 200 MA, which is a positive technical indicator. If it manages to hold above $92.30, the next upside target would be around $95.

Your Biggest Trading Enemy Isn’t the Market It’s YouWhy do traders get liquidated right at the peak of confidence?
Is capital safety defined by charts or by our inner world?
Let’s dig deeper. The real threat doesn’t come from the market. It comes from within.
Hello✌
Spend 3 minutes ⏰ reading this educational material.
🎯 Analytical Insight on Litecoin:
BINANCE:LTCUSDT has recently formed a reliable inverse head and shoulders pattern near a strong support zone 📉. This technical setup indicates a potential upside of approximately 9%, targeting $95 in the near future 🚀. Traders should watch for confirmation and manage risk accordingly.
Now , let's dive into the educational section,
🧠 The Mind: The Most Dangerous Indicator in the Market
Before the market empties your wallet, it hijacks your mind.
You may think you’re entering a trade using your indicators, but more often than not, it’s your emotions pushing the buttons. Tools are just the excuse.
When you feel absolutely certain and think this time is different, that’s when you’ve probably entered the danger zone. The market thrives on exploiting emotional certainty.
Truth is, many losses come not from poor analysis but from repeating bad decisions out of anger, revenge, or stubbornness. If you don’t protect yourself from your own behavior, no strategy can protect your capital.
🧨 Overconfidence: The Greatest Liquidator
One of the most destructive feelings in trading is confidence without validation
After a few consecutive wins, your brain flips the switch and you feel invincible
Overconfidence tricks you into skipping stop-losses, overleveraging, ignoring timeframes, or ditching your strategy altogether. The end result is all your hard-earned profits vanish in a single emotionally-driven trade.
Confidence should be earned trade by trade, not assumed after a few lucky runs.
📉 TradingView Tools: Real Support or Mental Trap?
Let’s be real. Tools are powerful only if used with clarity
Try the Bar Replay feature to stress-test your setups without live risk
Use the Long Short Position tool to visualize your actual risk reward, not the one your ego wants to see
Set Alerts so that your entries are data driven, not emotion driven
These tools are your allies. But just like a sharp knife, they can cut the cook too. The problem isn’t the tool. It’s always the hand using it.
🪤 If It Feels Right, It’s Probably a Trap
One of the most common cognitive biases traders face is mistaking emotions for data
You might see price touch support, but deep down, you’re still haunted by that last failed bounce, so this time, you enter out of revenge. Or maybe everyone online is screaming pump and FOMO kicks in
At that moment, you’re not thinking. You’re gambling
The market doesn’t care how you feel. It only cares whether you’re reacting emotionally because that’s the easiest liquidity
🧩 Not Trading Is a Trade
Especially in crypto, traders with patience often outperform those who force constant action
Someone who watches charts for three days without entering may end up ahead of the one jumping into five trades a day
Discipline in waiting is a skill. Sometimes, the most profitable decision is simply doing nothing
Pro traders strike rarely but with precision. The rest is surveillance, not execution
🧠 Good Trading Means Being Rational in the Moment
Here’s what separates losers from winners
Losers make a decision and then look for justification
Winners seek solid logic then make a decision
If your mind is unstable, even the best setup can lead to chaos
But a clear mind can extract gold from even the simplest charts
🧬 Final Thought
If you're serious about protecting capital, start with protecting your mindset
Open positions, stop losses, and chart entries matter, but without internal stability, none of them will save you
In truth, the riskiest place for your capital is not the market. It’s you
✨ Need a little love!
We pour love into every post your support keeps us inspired! 💛 Don’t be shy, we’d love to hear from you on comments. Big thanks , Mad Whale 🐋
📜Please make sure to do your own research before investing, and review the disclaimer provided at the end of each post.

#LTC Update #3 – July 8, 2025🔵 #LTC Update #3 – July 8, 2025
Litecoin continues its correction following the latest impulsive move. A strong resistance awaits at the $87.20 level, and breaking through it won't be easy. If price manages to close above $88.50 , a potential move toward the $92 zone may follow.
On the downside, if Litecoin pulls back below $82 , the next likely stop is around $77 . At this stage, I do not recommend opening any long or short positions. Observing the market is the better approach for now.

Litecoin:Is the main climb coming?hello friends👋
As you can see, the price, after falling in the support area specified by the buyers, has been supported and returned, forming an upward pattern.
Now we don't enter into a transaction with just one pattern, we also check the entry of buyers and the amount of currency and other factors and draw conclusions.
According to the points we have said, we have identified very important support points for you to buy step by step with capital and risk management and move to the specified goals.
🔥Follow us for more signals 🔥
*Trade with us safely*

SCRUSDT UPDATE
Pattern: Falling Wedge Breakout
Current Price: \$0.268
Target Price: \$0.398
Target % Gain: 50.1%
Technical Analysis: SCR has broken out of a falling wedge pattern on the 12H chart with a clean close above resistance. The breakout is backed by bullish candles and increasing volume, suggesting a potential 50% move upward.
Time Frame: 12H

LTC Short SetupWait for the entry and execute, SL is smaller and if candle closes strongly above the zone then must close the trade. Hopefully it won't break easily this zone as bearish fvg + bearish order block lies here.
