LTC Buy / Long SetupAs price wants to move in a range, SO that's another setup for LTC, invalidation is same as for short setup, candle closing below the mention zone immediately close the trade otherwise wick doesn't matter, wick do the damage body tells the story.
LTCUSDT

LTC/USDT Weekly – Massive Breakout Loading? 3-Year Triangle
📌 Litecoin is now standing at one of its most crucial technical levels since the 2021 bull run. After 3 years of compression inside a massive symmetrical triangle, price action is nearing a major breakout point. Will LTC finally explode upward, or are bears still in control? Let’s break it down!
🧠 Technical Pattern: Long-Term Symmetrical Triangle
This is a classic pattern that signals a prolonged phase of buyer-seller equilibrium, where lower highs and higher lows converge into a point of tension. Historically, this type of formation often ends in a sharp breakout in either direction.
🔺 Pattern Duration: Since May 2021
🔺 Converging trendlines: Tightening into Q3/Q4 2025
🔺 Historical breakout probability: ~60-75% chance of upward breakout in symmetrical triangles
🟢 Bullish Scenario (Upside Breakout):
If LTC breaks above the upper triangle resistance (~$100 – $115) with strong volume, it could ignite a major rally due to:
✅ The end of a multi-year consolidation
✅ Renewed investor confidence and potential altcoin season
✅ Technical confirmation of breakout from a long-term base
🎯 Upside Targets:
$134.66 – Psychological resistance and minor horizontal supply zone
$230.13 – Major resistance area from 2022 breakdown
$280.87 – Fib extension & key structural level
$325.00 – Pre-blowoff level from 2021
$387.91 – All-Time High (ATH) retest zone
📌 Based on the triangle’s base projection, a technical target of ~$280+ is plausible if breakout confirms.
🔴 Bearish Scenario (Downside Breakdown):
If LTC fails to hold the rising support (~$85), it may trigger a strong bearish reaction, especially if Bitcoin also loses key support levels.
📉 Downside Levels to Watch:
$65.00 – Key horizontal support
$49.00 – $39.00 – Historical demand zone from early 2020
$23.90 – Pandemic-era low (extreme bearish target)
📌 Breakdown confirmation requires a weekly close below support with high volume, ideally accompanied by macro risk-off sentiment.
🧩 Key Confirmations to Watch For:
1. Volume Surge on Breakout – Is the move supported by strong volume?
2. Successful Retest – Does price retest the breakout level as support?
3. Momentum Indicators – Weekly RSI > 50 and MACD bullish crossover can strengthen conviction.
📊 Fundamental & Sentiment Context:
Litecoin halving occurred in August 2023. Historically, price rallies follow 6–12 months after.
Often dubbed the “digital silver”, LTC remains relevant during altcoin cycles.
Whale accumulation has increased slowly since late 2024—possibly indicating long-term positioning.
✅ Conclusion & Strategy:
Litecoin is like a technical time bomb waiting to explode. Traders and investors should prepare for both breakout and breakdown scenarios. Patience and confirmation are key. Don’t chase—let the chart speak first.
🎯 Plan the trade, trade the plan. Don’t FOMO into noise—wait for structure!
#LTCUSDT #LitecoinBreakout #CryptoTechnicalAnalysis #SymmetricalTriangle #BullishSetup #AltcoinSeason #Litecoin2025 #CryptoChart #TrianglePattern #LitecoinRally

Litecoin is approaching a critical breakout point.
LTC has been consolidating within this symmetrical triangle for an extended period, showing decreasing volatility and tighter price action. The structure suggests that a significant move is imminent.
🎯 Target 1: $400
🎯 Target 2: $1,000
If the breakout occurs in the coming weeks, we could see Litecoin reaching the $400 level within the next 2 to 3 months, with potential to hit $1,000 over the next 12 months — especially if bullish momentum picks up across the crypto market.
Watch closely — the move could be explosive.
Best of luck to everyone! 🚀

The Chart Is Ugly. The Setup Is Beautiful. Welcome to the TrapI’m gonna try to keep it short (try, lol).
If you’re new here or just stumbled on this, here’s what you need to know:
LTC is the King of Pain… and the Prince of Parabolas.
It’s one of the hardest coins to hold — maybe the hardest.
It’ll test your patience, shake your conviction, and make you doubt everything...
right before it delivers.
Looking at the chart, LTC printed a bearish head-and-shoulders pattern.
But guess what? That’s PROBABLY the final trap — the one that triggers those explosive moves right after... the start of the parabolic season.
In my humble opinion, yeah — we MIGHT still drop more depending on what BTC does. But if you’re reading this and wondering what things look like before a big breakout — well, it’s exactly this:
Ugly charts, bearish structures, everyone doubting… and then boom — a new beginning. A rise.
That May move from $81 to $107? That was the breakout.
What we’re in now? It’s the bear trap.
What comes next? Should be something we’ve never seen before. I’ll leave it at that.
Some fundamentals:
LTC:
Hash-rate? Went parabolic — price hasn’t caught up yet.
Top 5 most used digital assets for moving value (by volume).
Born in 2011. 100% uptime. Still standing, still in the top 20. Survived it all.
Only 84M LTC will ever exist. Scarcity is real.
78% of LTC addresses are holding for over a year. They’re not selling cheap.
MWEB = optional privacy.
LiteVM = next-gen programmability for LTC.
Oh, and don’t forget: potential ETF approval.
If there’s one digital asset with a real shot — it’s LTC. Already declared a commodity by the CFTC.
Over 7 years of consolidation. If you zoom out to the monthly+ timeframe, all the bull and bear noise looks like one big sideways base.
Just to name a FEW.
Absurdly undervalued. Criminally underperforming.

LTC/USDT Heist Alert: Bullish Loot Before the Trap! 🚨 LTC/USDT HEIST ALERT: Quick Bullish Raid Before the Trap! (Thief Trading Plan) 🚨
🌟 Greetings, Market Robbers! 🌟
Hola! Ola! Bonjour! Hallo! Marhaba! 🤑💰💸
🔥 Thief Trading Analysis signals a bullish LTC/USDT heist opportunity! Our plan? Enter long, escape near high-risk zones before bears ambush weak hands. Fast profits = less risk! 🏆💸
🎯 Heist Strategy (LTC/USDT Swing/Day Trade)
📈 Entry:
*"Vault is open! Swipe bullish loot at any price—but for a smoother steal, set buy limits near 15M/30M swing lows."*
🛑 Stop Loss:
📍 Thief SL at latest 4H swing low (adjust for risk/lot size).
📍 Multiple orders? Don’t get caught—size SL wisely!
🏴☠️ Target: 114.00 (or escape early if momentum fades!)
💥 Why LTC/USDT?
Bullish momentum (scalping/day trade).
USDT pairs = stablecoin safety (no USD volatility risk).
Liquidity + tighter spreads (cleaner executions).
⚠️ Heist Safety Protocol
🚨 News = Danger Zone! Avoid new trades during releases.
🔐 Trailing stops = Lock profits, dodge reversals.
💖 Boost the Heist!
💥 Smash the Like & Boost 💥 to fuel our robbery crew! More boosts = more profitable heists! 🚀🤝
Stay tuned—next heist coming soon! 🤑🐱👤

Litecoin ETFs Target $199 Followed by $283 Followed by...It will definitely go higher but, let's do it step by step. Litecoin is setting itself to move up with targets being first $199 and then $283, these are the main targets for this bullish jump.
It will go higher of course but the market tends to fluctuate, never straight down but also never straight up. It advances nicely and then stops, a stop that you sense can last only a few days can result in a correction lasting more than an entire month. When you see this happening, you question yourself, "Why didn't I sell when prices were up?"
And the same pattern repeats; over and over, again and again. Now, Litecoin will produce a new bullish wave. The retrace can last 3 weeks rather than 6 weeks. It can last 12 weeks rather than 6 weeks, I don't know. So, instead of being 100% right or 100% wrong, we can sell portions at each target and just be happy/grateful with the results. Or, we can plan ahead... Focus on maximizing profits because Litecoin is ready to grow, the continuation of the bullish move; the next "leg-up."
» Litecoin Exchange-Traded Fund (LTC ETF).
Do you think this is bullish? Think about Bitcoin's ETFs results. It can be mixed at first, volatility, but the end is always bullish. Strongly bullish. Hyper-bullish. Litecoin is very small compared to Bitcoin. It can be a major boom!
Thanks a lot for your support.
Namaste.

LTC analysis.Give me some energy !!!So if you pay attention to the LTC chart you can see that the price has formed a Ascending FLAG or wedge which means it is expected to price move as equal as the measured price movement.( AB=CD )
NOTE: wait for break of the FLAG .
Best regards CobraVanguard.💚

$LTC/USDT Trade Setup 6H Chart.$LTC/USDT Trade Setup 6H Chart.
- Entry: CMP
- Stop Loss: $76.20
Target:
TP 1:- $93.95
TP 2:- $85.65
LTC is bouncing off a long-term trendline support with an early MACD bullish crossover.
DYRO, NFA

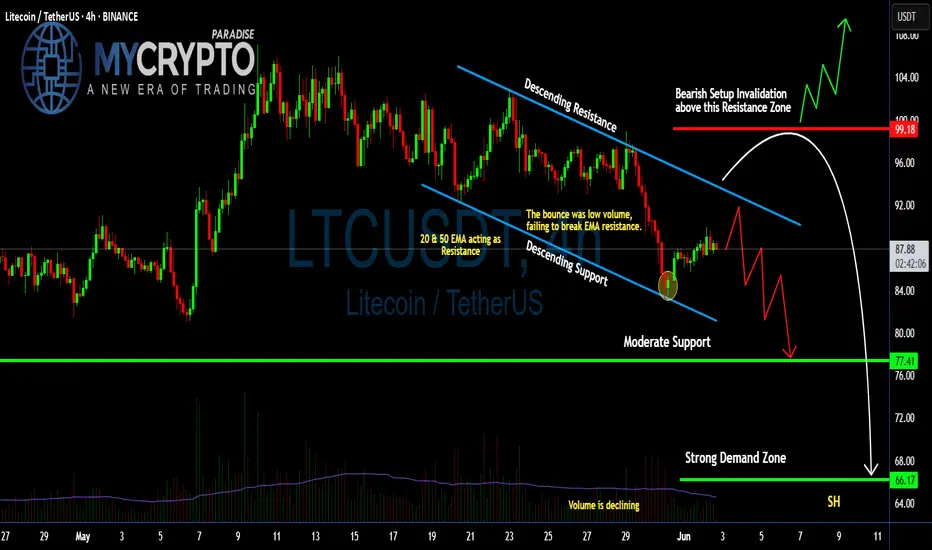
Can #LTC Bulls Make Recovery or Bears will Continue to Dominate?Yello Paradisers! Are you ready for the next wave of #LTC that can catch many traders off guard? Let's see the latest setup of #Litecoin and what can happen next:
💎#LTCUSDT is currently trapped inside a descending channel, signaling sustained bearish pressure. The most recent bounce came with declining volume and failed to reclaim the 20 & 50 EMA — a clear sign that bulls are running out of steam. These EMAs are now acting as dynamic resistance, capping every upward attempt.
💎The #LTCUSD structure remains bearish as long as the price stays below the key resistance zone near $92.00, especially under $99.18, which marks the invalidation of the bearish setup. If that zone is broken convincingly with huge volume, we could see a short squeeze toward $104.00. Until then, the bias will stay on the downside.
💎Support at $77.41 might offer temporary relief, but if sellers break through that level, all eyes will shift to the strong demand zone at $66.17 — a region that has historically attracted high-volume buying and could serve as a potential bounce area.
💎Volume continues to decline, showing that momentum is fading with each bounce. This increases the probability of a breakdown continuation unless the trendline resistance is flipped with strength and backed by volume. Right now, the chart shows weakness, not reversal.
Stay disciplined. The next big opportunity will come to those who wait not those who chase.
MyCryptoParadise
iFeel the success🌴
Litecoin LTC price analysisToday we will analyze the third candidate for ETF in the near future is CRYPTOCAP:LTC
An old coin, good fundamentals, 1:1 tokenomics like CRYPTOCAP:BTC but 4 times more coins, untapped potential, and the list goes on...
♎️ The main difference from the previous two candidates is the current market cap of the coins: CRYPTOCAP:XRP - $118 billion, CRYPTOCAP:SOL - $72 billion, #Litecoin only $6 billion
Accordingly, the prospects for growth in the price of OKX:LTCUSDT are many times greater
🔥 Currently, #LTCUSD price is near the potential purchase zone of $71.25-76.25
📈 Growth potential of at least $170-180
🐻Critical level of $67
_____________________
Did you like our analysis? Leave a comment, like, and follow to get more

LTCUSDT - Movess?LTCUSDT have moves to be seen prior to anymoves to be taken in consideration! A small pull move down then to up!

Litecoin —It's All In Your Mind, Time To DecideTruly the longest consolidation phase has been experienced, since June 2022 until June 2025. This consolidation produced a broad channel for Litecoin but, make no mistake, this is a trading range.
The difference between a rising channel where consolidation is happening and a very strong bull market is the slope of the rise. The bull market price action produces a much stronger rise, as shown by the bars pattern.
The action becomes more erratic to the upside rather than stable and sideways. The market becomes euphoric because people cannot handle all the money they hold. Your account balance grows and grows and grows, so much that you lose all control. So much that you forget it, so much that you don't take action and then everything is gone.
It is incredible but still, many people do take advantage and those are mainly the ones with experience.
The first time we get it wrong. That's ok, we've all been there, nobody to blame rookie mistake.
The second time we do better but we still feel we could have done even better. If only we had more organization, more time to prepare; more experience...
The third time... This is the third time.
Thousands of millionaires are created in each bull market, tends of thousands, are you going to be one of those?
There is no competition. For you to make money nobody else has to lose money it doesn't work that way. It is different; the market gives, the market takes.
If you are ready to accept a lot the market will give you a lot.
If you are here to lose money the market will take everything away.
It is not about the whales, the bots or the exchange... It is all about you, it is all in your mind.
Some people join the last few days and make millions by buying big and selling right away, over and over. Some people lose millions by going LONG going SHORT when the market is neither going down or up. Some people are playing games.
You just need to decide, consciously and unconsciously what is your true goal. If you want financial independence, financial abundance, financial freedom, just make your choice. Say it, write it, see it, feel it... Believe it, and everything you want will be yours.
There is no limit other than your own mind.
The market will give you whatever you are ready to accept.
If you work for 10 millions dollars, that's exactly what you will get. But, if you work for 100 millions, hundreds you will get. There is no limit. It is all in your mind.
Namaste.

LTCUSDT 1D AnalysisLTC ~ 1D Analysis
#LTC Buy after successfully breaking this resistance line with a short term target of at least 10%+ from here.

#LTC/USDT#LTC
The price is moving within a descending channel on the 1-hour frame, adhering well to it, and is heading for a strong breakout and retest.
We are seeing a bounce from the lower boundary of the descending channel, which is support at 92.48.
We have a downtrend on the RSI indicator that is about to be broken and retested, supporting the upward trend.
We are looking for stability above the 100 moving average.
Entry price: 97.44
First target: 100.24
Second target: 102.45
Third target: 105.26

LTC/USDT 4H ChartHello everyone, let's look at the 4H LTC to USDT chart, in this situation we can see how the price is moving in a specific yellow triangle, in which we can see an attempt to exit from the bottom. On the other hand, the blue lines mark the main channel of the downtrend and here we can see how the price is fighting with its upper limit, but it is a strong resistance.
Let's start by defining the goals for the near future that the price has to face:
T1 = 101 USD
T2 = 111 USD
Т3 = 124 USD
Т4 = 147 USD
Now let's move on to the stop-loss in case the market continues to fall:
SL1 = 90 USD
SL2 = 80 USD
SL3 = 63 USD
The RSI indicator shows a rebound, but the movement remains around the middle of the range, which further leaves room for a potential deepening of the rebound.

Litecoin Bullish Continuation Confirmed, Last Chance ($200 Next)Litecoin grew 69% from its April correction bottom and currently trades 54% higher from this low point, the retrace was very, very small. A small retrace means that there is no sellers pressure. Lack of sellers pressure means plenty of room available for growth in the coming weeks and months. People are not willing to sell their Altcoins (Litecoin). As soon as the market goes bullish, which is now within days, this will produce massive interest and a strong bullish wave.
Litecoin is set to grow now as the action turns green. Weeks of consolidation and nothing changes, the chart structure remains perfectly bullish.
This is a time sensitive update. The retrace is over. The wait is over. Crypto is going up.
It is better to be in now, "buy like it is the end of the world."
It is better to be in the market now, 100% in, because the next advance will be so strong you will not believe it until it is fully done. Litecoin will hit the highest prices in years, the same for Polkadot, Notcoin and the other pairs that I shared daily @MasterAnanda. The time is now.
This advance will be so great, that everybody will turn their attention to the Cryptocurrency market. It will affect mainly the Altcoins. Everything that has been neglected for years will be recover and hit the highest prices in a long while. Multi-years high.
You've been warned.
Namaste.

LTC (Litecoin) – Swing Long Setup from Support ZoneLTC is currently pulling back into a key support area between $89 – $96, which has historically provided strong bullish reversals. The zone aligns with a potential higher low on the daily timeframe, making it a solid area for a risk-reward favorable swing long.
🔹 Entry Zone:
$89 – $96 (structural support and previous demand zone)
🎯 Take Profit Targets:
🥇 $133 – $146 (key resistance and prior local highs)
🥈 $180 – $190 (macro range highs and psychological barrier)
🛑 Stop Loss:
Hard stop at $80 (clear break of structure and invalidation of higher low)

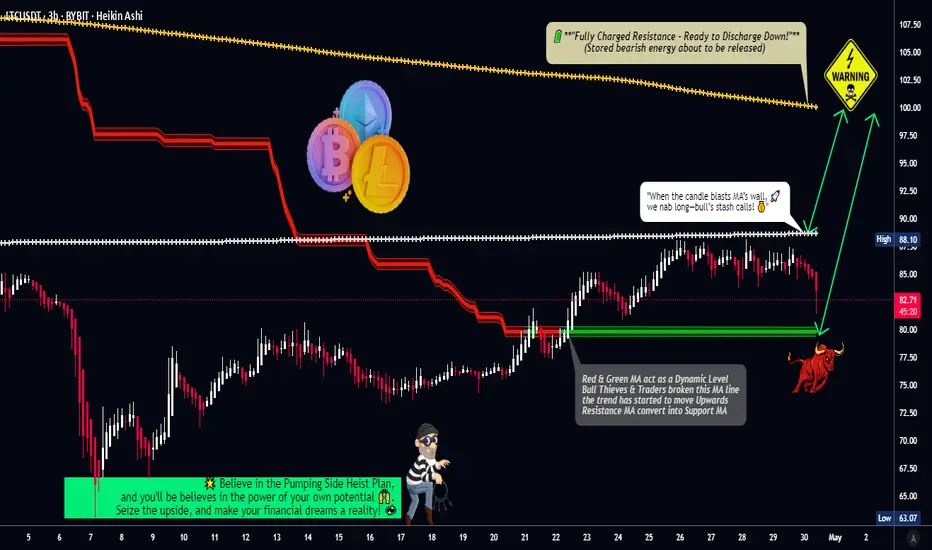
LTC/USDT "Litecoin vs Tether" Crypto Heist Plan (Day/Swing)🌟Hi! Hola! Ola! Bonjour! Hallo! Marhaba!🌟
Dear Money Makers & Robbers, 🤑 💰💸✈️
Based on 🔥Thief Trading style technical and fundamental analysis🔥, here is our master plan to heist the LTC/USDT "Litecoin vs Tether" Crypto Market. Please adhere to the strategy I've outlined in the chart, which emphasizes long entry. Our aim is to escape near the high-risk Yellow MA Zone. Risky level, overbought market, consolidation, trend reversal, trap at the level where traders and bearish robbers are stronger. 🏆💸"Take profit and treat yourself, traders. You deserve it!💪🏆🎉
Entry 📈 : "The heist is on! Wait for the MA breakout (90.00) then make your move - Bullish profits await!"
however I advise to Place Buy stop orders above the Moving average (or) Place buy limit orders within a 15 or 30 minute timeframe most recent or swing, low or high level for Pullback entries.
📌I strongly advise you to set an "alert (Alarm)" on your chart so you can see when the breakout entry occurs.
Stop Loss 🛑: "🔊 Yo, listen up! 🗣️ If you're lookin' to get in on a buy stop order, don't even think about settin' that stop loss till after the breakout 🚀. You feel me? Now, if you're smart, you'll place that stop loss where I told you to 📍, but if you're a rebel, you can put it wherever you like 🤪 - just don't say I didn't warn you ⚠️. You're playin' with fire 🔥, and it's your risk, not mine 👊."
📍 Thief SL placed at the nearest/swing low level Using the 3H timeframe (77.50) Day / Swing trade basis.
📍 SL is based on your risk of the trade, lot size and how many multiple orders you have to take.
🏴☠️Target 🎯: 100.00 (or) Escape Before the Target
🧲Scalpers, take note 👀 : only scalp on the Long side. If you have a lot of money, you can go straight away; if not, you can join swing traders and carry out the robbery plan. Use trailing SL to safeguard your money 💰.
💰💵💸LTC/USDT "Litecoin vs Tether" Crypto Market Heist Plan (Swing/Day) is currently experiencing a bullishness,., driven by several key factors. .☝☝☝
📰🗞️Get & Read the Fundamental, Macro, COT Report, On Chain Analysis, Sentimental Outlook, Intermarket Analysis, Future trend targets... go ahead to check 👉👉👉🔗🔗🔗
⚠️Trading Alert : News Releases and Position Management 📰🗞️🚫🚏
As a reminder, news releases can have a significant impact on market prices and volatility. To minimize potential losses and protect your running positions,
we recommend the following:
Avoid taking new trades during news releases
Use trailing stop-loss orders to protect your running positions and lock in profits
💖Supporting our robbery plan 💥Hit the Boost Button💥 will enable us to effortlessly make and steal money 💰💵. Boost the strength of our robbery team. Every day in this market make money with ease by using the Thief Trading Style.🏆💪🤝❤️🎉🚀
I'll see you soon with another heist plan, so stay tuned 🤑🐱👤🤗🤩
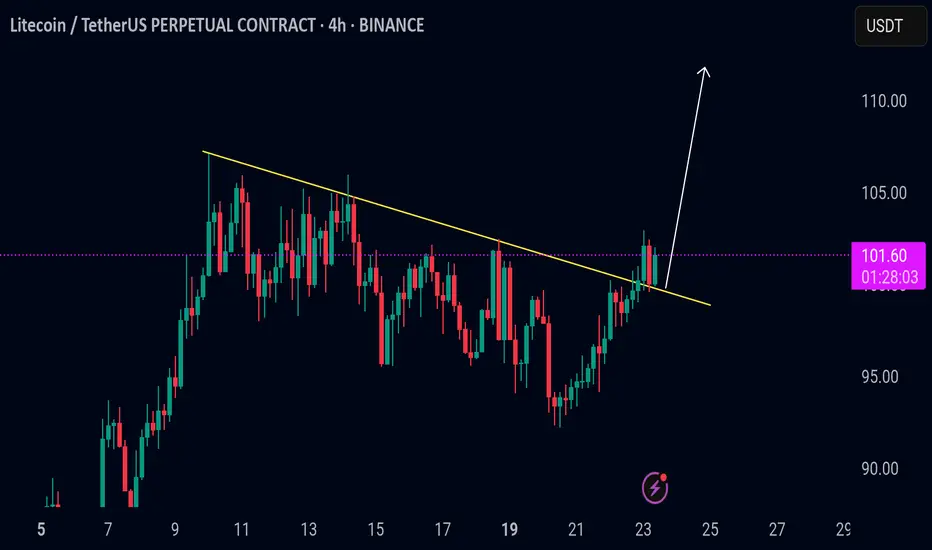
LTC/USDT Trendline Breakout AlertLTC/USDT Trendline Breakout Alert
LTC has broken above a key descending trendline, signaling a potential shift in momentum from bearish to bullish. This kind of breakout often marks the end of a consolidation phase and the beginning of a new upward trend.
If the price holds above the trendline and gains volume support, further upside can be expected. However, if LTC drops back below the trendline, it may signal a false breakout, and caution is advised.
**Key levels to watch:**
* Retest of the broken trendline as support
* Immediate resistance overhead
* Volume confirmation for trend strength
LTC is showing signs of strength — keep it on your radar for a possible bullish continuation.
LTC will this Demand Zone Trigger a Reversal or a Full Crash?Yello,Paradisers! Is this the calm before a major bounce, or the final warning before Litecoin breaks down completely? This current zone is absolutely critical ignore it, and you risk missing the next big move.
💎#LTCUSDT has completed a strong 5-wave impulsive move within an ascending channel. The recent correction has now brought the price back down into a very important demand zone near $90. This level isn’t just a random number it’s sitting right on top of a previous major support zone that held back in early April, just before the entire leg up began.
💎Price is now also testing the lower boundary of the ascending channel. As long as #Litecoin holds this demand zone between $90 and $93, the bullish structure remains intact. This could be the perfect reload zone for bigger players preparing for the next leg up. If the price begins to form higher lows from here and reclaims the $96–98 region with strength, it could open the path toward the moderate resistance at $110. And if that level breaks with momentum, we’re likely looking at a full extension into the major resistance above $115.
💎However, if #LTC closes a candle below major support at $80 with volume and structure confirming the breakdown, the setup will be invalidated. In that case, we’re potentially heading for a much deeper flush into the $72–75 range, which aligns with the next HTF liquidity pool and potential weekly support.
Stay sharp, Paradisers. The market will soon decide and if you're ready, you'll be on the right side of the move.
MyCryptoParadise
iFeel the success🌴

LTC is near to bearish zone(95.71)Ltc breakdown level is 95.71 and if it drops below this level,
it could drop to 87.27, 81.56 and 75.36, SL 102

LTCUSDT 1D Analysis LTC ~ 1D Analysis
#LTC Buy after successfully breaking this resistance line or buy when retesting this support block with a short term target of at least 10%+.

Is Litecoin Revealing Some Marketwide Bullish Tendencies?This time we will look up-close at Litecoin, its price action.
This week is coming to an end. This week is the "pause" week. Week after week, we get an advance followed by a pause. If the same pattern continues to repeat we are set to experience higher prices.
Here is the weekly chart, let me know what you see in the comments:
Pretty interesting right?
There is more.
Now we will consider the daily timeframe.
Litecoin's price is really strong.
A retrace tends to balance out a rise. If it is a small rise, we get a small retrace. If we have a strong rise, we get a strong retrace. If the rise is quick, the retrace should also be quick, etc.
Let's start with the chart:
The previous retrace lasted five days from peak to bottom. The current retrace so far is in the same state. A peak 10-May and a low 15-May. The low 15-May produced a hammer candlestick pattern. This can support the retrace being over but this is super short-term.
The price is really strong and this is something that favors the bulls. No significant retrace after more than 70% growth means that bullish action is only getting started.
The first retrace activated the 0.382 Fib. retracement level. The second retrace activated 0.5. The current retrace activated the 0.382 level again. This goes in perfect balance with bullish dynamics.
When the market is bullish and rising, retraces tend to stop at the 0.382 Fib. retracement level and sometimes reach 0.5. When the market corrects to 0.618, 0.786 or lower, we are looking at a correction and this tends to happen only after a very strong rise.
Here we also have a bull flag and a strong daily RSI at 61.
What one does the rest follows. So, if Litecoin is pointing toward a continuation, I believe Bitcoin and the other Altcoins will do the same.
Namaste.
