LTC/USDT 1W ChartHello everyone, I invite you to review the current situation on LTC. When we enter the one-week interval, we can see how the price is struggling to return above the upward trend lines.
Here you can see how the current rebound is going towards resistance at $ 82.82, then resistance is visible at $ 95, but an important resistance point will be around $ 115.
Looking the other way, you can see that the price has gone below the support level at $ 70, however, we could see a quick rebound, in a situation where the price continues to go down, the next very strong support is around $ 50.
It is worth looking at the RSI indicator, which shows another descent in the week interval to the level where we could previously see strong price rebounds, which could potentially repeat itself.
LTCUSDT

TAOUSDT UPDATETAOUSDT is a cryptocurrency trading at $231.9, with a target price of $360.0. This represents a potential gain of over 60%. The technical pattern observed is a Bullish Falling Wedge, indicating a possible trend reversal. This pattern suggests that the downward trend may be coming to an end. A breakout from the wedge could lead to a significant upward movement in price. The Bullish Falling Wedge is a positive indicator, signaling a potential price surge. Investors are showing optimism about TAOUSDT's future performance. The current price may present a buying opportunity. Reaching the target price would result in substantial returns for investors. TAOUSDT is positioned for a potential breakout and significant gains.

Updated LTCLTC was unable to maintain its support zone and has now reached lower price levels and it continues.

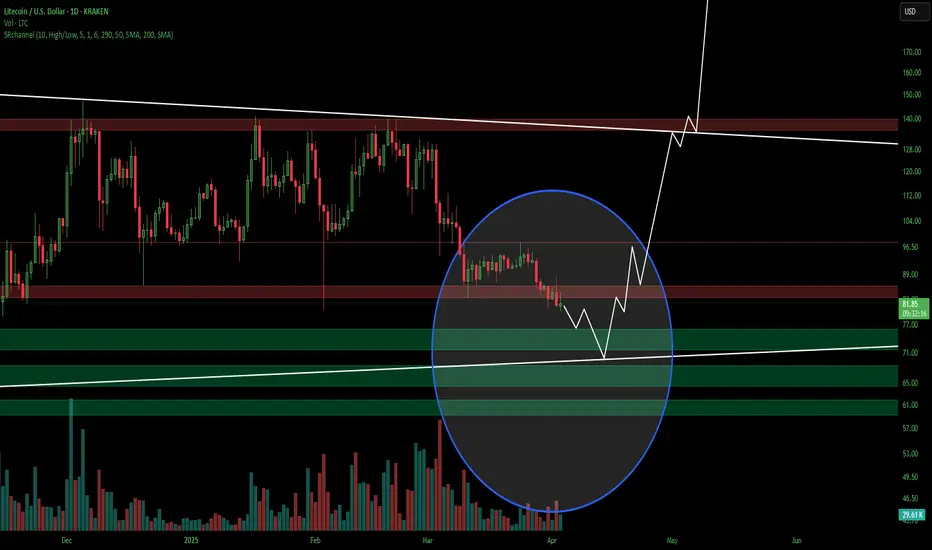
Litecoin LTCUSD Completing Final Leg Down Before LaunchAs you can see Litecoin is forming a very similar pattern. I think the rest of March will be corrective. Litecoin will likely come down and bounce off the trend line which coincidental also is a major support level. April will be slightly bullish, May and June will be majorly bullish which I believe Bitcoin will also fly up to 140k as well in this time. I believe Litecoin will outperform the majority of the market. Major hyperinflation will begin this summer which will be very positive for crypto. Many cryptos will die in this hyperinflation period. Only some will survive. Dollar is going to crash. Get ready for a wild ride into 2026. People calling for a bear market are ill informed and will kick themselves for selling. This is the beginning of the biggest run in some cryptos, we've ever seen. Buckle up. Good luck. Not financial advice.


Litecoin: Your Altcoin ChoiceAn ultra long-term accumulation zone has been activated. Litecoin has been producing higher lows since 2018.
Right now we are looking at a major, major buy opportunity. Likely the lowest price before the start of the 2025 bull-market.
Litecoin just activated its 2022-2024 buy-accumulation-support zone. A very long, wide and strong zone.
I don't think there is much to say about Litecoin other than the time is right and the time is ripe. Growth can only happen after the completion of a bearish wave. A bearish wave is exactly what is seen on the chart now between December '24 and present day, with the bottom being hit just two days ago on April 7. This is no "bear market" as Litecoin has been sideways long-term as it can be seen clearly on this chart.
Long-term consolidation can only happen for so long. Litecoin bottomed in June 2022, almost three years and a half ago. This is the longest accumulation phase ever, and this in-turn will produce a bull market that is equally strong.
A new All-Time High is definitely on the cards for this year. This is true for Litecoin as it is true for Bitcoin, Ethereum, Cardano and most of the Altcoins market.
It is still early though and I know it is easy to doubt, and this is ok. But this long-term view of the chart leaves no room for doubt, the market has been rising from its base. Long-term higher lows, since December 2018, a signal of strength. The last bullish jump was the "initial bullish breakout," it tends to happen before the bull market phase.
The bull market is the cycle when everything grows.
A bull market tends to end in a bull-run.
A bull-run means euphoria across the market. Maximum bullish momentum accompanied with maximum growth.
We are getting so close now. We are looking good and we are looking up.
My recommendation stays, buy and hold.
Go all-in 100% Crypto.
Plan ahead if you decide to trade anything other than spot.
Spot is an easy buy and hold focusing on the long-term.
Leverage (margin) can be more complex and everything can be lost with a mistake. If you have any doubts, do not use this system for now. Only use it with profits or money to spare.
Right now is the time to secure very good and strong entry prices before the best since 2021. It will be amazing.
Thank you for reading.
Litecoin, a great Altcoin Choice!
Namaste.

LTCUSDT 1WLTC ~ 1W Analysis
#LTC Buy gradually when re -testing this support with a short -term target of at least 15%+.

LTC Holding Key Support Zone Within Multi-Year RangeCRYPTOCAP:LTC is currently trading within a well-defined wide range, bound by a strong support zone near $63 and a resistance zone around $130–$140. The price has once again bounced from a rising support trendline that has held firm since 2020, confirming its significance as a long-term bullish structure.
Each time price approached this rising trendline within the support zone, it has historically led to a reversal or a strong upward move. Currently, LTC is showing signs of support around this zone again, suggesting the potential for another bounce.
However, the range-bound nature of the chart implies that until a breakout above resistance or breakdown below support occurs.
DYOR, NFA
#LTCUSDT #Litecoin

LTC/USDT: at important resistance Until the price closes below 100, the current trend structure suggests a one more leg down toward the 76–70 macro support zone.
However, if the price successfully clears the 100 resistance level - rising and closing above it with strong volume - the odds will shift in favor of a correction ending and the potential start of a new uptrend toward the 210–270 macro resistance zone.
Macro-structure:
Thank you for your attention!

Litecoin Approaching Resistance: 20% Drop to $70 Support ExpecteHello and greetings to all the crypto enthusiasts, ✌
Let’s dive into a full analysis of the upcoming price potential for Litecoin 🔍📈.
Litecoin is situated within a parallel channel and is nearing an important trendline and resistance zone. Given the current market conditions, I foresee a potential correction of approximately 20%, with a key support level at $70. This price point not only holds psychological significance but also acts as a crucial technical support area.📚🙌
🧨 Our team's main opinion is: 🧨
Litecoin is near a key trendline and resistance, and I expect a 20% drop to $70, a strong support level with psychological significance.📚🎇
Give me some energy !!
✨We invest hours crafting valuable ideas, and your support means everything—feel free to ask questions in the comments! 😊💬
Cheers, Mad Whale. 🐋

LTCUSD Litecoin OH NO TARIFFS! Everyone SELL NOW!The market reacted to the tariffs negatively as expected. I don't think these tariffs will last long. Countries will cave and remove their tariffs. Bottom line is they need us more than we need them. Once global free and easier trade starts you're going to see a boom cycle like never before. This is the bottom and the beginning of the biggest bull run you'll ever see. I don't get involved in politics but this move that Trump made with the tariffs is going to be a major positive for the USA and the world moving forward. This isnt 1929, we live in a much more advanced world now. Collapses and depressions are a thing of the past in my opinion.
As for Litecoin I see it coming down to test around $70 dollars by the middle of April. This is also timed almost perfectly to the 2017 run Litecoin had, coincidentally trump was starting his first term in 2017 as well. Also timed perfectly to when tax day is over for USA.
Many have capitulated and sold everything thinking a giant recession is coming, or a war, or a collapse, or aliens, or you name it people are scared of their own shadows lately. Like a plague of Grackles where one gets spooked and the whole lot of them get scared and take off when they dont even know why. This is how the markets work though, most will make the wrong decision so the few who made the right decision can profit from their mistakes. Once the market starts to run again those who sold will think its just a fake pump or dead cat bounce and wont buy in. Then the market will continue to rise and rise and finally when its near an all time high those who capitulated and sold early will fomo back in and buy the top to provide liquidity for those who were called crazy for buying the bottom. Its a cycle thats been happening since markets started.
So Im sticking with my predictions for Litecoin, I am not falling for this bear trap crap. Im doubling down. This is not financial advice. This is just my opinion.
LTC/USD "Litecoin vs U.S.Dollar" Crypto Heist (Scalping/Day)🌟Hi! Hola! Ola! Bonjour! Hallo! Marhaba!🌟
Dear Money Makers & Thieves, 🤑 💰🐱👤✈️
Based on 🔥Thief Trading style technical and fundamental analysis🔥, here is our master plan to heist the LTC/USD "Litecoin vs U.S.Dollar" Crypto market. Please adhere to the strategy I've outlined in the chart, which emphasizes long entry. Our aim is the high-risk Yellow MA Level. Risky level, overbought market, consolidation, trend reversal, trap at the level where traders and bearish robbers are stronger. 🏆💸"Take profit and treat yourself, traders. You deserve it!💪🏆🎉
Entry 📈 : "The heist is on! Wait for the MA breakout (85.00) then make your move - Bullish profits await!"
however I advise to Place Buy stop orders above the Moving average (or) Place buy limit orders within a 15 or 30 minute timeframe most recent or swing, low or high level after the MA breakout.
📌I strongly advise you to set an "alert (Alarm)" on your chart so you can see when the breakout entry occurs.
Stop Loss 🛑: "🔊 Yo, listen up! 🗣️ If you're lookin' to get in on a buy stop order, don't even think about settin' that stop loss till after the breakout 🚀. You feel me? Now, if you're smart, you'll place that stop loss where I told you to 📍, but if you're a rebel, you can put it wherever you like 🤪 - just don't say I didn't warn you ⚠️. You're playin' with fire 🔥, and it's your risk, not mine 👊."
📌Thief SL placed at the nearest/swing low or high level Using the 30m timeframe (81.00) Day trade basis.
📌SL is based on your risk of the trade, lot size and how many multiple orders you have to take.
Target 🎯:
✂Primary Target - 88.70
✂Secondary Target - 93.00
LTC/USD "Litecoin vs U.S.Dollar" Crypto Market Heist Plan (Day / Scalping Trade) is currently experiencing a bullishness,., driven by several key factors.👇
📰🗞️Get & Read the Fundamental, Macro, COT Report, On Chain Analysis, Sentimental Outlook, Intermarket Analysis, Future trend targets.. go ahead to check 👉👉👉🔗
⚠️Trading Alert : News Releases and Position Management 📰 🗞️ 🚫🚏
As a reminder, news releases can have a significant impact on market prices and volatility. To minimize potential losses and protect your running positions,
we recommend the following:
Avoid taking new trades during news releases
Use trailing stop-loss orders to protect your running positions and lock in profits
💖Supporting our robbery plan 💥Hit the Boost Button💥 will enable us to effortlessly make and steal money 💰💵. Boost the strength of our robbery team. Every day in this market make money with ease by using the Thief Trading Style.🏆💪🤝❤️🎉🚀
I'll see you soon with another heist plan, so stay tuned 🤑🐱👤🤗🤩

LTC ANALYSIS (support & resistance)🔮 #LTC Analysis 🚀🚀
💲💲 #LTC is trading between support and resistance area. There is a potential rejection again from its resistance zone and pullback from its major support area. If #LTC sustains above major support area then we will a bullish move till its major resistance area
💸Current Price -- $82.20
⁉️ What to do?
- We have marked crucial levels in the chart . We can trade according to the chart and make some profits. 🚀💸
#LTC #Cryptocurrency #DYOR

"Litecoin vs U.S Dollar" Crypto Market Heist Plan (Swing Trade)🌟Hi! Hola! Ola! Bonjour! Hallo! Marhaba!🌟
Dear Money Makers & Robbers, 🤑 💰💸✈️
Based on 🔥Thief Trading style technical and fundamental analysis🔥, here is our master plan to heist the LTC/USD "Litecoin vs U.S Dollar" Crypto Market. Please adhere to the strategy I've outlined in the chart, which emphasizes long entry. Our aim is the high-risk Red Zone. Risky level, overbought market, consolidation, trend reversal, trap at the level where traders and bearish robbers are stronger. 🏆💸"Take profit and treat yourself, traders. You deserve it!💪🏆🎉
Entry 📈 : "The heist is on! Wait for the MA breakout (96.00) then make your move - Bullish profits await!"
however I advise to Place Buy stop orders above the Moving average (or) Place buy limit orders within a 15 or 30 minute timeframe most recent or swing, low or high level.
📌I strongly advise you to set an alert on your chart so you can see when the breakout entry occurs.
Stop Loss 🛑:
Thief SL placed at the recent/swing low level Using the 2H timeframe (86.00) swing trade basis.
SL is based on your risk of the trade, lot size and how many multiple orders you have to take.
🏴☠️Target 🎯: 111.00 (or) Escape Before the Target
🧲Scalpers, take note 👀 : only scalp on the Long side. If you have a lot of money, you can go straight away; if not, you can join swing traders and carry out the robbery plan. Use trailing SL to safeguard your money 💰.
LTC/USD "Litecoin vs U.S Dollar" Crypto Market Heist Plan (Swing Trade) is currently experiencing a bullishness,., driven by several key factors.
📰🗞️Get & Read the Fundamental, Macro, COT Report, On Chain Analysis, Sentimental Outlook, Intermarket Analysis, Future trend targets.. go ahead to check 👉👉👉
📌Keep in mind that these factors can change rapidly, and it's essential to stay up-to-date with market developments and adjust your analysis accordingly.
⚠️Trading Alert : News Releases and Position Management 📰 🗞️ 🚫🚏
As a reminder, news releases can have a significant impact on market prices and volatility. To minimize potential losses and protect your running positions,
we recommend the following:
Avoid taking new trades during news releases
Use trailing stop-loss orders to protect your running positions and lock in profits
💖Supporting our robbery plan 💥Hit the Boost Button💥 will enable us to effortlessly make and steal money 💰💵. Boost the strength of our robbery team. Every day in this market make money with ease by using the Thief Trading Style.🏆💪🤝❤️🎉🚀
I'll see you soon with another heist plan, so stay tuned 🤑🐱👤🤗🤩

ATOMUSDT UPDATEATOMUSDT is a cryptocurrency trading at $4.700, with a target price of $7.500. This represents a potential gain of over 60%. The technical pattern observed is a Bullish Falling Wedge, indicating a possible trend reversal. This pattern suggests that the downward trend may be coming to an end. A breakout from the wedge could lead to a significant upward movement in price. The Bullish Falling Wedge is a positive indicator, signaling a potential price surge. Investors are showing optimism about ATOMUSDT's future performance. The current price may present a buying opportunity. Reaching the target price would result in substantial returns for investors. ATOMUSDT is positioned for a potential breakout and significant gains.

CFXUSDT UPDATECFXUSDT is a cryptocurrency trading at $0.0788, with a target price of $0.1400. This represents a potential gain of over 80%. The technical pattern observed is a Bullish Falling Wedge, indicating a possible trend reversal. This pattern suggests that the downward trend may be coming to an end. A breakout from the wedge could lead to a significant upward movement in price. The Bullish Falling Wedge is a positive indicator, signaling a potential price surge. Investors are showing optimism about CFXUSDT's future performance. The current price may present a buying opportunity. Reaching the target price would result in substantial returns for investors. CFXUSDT is positioned for a potential breakout and significant gains.

LONG Position LTC/USDT#Singal
LTC/USDT
🟢 LONG Position
🎲 Entry1 @ 76.19
🎲 Entry2 @ 74.62
✅ Target1@ 79.35
✅ Target2 @ 84.66
✅ Target3 @ 91.46
✅ Target4 @ 104.39
❌ Stop Loss @ 69.56
Leverage: 5X_15X
Margin: 10% of Wallet Balance
⚠️"Take Care of Risk Management for Your Account"

Litecoin $LTC to 109$?⚠️ RISK TRADE ⚠️
👑 #LTC/USDT BUY 👑
Entry price:
91 🟩
Targets:
1️⃣ 97🎯
2️⃣100🎯
3️⃣106🎯
4️⃣109🎯

LTCUSDT Breakout Loading….BINANCE:LTCUSDT has been consolidating for several days, repeatedly testing resistance levels. This pattern suggests a potential breakout is on the horizon. With ETH already gaining momentum, Litecoin could follow suit. Once the market starts moving, plenty of trading opportunities may arise.
Trade Smart: Always use a stop loss and manage your risk effectively.
BINANCE:LTCUSDT Currently trading at $91.5
Buy level: Above $91
Stop loss: Below $83
Target : $130
Max Leverage 3x
Always keep Stop loss
Follow Our Tradingview Account for More Technical Analysis Updates, | Like, Share and Comment Your thoughts

DOTUSDT IDEADOTUSDT is a cryptocurrency trading at $4.415. Its target price is $7.500, indicating a potential 70%+ gain. The pattern is a Bullish Falling Wedge, a reversal pattern signaling a trend change. This pattern suggests the downward trend may be ending. A breakout from the wedge could lead to a strong upward move. The Bullish Falling Wedge is a positive signal, indicating a potential price surge. Investors are optimistic about DOTUSDT's future performance. The current price may be a buying opportunity. Reaching the target price would result in significant returns. DOTUSDT is poised for a potential breakout and substantial gains.

LTC Ready for PUMP or what ?The price can encounter a strong pump after declining to the bottom of the triangle, and after breaking the triangle, it can reach the desired targets.
Give me some energy !!
✨We spend hours finding potential opportunities and writing useful ideas, we would be happy if you support us.
Best regards CobraVanguard.💚
_ _ _ _ __ _ _ _ _ _ _ _ _ _ _ _ _ _ _ _ _ _ _ _ _ _ _ _ _ _ _ _
✅Thank you, and for more ideas, hit ❤️Like❤️ and 🌟Follow🌟!
⚠️Things can change...
The markets are always changing and even with all these signals, the market changes tend to be strong and fast!!

GMXUSDT UPDATEGMXUSDT is a cryptocurrency trading at $15.52. Its target price is $30.00, indicating a potential 90%+ gain. The pattern is a Bullish Falling Wedge, a reversal pattern signaling a trend change. This pattern suggests the downward trend may be ending. A breakout from the wedge could lead to a strong upward move. The Bullish Falling Wedge is a positive signal, indicating a potential price surge. Investors are optimistic about GMXUSDT's future performance. The current price may be a buying opportunity. Reaching the target price would result in significant returns. GMXUSDT is poised for a potential breakout and substantial gains.

Litecoin is in a bearish cycle (12H)From the point where we placed an arrow on the chart, it appears that Litecoin's complex correction has begun.
Currently, we seem to be in wave C of this correction.
Wave C, based on the 3D structure, could end at demand 1, leading to wave D, which is a bullish wave.
However, ultimately, wave E could conclude within the demand 2 zone.
Liquidity pools for waves C and E are marked on the chart, and it is expected that each will be swept in turn.
For risk management, please don't forget stop loss and capital management
Comment if you have any questions
Thank You
