LUNAUSDT UPDATELUNAUSDT is a cryptocurrency trading at $0.1946. Its target price is $0.3500, indicating a potential 85%+ gain. The pattern is a Bullish Falling Wedge, a reversal pattern signaling a trend change. This pattern suggests the downward trend may be ending. A breakout from the wedge could lead to a strong upward move. The Bullish Falling Wedge is a positive signal, indicating a potential price surge. Investors are optimistic about LUNAUSDT's future performance. The current price may be a buying opportunity. Reaching the target price would result in significant returns. LUNAUSDT is poised for a potential breakout and substantial gains.
LTCUSDT

TAOUSDT UPDATETAOUSDT is a cryptocurrency trading at $263.8. Its target price is $360.0, indicating a potential 45%+ gain. The pattern is a Bullish Falling Wedge, a reversal pattern signaling a trend change. This pattern suggests the downward trend may be ending. A breakout from the wedge could lead to a strong upward move. The Bullish Falling Wedge is a positive signal, indicating a potential price surge. Investors are optimistic about TAOUSDT's future performance. The current price may be a buying opportunity. Reaching the target price would result in significant returns. TAOUSDT is poised for a potential breakout and substantial gains.

OMUSDT UPDATEOMUSDT is a cryptocurrency trading at $6.2800. Its target price is $8.0000, indicating a potential 25%+ gain. The pattern is a Bullish Falling Wedge, a reversal pattern signaling a trend change. This pattern suggests the downward trend may be ending. A breakout from the wedge could lead to a strong upward move. The Bullish Falling Wedge is a positive signal, indicating a potential price surge. Investors are optimistic about OMUSDT's future performance. The current price may be a buying opportunity. Reaching the target price would result in significant returns. OMUSDT is poised for a potential breakout and substantial gains.

Short Term Could Drop Be Careful Here - Possible $100Some bad news came out. Bybit got hacked for a lot of Ethereum. How this happens I dont understand but more than likely an inside job. These run out a basement exchanges are dangerous never leave your crypto on an exchange, NONE OF THEM.
Anyways I dont like the break of this rising wedge or potential bear flag. If this deosnt break back into the wedge and close in it then we could se another drop to about 100 or so if the measured move plays out. Be cautious here.
Not Financial advice.

LTCUSDT 1WLTC ~ 1W Analysis
#LTC This support block continues to be maintained so far.
Buy gradually from here with a minimum target of 20%+.

LTC Long OpportunityMarket Context:
LTC is testing the range's low support level, which presents a strong buying opportunity if support holds. A potential bounce from this level could lead to a move toward the next resistance zones.
Trade Details:
Entry Zone: $102.00
Take Profit Targets:
$109.00 - $115.00
$132 - $140
Stop Loss: Just below $98.00
This setup offers a good risk-to-reward ratio, making it an attractive trade for a possible reversal. 🚀

LTCWaiting for the final wave C of the zigzag to complete. For further growth, it is crucial not to break the low of wave Y.
It's possible the zigzag is already finished, leading to an uptrend from here.

LTCUSDT on the Edge – Major Breakdown or Fakeout?Yello, Paradisers! Is LTCUSDT on the verge of a major drop? The signs are stacking up, and if you’re not watching closely, you could miss a big move.
💎Right now, LTCUSDT is looking bearish as it forms an M-pattern near the resistance trendline of a descending channel. At the same time, a bearish divergence is confirming the weakness in momentum. On top of that, we’re seeing a triple-three wave pattern playing out, which further increases the probability of a downside move. All these signals combined suggest that sellers are gaining control.
💎If LTCUSDT breaks down and closes candle below the support level, the M-pattern will be validated, opening the door for a significant move lower.
💎However, if the price consolidates around this level without breaking down, the setup loses its strength, and in that case, it’s best to ignore it as a low-probability trade.
💎On the flip side, if LTCUSDT manages to break out and close candle above the resistance zone, the entire bearish outlook would be invalidated. In that scenario, waiting for fresh price action before making any moves would be the smartest approach.
🎖 Discipline and patience separate the pros from the amateurs. Stay sharp, Paradisers—trade only high-probability setups, and you’ll always stay ahead of the game!
MyCryptoParadise
iFeel the success🌴

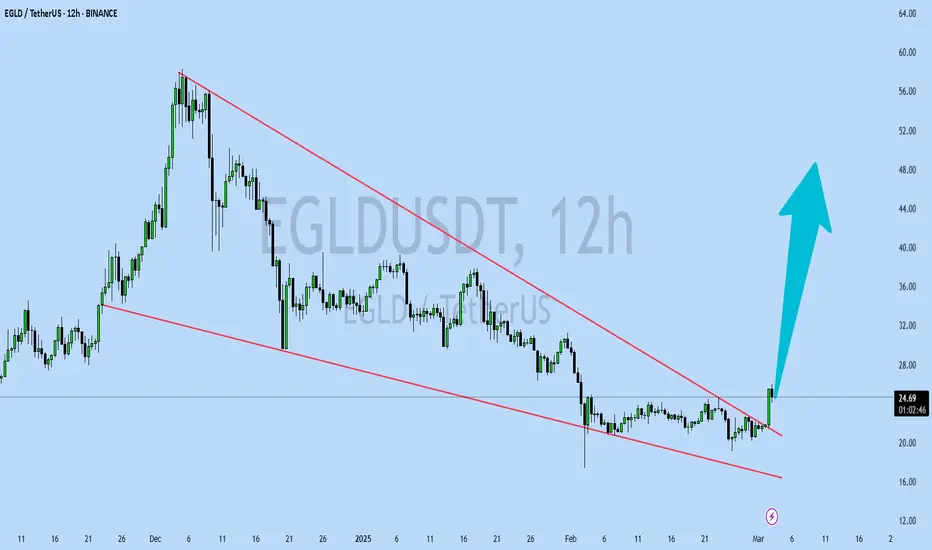
EGLDUSDT UPDATEEGLDUSDT is a cryptocurrency trading at $24.65. Its target price is $48.00, indicating a potential 90%+ gain. The pattern is a Bullish Falling Wedge, a reversal pattern signaling a trend change. This pattern suggests the downward trend may be ending. A breakout from the wedge could lead to a strong upward move. The Bullish Falling Wedge is a positive signal, indicating a potential price surge. Investors are optimistic about EGLDUSDT's future performance. The current price may be a buying opportunity. Reaching the target price would result in significant returns. EGLDUSDT is poised for a potential breakout and substantial gains.
COTIUSDT UPDATECOTIUSDT is a cryptocurrency trading at $0.08793. Its target price is $0.15000, indicating a potential 80%+ gain. The pattern is a Bullish Falling Wedge, a reversal pattern signaling a trend change. This pattern suggests the downward trend may be ending. A breakout from the wedge could lead to a strong upward move. The Bullish Falling Wedge is a positive signal, indicating a potential price surge. Investors are optimistic about COTIUSDT's future performance. The current price may be a buying opportunity. Reaching the target price would result in significant returns. COTIUSDT is poised for a potential breakout and substantial gains.

LTC/USDTDespte the market correction Ltc$ held up really well. with almost 100 days of cosolidation in this price range.
Entry:$130-$120
Target: $200-$300

The key is to rise near 134.91
Hello, traders.
If you "Follow", you can always get new information quickly.
Please also click "Boost".
Have a nice day today.
-------------------------------------
(LTCUSDT 1M chart)
The key is to maintain the price above the M-Signal indicator on the 1M chart and rise above 163.89.
-
(1W chart)
Since the M-Signal on the 1W chart > M-Signal on the 1M chart has changed, if the price maintains above the M-Signal indicator on the 1W chart, it is expected to maintain an upward trend.
Accordingly, the key is whether it can maintain the uptrend by receiving support near 95.73-102.34.
-
(1D chart)
In order to maintain the uptrend, the key is whether it can maintain the price by rising above the Fibonacci ratio point of 0.618 (133.53).
If not,
1st: 113.39-117.30
2nd: 95.73-102.34
We need to look at whether it receives support near the 1st and 2nd points above.
Based on the current price position, I think the start of a full-scale uptrend is likely to begin when it rises above the HA-High indicator point of 163.89 on the 1M chart.
-
Thank you for reading to the end.
I hope you have a successful trade.
--------------------------------------------------
- Big picture
I used TradingView's INDEX chart to check the entire range of BTC.
(BTCUSD 12M chart)
Looking at the big picture, it seems to have been maintaining an upward trend following a pattern since 2015.
In other words, it is a pattern that maintains a 3-year upward trend and faces a 1-year downward trend.
Accordingly, the upward trend is expected to continue until 2025.
-
(LOG chart)
Looking at the LOG chart, you can see that the upward trend is decreasing.
Accordingly, the 46K-48K range is expected to be a very important support and resistance range from a long-term perspective.
Therefore, I expect that we will not see prices below 44K-48K in the future.
-
The Fibonacci ratio on the left is the Fibonacci ratio of the uptrend that started in 2015.
That is, the Fibonacci ratio of the first wave of the uptrend.
The Fibonacci ratio on the right is the Fibonacci ratio of the uptrend that started in 2019.
Therefore, this Fibonacci ratio is expected to be used until 2026.
-
No matter what anyone says, the chart has already been created and is already moving.
It is up to you how to view and respond to it.
Since there is no support or resistance point when the ATH is updated, the Fibonacci ratio can be appropriately utilized.
However, although the Fibonacci ratio is useful for chart analysis, it is ambiguous to use it as a support and resistance role.
The reason is that the user must directly select the important selection points required to create the Fibonacci.
Therefore, it can be useful for chart analysis because it is expressed differently depending on how the user specifies the selection point, but it can be seen as ambiguous for use in trading strategies.
1st: 44234.54
2nd: 61383.23
3rd: 89126.41
101875.70-106275.10 (when overshooting)
4th: 134018.28
151166.97-157451.83 (when overshooting)
5th: 178910.15
-----------------

LTCUSDT LONG 1H (Update/Results)From the main review, in which I indicated personal expectations, new market variables arrived both in terms of goals and entry.
On the 1D chart, the price interacted with the key area of interest (poi), removed the liq of the nearest min. and hit the order block 15m TF
New goal on CHoCH target, has been achieved.
stop moved to profit!

UniversOfSignals | LTCUSDT Let's go for spot buying?👋 Welcome to UniversOfSignals Channel!
Let's go together to analyze and review Litecoin analysis, one of the oldest coins in the market, and let's go to update the triggers of the previous analysis!
🌐 Overview Bitcoin
Before starting today's altcoin analysis, let's look at Bitcoin on the 1-hour timeframe. Since yesterday, Bitcoin experienced a correction, which was necessary for the market, and it pulled back to the 102135 range. The next trigger for a long position will be a breakout above 104714.
Yesterday's correction, coupled with an increase in Bitcoin dominance, caused noticeable declines in some altcoins. This highlights the importance of monitoring BTC pairs in your checklist these days.
📊 Weekly Timeframe
On the weekly time frame, it is one of the coins that is in a good position compared to the coins and has had the least correction in recent declines and is in this position due to the possibility of ETF approval
There is no need to complicate things in this time frame and after the break of 136.45, we will buy and be above 98.44. This trigger is valid and we do not have much of an exit trigger for the conditions of these days on this chart and for now it is better to continue holding
📈 Daily Timeframe
On the daily time frame, we are also in a good position and we had a good return after the recent market decline due to the Bybit hack and Trump's tariffs and this is a good thing!
After breaking the 75.01 level and exiting the daily box and breaking its ceiling, we moved up to the resistance of 136.45 and are now fluctuating between the 98.44 to 136.45 boxes.
We also had a curve line in this time frame that was a good support for this event and every time we hit it, we made a good move upwards, but after its failure, it can be said that the upward trend moved into the range and went to form a new structure.
To buy spot after the 136.45 trigger is broken, we can buy for spot with a stop loss of 98.44 and as long as we are above 114.38, the 136.45 trigger is very important for us and it shows us more the strength of buyers and in case of a 98.44 break, we will go for 89 and 80 and we will have a price correction.
📝 Final Thoughts
Stay calm, trade wisely, and let's capture the market's best opportunities!
This analysis reflects our opinions and is not financial advice.
Share your thoughts in the comments, and don’t forget to share this analysis with your friends!

TradeCityPro | LTCUSDT Let's go for spot buying?👋 Welcome to TradeCityPro Channel!
Let's go together to analyze and review Litecoin analysis, one of the oldest coins in the market, and let's go to update the triggers of the previous analysis!
🌐 Overview Bitcoin
Before starting today's altcoin analysis, let's look at Bitcoin on the 1-hour timeframe. Since yesterday, Bitcoin experienced a correction, which was necessary for the market, and it pulled back to the 102135 range. The next trigger for a long position will be a breakout above 104714.
Yesterday's correction, coupled with an increase in Bitcoin dominance, caused noticeable declines in some altcoins. This highlights the importance of monitoring BTC pairs in your checklist these days.
📊 Weekly Timeframe
On the weekly time frame, it is one of the coins that is in a good position compared to the coins and has had the least correction in recent declines and is in this position due to the possibility of ETF approval
There is no need to complicate things in this time frame and after the break of 136.45, we will buy and be above 98.44. This trigger is valid and we do not have much of an exit trigger for the conditions of these days on this chart and for now it is better to continue holding
📈 Daily Timeframe
On the daily time frame, we are also in a good position and we had a good return after the recent market decline due to the Bybit hack and Trump's tariffs and this is a good thing!
After breaking the 75.01 level and exiting the daily box and breaking its ceiling, we moved up to the resistance of 136.45 and are now fluctuating between the 98.44 to 136.45 boxes.
We also had a curve line in this time frame that was a good support for this event and every time we hit it, we made a good move upwards, but after its failure, it can be said that the upward trend moved into the range and went to form a new structure.
To buy spot after the 136.45 trigger is broken, we can buy for spot with a stop loss of 98.44 and as long as we are above 114.38, the 136.45 trigger is very important for us and it shows us more the strength of buyers and in case of a 98.44 break, we will go for 89 and 80 and we will have a price correction.
📝 Final Thoughts
Stay calm, trade wisely, and let's capture the market's best opportunities!
This analysis reflects our opinions and is not financial advice.
Share your thoughts in the comments, and don’t forget to share this analysis with your friends!

Litecoin Update Including 1,300% Target From Bottom-UpThis is Litecoin on the weekly timeframe and nothing changes; super, hyper bullish.
First, notice the volume, it continues to rise. The last two weeks produced the highest volume ever and this is the best signal you can find. Volume is the most important signal to confirm the validity of a move.
Second, notice the current weekly candle. There is a very long lower wick (shadow), and the action moves back above support. This is a very strong signal, why? There was much selling, really strong selling pressure but buyers showed up and bought everything. If the week closes at current price, we have a bullish signal in the form of a hammer. If it closes higher, even a stronger bullish signal. If it closes lower, the bullish bias remains intact because the action is very strong compared to the early February wick low.
The early February low hit $80. Litecoin is currently trading at $127.
I updated this chart to show more long-term, real and reasonable, targets. We have a target around $450 for 250% and another one at $707 for more than 450%. Now, this potential is because Litecoin is already pretty advanced in its bullish cycle since it has been growing since August 2024.
If we consider growth potential but starting from the market bottom, we are looking at 800% and 1,300% or more. It is likely that Litecoin will peak much higher, but we have time to adapt to how far high prices will go. Right now, the wise move is to buy and hold.
Buy and hold will take care of everything. Leverage can be used but it should be very low. It is better to earn a safe and secure 500%, than to go for a risky 5,000% and lose everything along the way. Don't get me wrong, leverage trading is an amazing tool but it should be used with caution. If you are buying Crypto to change your life, to live in abundance and be rich, you are better up buying and holding and increasing your money slowly but surely. In 2025 we will all win.
Thank you for coming back and for deciding to read.
It is my pleasure to write for you.
Thanks a lot for your support.
Namaste.

LTC/USD Secondary trend (part). 09 12 2023Logarithm. Time frame 1 day. Part of the secondary trend. Channel to work, price consolidation in its lower part. A high probability of an upward exit from it. Key levels are shown by arrows. Percentages for clarity and target orientation similarly.
This is how it looks like on a line chart without "market noise". .
Double bottom with a flat top in an accumulation channel. Post-halving time.
A local uptrending channel that has a double bottom with a flat top. This is a strong bullish pattern that says price is (this accumulation zone) at the lows of the trend initiation. The last cycle after the capitulation (end of the participation phase) of all liquid instruments (this is important) began with this structure, which is a display of the actions, first of all, of large market participants that have an impact on pricing (holding). For example, look at the bitcoin 2020 chart and this structure. Similar to what happened on LTC a few months after the halving.
Major trend. Cycles. Super profits.
LTC is a cryptocurrency that has survived many cycles and has not depreciated completely, although it can be seen that the capitalization and leadership positions are not able to compete with the new 2 cycle HYIP giants.
From the position of the cycle before last (distributions, i.e. highs) 2017, this cryptocurrency is on a big super profit. There are very few cryptocurrencies in the crypto market that are in their main trend in an uptrend and are on super profits relative to previous cycles. LTC is one of them. As a rule, the opposite is true. It is clear that the main major holders in most cases for such a long period of existence in the crypto market, LTC has already been repeatedly changed. But with this logic of the price chart, which is displayed on a long history and on a large time frame, should be considered and taken into account in its risk management.
Major trend. Time frame 1 month.

LTC/USD Main trend. Halving. Cycles The psychology of repetitionMain trend. The graph is logarithmic. The timeframe is 1 month. This idea is relevant both for understanding the secondary trend work and as a training in simple cyclic, logical manipulation processes. Note also the halving of the LTC and the designated time zones between cycles.
The primary trend is an uptrend in which a huge butterfly is forming (forming part 2)
Secondary trend is a downward channel.
Local trend in the secondary trend is a wedge.
Coin in the coin market : Litecoin
The chart is taken from the Bitfiniex exchange, I used it because of the long price history (the coin has been traded on this exchange for a long time). Of course, the chart is relevant for all exchanges with liquidity. The coin and the pair are liquid, it is acceptable to set large positions. The price behavior is predictable. Ups/Downs are similar. Let's consider them below.
Everything is unpredictable only for absolutely predictable people, it always was, is and will be.
Same time frame on a line chart (no market noise, pure trend direction)
A close-up of this area on the line chart.
And this area on the candlestick chart.
What matters is the average buy/sell. Approach the market regardless of the size of your deposit as a major market participant. Stop thinking like a "hamster". You don't need to guess, you need to know and be prepared for any outcome, even unlikely scenarios.
Psychology of behavior in the market.
Expectation. Reality. "Stop-loss resets. Cyclicality of predictable behavior. .
Predictable price behavior. "Knockouts" of obedient (acting by the rules) and naughty (acting on emotion) fools are as logical and predictable as anything else everywhere else. Increase your knowledge and experience, and it won't affect you.
Remember, theory without practice is nothing. Real trading is very different from theory, you should understand that. That's why all "programmed traders" lose money or their earnings are quite modest.
You should not ask anyone where to buy/sell this or that crypto-asset. You should initially know yourself under what conditions you will buy and under what conditions you will sell.
Past "stop-losses" before secondary trend reversals .
Secondary trend reversal zones and "takeout" before pullbacks in 2019 (+450 average) and 2021 (+900% average).
Candlestick chart. 3-day timeframe. Fear peak zones.
Line chart. Three-day timeframe. Fear peak zones. (without market noise).
As we can see, this "fear peak" on the line chart evaporates, all these local "super resets" have no effect on the trend. It's just the "death of hamsters." The capitulation of human stupidity and greed. You can add predictability and submissiveness to this. The train always leaves without such marketable characters.
Such always sell (fear) at the lowest prices, shortly before the trend reverses. It is worth adding that they buy at the highest prices "at the behest" of the pump to get fabulously "rich. This makes the cryptocurrency market super profitable. Such fuel is the basis of profit. "Market fuel flows" lend themselves to cycles.
Price management is the psychology and manipulation of people's minds through basic instincts through price values. All of this is real and as old as the world. A foolish person keeps stepping on the same rake, each time telling himself that this is the last time, or this is a special case.
This "last case" must be repeated systematically, but in different conditions that you create. Your effectiveness depends on how masterful you are at forming such obsessive thoughts in the mind of such market characters.
Fundamentals of Trading. Trading strategy. Capital management. Price forecasting.
It is your trading strategy and money management, based on your experience, that is the basis of trading, not guessing the price. But guessing is what most people want. Such people should have no money. As a rule, such people in real life are very poor, do not have their own business, go "to work" (do not want to take responsibility).
They think real life doesn't give them many resources, but market speculation will quickly make them fabulously rich. Rather the opposite is true. Total impoverishment regardless of the direction of the trend due to the reinforcement of destructive qualities of a person with financial instruments. The behavior of such people in the market is a projection of what they are like in real life.
The behavior of people in financial markets is a projection of what they are in real life. That is, their positive and negative psychological qualities. You can't run away from yourself. A stupid person will be overtaken by his own stupidity, a greedy person by greed, an intolerant person by intolerance, an indecisive person by indecision, an irresponsible person by irresponsibility.
Such will be punished by their own destructive qualities. The main thing is that the victim draws conclusions from this and it is an incentive to correct the root cause and basis of the failures, rather than looking for the culprit of his own stupidity in "random events" and other people.
You guessed once, second time, third time zeroed in and hit your own self-confidence with your own stupidity and predictability. Consequently, all your previous guesses at the distance equals zero.
Trading is a probability game. It is impossible to guess everything because of the many components of pricing. It is possible not to guess, but to know the more and less potentially realizable probabilities because of certain market conditions.
No one knows the exact future, there is only an assumed more likely future and the work that leads to it.
The basis of profit/loss is what you are in the here and now. Your knowledge and experience are projected onto the chart. The symbiosis of these two parameters makes or loses money in practice.
Read these 6 points carefully:
1) The first problem most marketers have is that everyone wants to get a lot of money in the moment and, most importantly, without effort. That's what most people want, so it's not rational or dangerous to satisfy their desires.
2) The second problem is that they can't be "out of the market" until they find a good entry point. "Fear of missing out" does its destructive work.
3) The third problem is, of course, the disease from "childhood," which manifests itself in adulthood. People begin to collect various crypto coins, endowing them with different values according to their beliefs and, above all, their desires.
4) The fourth problem is greed, insatiability combined with inexperience. People don't want to protect their profits, they want more and more and more and more and more, eventually from greed and inexperience they completely (more greedy) or partially (less greedy) nullify themselves.
5) Lack of knowledge and experience. Lack of desire to develop and learn. The less experienced a market participant is, the more confident he is in his competence and "screams text".
6) The sixth most serious problem - laziness. It manifests itself in the fact that few people want to work, everyone wants to have.
Under ideas are captured my trading ideas for this trading pair over the past 3 years. Most of them are previously closed trade ideas. There are 3 learning ideas that I have shown on this trading pair (based on publicly published simple trading ideas) .

LTC Litecoin Fireworks Are About To Start ETFs Loading UpHello my friends, Im sorry for not being here for a while, my life was very busy over the past year. Im hoping now that things are settled down I can do these charts again regularly.
That aside lets get into Litecoin. Litecoin has been outperforming almost the entire market lately moving from 25th position on Coinmarketcap to now 12th position over the course of just a couple months or so. Litecoin is showing big time strength over all the others. Every day its holding onto more and more of its gains while others are making new lows or lower highs. We are at the apex now. Litecoin must break over $147 and close that candle on at least the 2 day to be confirmed. Once that happens I don't think there will be many pullbacks from there and if there are they will short lived.
The ETFs for Litecoin are really gaining steam. Charlie Lee did an interview back in I believe it was December with The Litecoin Forecast YouTube channel and Charlie was saying that if anyone had large amounts of Litecoin and wanted to help seed the Canary ETF to contact him directly. The ETF is coming 100% there is no question about that. Once these ETFs get approved Litecoin has such an illiquid supply the price of Litecoin will skyrocket so fast and so high it'll leave everyone in disbelief and with their mouths dropped. Miner reserves are at an all time low, so no serious dumping or resistance levels along the way like previous runs. People and institutional buyers are realizing that Litecoin is the second Bitcoin. they realize that Litecoin is THE Altcoin and the rest are just clones, copies and junk. The fact that Litecoin is te most used crypto worldwide and has been for a long time shows that the PEOPLE chose Litecoin over all those other chains to transact in, even over Bitcoin. People are realizing that Litecoin is the better Bitcoin and was made to be that way. There is no denying that Litecoin is the chosen crypto, its provable with on-chain metrics! No hype, no advertising, nothing just pure organic adoption. Thats what make a winner in this space. We dont need a tweet from Elon or constant promises and upgrades to keep Litecoin relevant. Litecoin will move to the #2 spot under Bitcoin.
Once this move starts and Litecoin starts going parabolic you will see the pump chasers and fomo rotating out of the already extremely overvalued trash they bought the top in to get into Litecoin. All the non believers, all the haters, all the wounded who sold angrily, everyone will pile into Litecoin. You will hear a lot of language especially from the haters saying that its just a pump and dump along the way. Eventually they will all change their tune when Litecoin continues to rise and rise and rise and wont stop. Dont be fooled and dont sell early, Litecoin is going to shock the entire world and thats not being dramatic. It will be on every news channel. Big institutions will be talking about it. Blackrock will get in along with all his buddies. Its coming I promise that. I had made my previous predictions not really knowing what the catalyst would be other than the charts and some on-chain data. Now I know why Litecoin will make that move I was predicting. The ETFs are going to bring in a flood of money like no one has see before and the world will realize that Litecoin is Bitcoin #2. The ones who missed Bitcoin at $1000 are going to flood into Litecoin for their chance to get the second faster Bitcoin.
I know I was wrong on the timing of the last predictions I made thinking that maybe it could have happened in 2024. I didnt expect the market to be this drawn out, I dont think anyone did. It is different this time despite what everyone else says. The cycles are getting longer and longer as more and more people enter the space. There isnt a huge rotation from Bitcoin into Alts anymore because now the ETFs are locking it up. No more Alt seasons like we were used to . I believe that my chart showing 13K for Litecoin is just the beginning. Litecoin will be worth 1/4 of Bitcoin in the future. I dont want to say that Litecoin could overtake Bitcoin but it might you never know this market is wild. Litecoin in these next few years and over the course of a couple cycles within this larger cycle we could see Litecoin at $50k each. Once all the money drains out of the overhyped and overacalued trash thats currently out there, they will eventually move into Bitcoin, and Litecoin. Maybe a couple others that are competing for the smart contract side of things but as far as Cryptocurrencies go Litecoin and Bitcoin are the only two that will remain relevant. The rest are just projects and platforms and wanna be Cryptocurrencies all the way down the line. Litecoin is about to create so many millionaires in such a short period of time its going blow everyone's mind.
Eventually Litecoin network will be so busy because of real world use, it'll have to stop mining Doge which is just a leech off the network. Miners wont waste energy on that. Doge will eventually move back down to where it came from. XRP holders will eventually realize that they have been duped into keeping the rich lifestyles of the Ripple team going for so many years on just hype. The meme coins are losing interest. All those holders are going to lose everything, literally. I cant believe how many have their entire investment in these silly Fartcoin, Titcoin and all the other ridiculous coins with zero value. They were fun to make quick money on but they are no longer as profitable and the risk is way higher than the reward now. Frogs, Dogs, Cats, Squirrels all are going to die and go to zero. The crypto market will be wrangled and only the strong will survive. All that capital will flood out of the trash and there will be a mad dash for actually utility. In the Dot com boom there were so many internet companies it was crazy but at the end of it only a few strong ones survived and thrived and became the powerhouses that we see today. Thats exactly what I see for the cryptospace.
Litecoin holders will soon be vindicated!
None of this is financial advice, this is just my opinion.

LTCUSDT 1H LONGOn higher timeframes, the asset forms many liquidity pools and has aggressive market purchases, thereby protecting the break levels of the structure!
Previously, the asset went under the POI range , but returned on good volume with full-bodied candles.
I am considering a long position at the specified price on a trading chart with targets:
$123.69
$131.20
$141.22
Risk management - 1% on stop order

$LTC waking up - targetting $200!It’s been a while since we had a clear signal to long in crypto.
CRYPTOCAP:LTC looks healthy here—trade stays active as long as it holds above 114.
Buying into the 120s down to 116.
Targeting 200.
Both weekly and monthly trends are looking solid, so I’m jumping in just in case it pulls an XRP-like move. The hype might not be there, but I’d be happy with a 2x.
BINANCE:LTCUSDT

LTC analysis (12H)From the point where we placed the red arrow on the chart, it seems that LTC's correction has begun. Due to ETFs, there is a lot of FOMO around this asset, but it's better to analyze it technically.
It appears that LTC is in an ABC correction or a more complex pattern. Currently, it is in wave B, which is forming as a diametric. We can look for buy/long positions in the green zone.
A daily candle closing below the invalidation level will invalidate this analysis.
For risk management, please don't forget stop loss and capital management
Comment if you have any questions
Thank You

TFUELUSDT UPDATETFUELUSDT is a cryptocurrency trading at $0.05370. Its target price is $0.09000, indicating a potential 50%+ gain. The pattern is a Bullish Falling Wedge, a reversal pattern signaling a trend change. This pattern suggests the downward trend may be ending. A breakout from the wedge could lead to a strong upward move. The Bullish Falling Wedge is a positive signal, indicating a potential price surge. Investors are optimistic about TFUELUSDT's future performance. The current price may be a buying opportunity. Reaching the target price would result in significant returns. TFUELUSDT is poised for a potential breakout and substantial gains.
