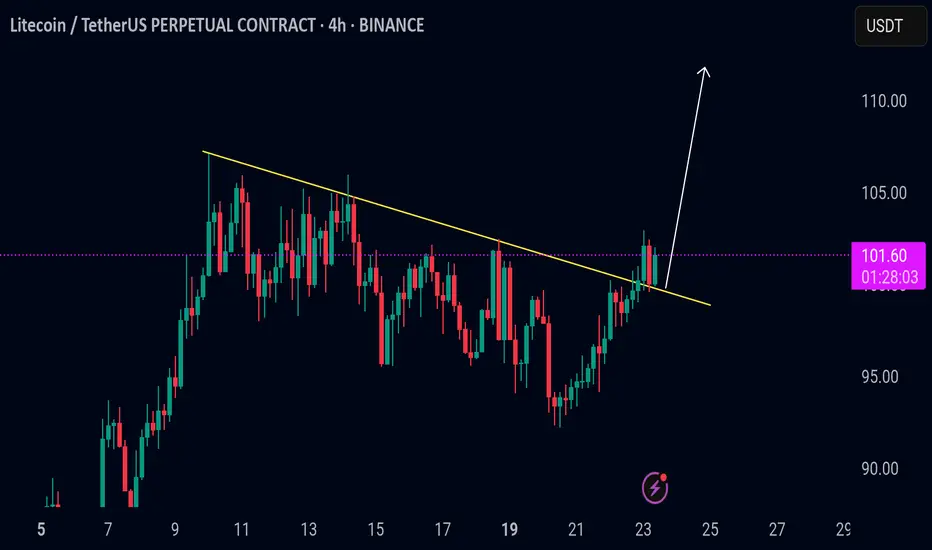
#LTCUSDT: On The Way To $200, Get Ready For Swing Buy! Hey there!
Evening Everyone,
The price of this crypto is currently in a bullish formation, and it looks like it’s on the rise, potentially reaching $200. The best thing you can do is wait for the price to break out of the downtrend and then keep going up. You could set a target at $150 and then $200, which would be a swing move.
Good luck and trade safely! 😊
Thanks a bunch for your unwavering support! ❤️🚀
If you’d like to lend a hand, here are a few ways you can contribute:
- Like our ideas
- Comment on our ideas
- Share our ideas
Cheers,
Team Setupsfx_
Ltcusdtlong

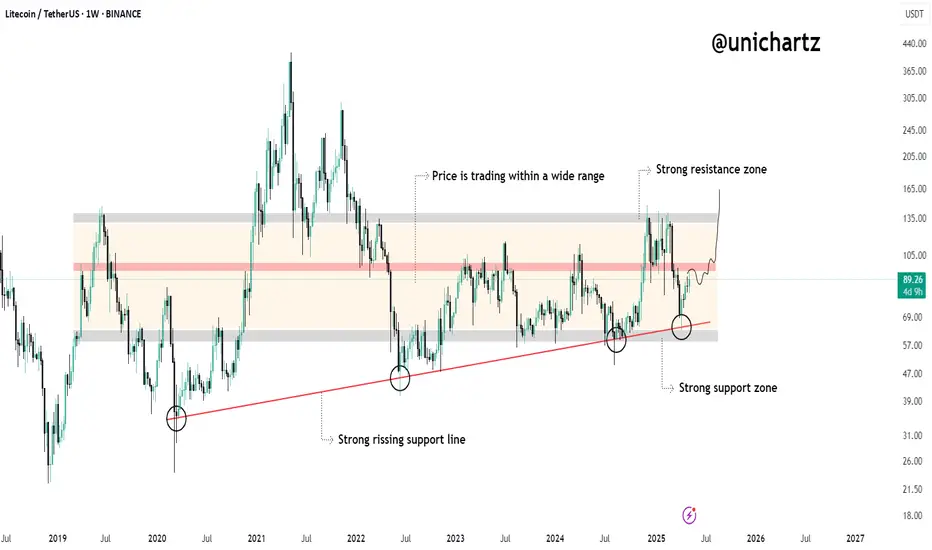
LTC/USDT Weekly – Massive Breakout Loading? 3-Year Triangle
📌 Litecoin is now standing at one of its most crucial technical levels since the 2021 bull run. After 3 years of compression inside a massive symmetrical triangle, price action is nearing a major breakout point. Will LTC finally explode upward, or are bears still in control? Let’s break it down!
🧠 Technical Pattern: Long-Term Symmetrical Triangle
This is a classic pattern that signals a prolonged phase of buyer-seller equilibrium, where lower highs and higher lows converge into a point of tension. Historically, this type of formation often ends in a sharp breakout in either direction.
🔺 Pattern Duration: Since May 2021
🔺 Converging trendlines: Tightening into Q3/Q4 2025
🔺 Historical breakout probability: ~60-75% chance of upward breakout in symmetrical triangles
🟢 Bullish Scenario (Upside Breakout):
If LTC breaks above the upper triangle resistance (~$100 – $115) with strong volume, it could ignite a major rally due to:
✅ The end of a multi-year consolidation
✅ Renewed investor confidence and potential altcoin season
✅ Technical confirmation of breakout from a long-term base
🎯 Upside Targets:
$134.66 – Psychological resistance and minor horizontal supply zone
$230.13 – Major resistance area from 2022 breakdown
$280.87 – Fib extension & key structural level
$325.00 – Pre-blowoff level from 2021
$387.91 – All-Time High (ATH) retest zone
📌 Based on the triangle’s base projection, a technical target of ~$280+ is plausible if breakout confirms.
🔴 Bearish Scenario (Downside Breakdown):
If LTC fails to hold the rising support (~$85), it may trigger a strong bearish reaction, especially if Bitcoin also loses key support levels.
📉 Downside Levels to Watch:
$65.00 – Key horizontal support
$49.00 – $39.00 – Historical demand zone from early 2020
$23.90 – Pandemic-era low (extreme bearish target)
📌 Breakdown confirmation requires a weekly close below support with high volume, ideally accompanied by macro risk-off sentiment.
🧩 Key Confirmations to Watch For:
1. Volume Surge on Breakout – Is the move supported by strong volume?
2. Successful Retest – Does price retest the breakout level as support?
3. Momentum Indicators – Weekly RSI > 50 and MACD bullish crossover can strengthen conviction.
📊 Fundamental & Sentiment Context:
Litecoin halving occurred in August 2023. Historically, price rallies follow 6–12 months after.
Often dubbed the “digital silver”, LTC remains relevant during altcoin cycles.
Whale accumulation has increased slowly since late 2024—possibly indicating long-term positioning.
✅ Conclusion & Strategy:
Litecoin is like a technical time bomb waiting to explode. Traders and investors should prepare for both breakout and breakdown scenarios. Patience and confirmation are key. Don’t chase—let the chart speak first.
🎯 Plan the trade, trade the plan. Don’t FOMO into noise—wait for structure!
#LTCUSDT #LitecoinBreakout #CryptoTechnicalAnalysis #SymmetricalTriangle #BullishSetup #AltcoinSeason #Litecoin2025 #CryptoChart #TrianglePattern #LitecoinRally

LTCUSDT 1D AnalysisLTC ~ 1D Analysis
#LTC Buy after successfully breaking this resistance line with a short term target of at least 10%+ from here.

#LTC/USDT#LTC
The price is moving within a descending channel on the 1-hour frame, adhering well to it, and is heading for a strong breakout and retest.
We are seeing a bounce from the lower boundary of the descending channel, which is support at 92.48.
We have a downtrend on the RSI indicator that is about to be broken and retested, supporting the upward trend.
We are looking for stability above the 100 moving average.
Entry price: 97.44
First target: 100.24
Second target: 102.45
Third target: 105.26

LTC/USDT Trendline Breakout AlertLTC/USDT Trendline Breakout Alert
LTC has broken above a key descending trendline, signaling a potential shift in momentum from bearish to bullish. This kind of breakout often marks the end of a consolidation phase and the beginning of a new upward trend.
If the price holds above the trendline and gains volume support, further upside can be expected. However, if LTC drops back below the trendline, it may signal a false breakout, and caution is advised.
**Key levels to watch:**
* Retest of the broken trendline as support
* Immediate resistance overhead
* Volume confirmation for trend strength
LTC is showing signs of strength — keep it on your radar for a possible bullish continuation.
LTCUSDT 1D Analysis LTC ~ 1D Analysis
#LTC Buy after successfully breaking this resistance line or buy when retesting this support block with a short term target of at least 10%+.

Is $LTC Lining Up for a Breakout Move?LTCUSDT is moving inside a wide range that's been respected for over 3 years — with price bouncing between a strong support zone ($50–$60) and a strong resistance zone ($130–$145).
Key Highlights:
Strong Support Zone:
Price recently bounced off a long-term horizontal support area near $60 — the same zone that sparked multiple rallies in the past.
Rising Trendline:
A clean, rising diagonal support has held since 2020 — each retest has led to upward momentum. The latest bounce confirms this structure is still valid.
Current Structure:
Price is climbing from the base of the range. If it breaks through the mid-zone and holds, we could see an attempt toward the upper resistance around $130+.
DYOR, NFA
LTCUSDT 1D AnalysisLTC ~ 1D Analysis
#LTC Buy after successfully penetrating this resistant line with a short -term target of at least 10%+ from here.

LTCUSDT 1WLTC ~ 1W Analysis
#LTC Buy gradually when re -testing this support with a short -term target of at least 15%+.

LTCUSDT Breakout Loading….BINANCE:LTCUSDT has been consolidating for several days, repeatedly testing resistance levels. This pattern suggests a potential breakout is on the horizon. With ETH already gaining momentum, Litecoin could follow suit. Once the market starts moving, plenty of trading opportunities may arise.
Trade Smart: Always use a stop loss and manage your risk effectively.
BINANCE:LTCUSDT Currently trading at $91.5
Buy level: Above $91
Stop loss: Below $83
Target : $130
Max Leverage 3x
Always keep Stop loss
Follow Our Tradingview Account for More Technical Analysis Updates, | Like, Share and Comment Your thoughts

LTC/USD "Litecoin vs US Dollar" Crypto Market Heist Plan🌟Hi! Hola! Ola! Bonjour! Hallo!🌟
Dear Money Makers & Robbers, 🤑💰🐱👤🐱🏍
Based on 🔥Thief Trading style technical and fundamental analysis🔥, here is our master plan to heist the LTC/USD "Litecoin vs US Dollar" Crypto market. Please adhere to the strategy I've outlined in the chart, which emphasizes long entry. Our aim is the high-risk Red Zone. Risky level, overbought market, consolidation, trend reversal, trap at the level where traders and bearish robbers are stronger. 🏆💸Book Profits Be wealthy and safe trade.💪🏆🎉
Entry 📈 : "The vault is wide open! Swipe the Bullish loot at any price - the heist is on!
however I advise placing Buy limit orders within a 15 or 30 minute timeframe. Entry from the most recent or closest low or high level should be in retest.
Stop Loss 🛑: Thief SL placed at 110.00 (swing Trade Basis) Using the 4H period, the recent / nearest low level.
SL is based on your risk of the trade, lot size and how many multiple orders you have to take.
Target 🎯: 165.00 (or) Escape Before the Target
Scalpers, take note 👀 : only scalp on the Long side. If you have a lot of money, you can go straight away; if not, you can join swing traders and carry out the robbery plan. Use trailing SL to safeguard your money 💰.
📰🗞️Fundamental, Macro, COT, Sentimental Outlook:
LTC/USD "Litecoin vs US Dollar" Crypto Market market is currently experiencing a bullish trend,., driven by several key factors.
🔱Fundamental Analysis
Litecoin Adoption: Growing adoption of Litecoin as a payment method, with increasing transaction volumes.
Halving Event: The upcoming halving event in August 2025 is expected to reduce Litecoin's block reward, potentially increasing demand and prices.
Competition from Other Cryptocurrencies: Increasing competition from other cryptocurrencies, such as Bitcoin and Ethereum, may impact Litecoin's market share.
🔱Macro Economics
Global Economic Trends: The ongoing global economic recovery is expected to drive up demand for cryptocurrencies, including Litecoin.
Inflation Rate: Global inflation is expected to rise to 3.8% in 2025, potentially increasing demand for cryptocurrencies as a hedge against inflation.
Interest Rates: Central banks are expected to maintain low interest rates in 2025, supporting cryptocurrency markets.
🔱COT Data
Net Long Positions: Institutional traders have increased their net long positions in Litecoin to 60%.
COT Ratio: The COT ratio has risen to 2.5, indicating a bullish trend.
Open Interest: Open interest in Litecoin futures has increased by 20% over the past month, indicating growing investor interest.
🔱Sentimental Outlook
Institutional Sentiment: 65% bullish, 35% bearish.
Retail Sentiment: 60% bullish, 40% bearish.
Market Mood: The overall market mood is bullish, with a sentiment score of +40.
🔱Technical Analysis
Moving Averages: 50-period SMA: 120.00, 200-period SMA: 110.00.
Relative Strength Index (RSI): 4-hour chart: 62.21, daily chart: 58.14.
Bollinger Bands: 4-hour chart: 130.00 (upper band), 120.00 (lower band).
🔱Next Move Prediction
Bullish Move: Potential upside to 150.00-170.00.
Key Support Levels: 120.00, 110.00.
Key Resistance Levels: 150.00, 170.00.
🔱Market Overview
Current Price: 130.00
Daily Change: 2.5%
Weekly Change: 10.2%
Overall Outlook
🔱The overall outlook for LTC/USD is bullish, driven by a combination of fundamental, technical, and sentimental factors. The expected increase in Litecoin adoption, upcoming halving event, and bullish market sentiment are all supporting the bullish trend. However, investors should remain cautious of potential downside risks, including changes in global economic trends and unexpected regulatory developments.
⚠️Trading Alert : News Releases and Position Management 📰 🗞️ 🚫🚏
As a reminder, news releases can have a significant impact on market prices and volatility. To minimize potential losses and protect your running positions,
we recommend the following:
Avoid taking new trades during news releases
Use trailing stop-loss orders to protect your running positions and lock in profits
📌Please note that this is a general analysis and not personalized investment advice. It's essential to consider your own risk tolerance and market analysis before making any investment decisions.
📌Keep in mind that these factors can change rapidly, and it's essential to stay up-to-date with market developments and adjust your analysis accordingly.
💖Supporting our robbery plan will enable us to effortlessly make and steal money 💰💵 Tell your friends, Colleagues and family to follow, like, and share. Boost the strength of our robbery team. Every day in this market make money with ease by using the Thief Trading Style.🏆💪🤝❤️🎉🚀
I'll see you soon with another heist plan, so stay tuned 🤑🐱👤🤗🤩

LTCUSDT 1WLTC ~ 1W Analysis
#LTC This support block continues to be maintained so far.
Buy gradually from here with a minimum target of 20%+.

LTCUSDT LONG 1H (Update/Results)From the main review, in which I indicated personal expectations, new market variables arrived both in terms of goals and entry.
On the 1D chart, the price interacted with the key area of interest (poi), removed the liq of the nearest min. and hit the order block 15m TF
New goal on CHoCH target, has been achieved.
stop moved to profit!

LTCUSDT 1H LONGOn higher timeframes, the asset forms many liquidity pools and has aggressive market purchases, thereby protecting the break levels of the structure!
Previously, the asset went under the POI range , but returned on good volume with full-bodied candles.
I am considering a long position at the specified price on a trading chart with targets:
$123.69
$131.20
$141.22
Risk management - 1% on stop order

$LTC waking up - targetting $200!It’s been a while since we had a clear signal to long in crypto.
CRYPTOCAP:LTC looks healthy here—trade stays active as long as it holds above 114.
Buying into the 120s down to 116.
Targeting 200.
Both weekly and monthly trends are looking solid, so I’m jumping in just in case it pulls an XRP-like move. The hype might not be there, but I’d be happy with a 2x.
BINANCE:LTCUSDT

Litecoin ETF Approval Odds Soar to 85%—What’s Driving the Surge?The race for altcoin ETFs in the U.S. just took a significant leap forward. Litecoin ETF approval odds on Polymarket skyrocketed to 85%, following the listing of Canary Capital’s proposed Litecoin ETF on the Depository Trust and Clearing Corporation (DTCC) system.
This move mirrors the Ethereum ETF approval process, which saw its green light from the SEC in May 2024. While DTCC listing doesn’t guarantee SEC approval, it’s a crucial preparatory step that shows the application is progressing.
Why Does This Matter?
📌 Polymarket Odds Up 35% – Investor confidence in a Litecoin ETF is surging.
📌 DTCC Listing Signals Progress – Canary Capital’s application is moving through key procedural steps.
📌 Institutional Interest Growing – Asset managers like Grayscale and CoinShares are positioning Litecoin-based financial products.
The SEC’s Next Move
Canary Capital first filed for a spot Litecoin ETF in October 2024. While its status as a Bitcoin fork and commodity classification may work in its favor, the SEC’s cautious approach could still delay approval.
📌 Optimistic Case: SEC approval could boost institutional adoption and significantly impact LTC’s price.
📌 Bearish Case: If the SEC delays or denies the application, Polymarket odds could tumble, and LTC may stagnate.
Despite this news, Litecoin’s price reaction has been muted, up only 3.37% to $134.25 since Friday. The next major price move will likely depend on further SEC developments.
The question remains—will the SEC push Litecoin into the ETF era, or is this another case of premature optimism?

Litecoin Surpasses $130 – Is a Move Toward $200 in Play?Despite broader market uncertainty and declines across major altcoins, Litecoin (LTC) has held its ground above the key $125 support level, signaling strong bullish momentum.
The asset has gained 10.72% in the past 24 hours and 15.95% over the last week, while its monthly increase stands at 12.23%. With a Year-to-Date (YTD) return of +32.56%, LTC continues to demonstrate resilience.
Technical Outlook
SMA Support – The Simple Moving Average (SMA) reinforces the bullish trend in the daily timeframe.
RSI Strength – The Relative Strength Index (RSI) has rebounded from neutral levels and is approaching the overbought range.
Trendline Support – The average trendline continues to hold, suggesting further upside potential.
Price Targets
Bullish Scenario: If momentum holds, LTC could challenge $147.25, and a break above this level may open the path toward $180.
Bearish Scenario: If sellers gain control, Litecoin may retest $115.50, with extended downside risk to $100 if selling pressure intensifies.
With current technical support intact, Litecoin appears well-positioned for continued gains. However, the market's broader trajectory will be a determining factor in whether LTC can push toward $200 in 2024.

BUY SPOT LTCUSDT (W-M Swing Trade for 2025)🚀 BUY SPOT LTCUSDT (W-M Swing Trade for 2025)
📢 LTCUSDT is in a weekly correction phase, presenting a strong accumulation opportunity for mid to long-term gains.
📌 Market Outlook & Trade Plan
✔ Most coins, including LTC, are undergoing a weekly timeframe correction.
✔ The ideal buy zone was $98 - $112, but current prices ($120) are still reasonable for long-term positioning.
✔ LTC has strong breakout potential, targeting $300+ in the next major uptrend.
📌 Trade Strategy:
Trend: Buy Spot (Swing trade based on W or M cycle, depending on capital allocation).
Entry Point: $120+ is still a reasonable zone despite the ideal buy range being lower.
Target Levels:
$160 (First target)
$215 (Mid-term breakout target)
$300+ (Long-term potential)
Hold Time:
4-5 weeks if trading the W cycle.
Throughout 2025 if following M & 3M cycles.
💡 Key Considerations:
✔ Adjust capital allocation based on whether you are trading W, M, or 3M cycles.
✔ Monitor market trends and breakout confirmations for stronger momentum.
✔ Consider taking partial profits at key resistance levels for risk management.
🔥 LTCUSDT remains a strong long-term play – Accumulate and position wisely! 🚀

Take it LITE with LTC!Okay so no matter what it makes, following OB to not fall below ornANGE box and go above the green box as usual.

LTC/USD "Litecoin vs US Dollar" Crypto Market Bullish Heist Plan🌟Hi! Hola! Ola! Bonjour! Hallo!🌟
Dear Money Makers & Robbers, 🤑 💰
Based on 🔥Thief Trading style technical and fundamental analysis🔥, here is our master plan to heist the LTC/USD "Litecoin vs US Dollar" Crypto market. Please adhere to the strategy I've outlined in the chart, which emphasizes long entry. Our aim is the high-risk Red Zone. Risky level, overbought market, consolidation, trend reversal, trap at the level where traders and bearish robbers are stronger. 🏆💸Be wealthy and safe trade.💪🏆🎉
Entry 📈 : "The vault is wide open! Swipe the Bullish loot at any price - the heist is on!
however I advise placing Buy limit orders within a 15 or 30 minute timeframe. Entry from the most recent or closest low or high level should be in retest.
Stop Loss 🛑: Using the 4H period, the recent / nearest low or high level.
Goal 🎯: 160.00 (or) Escape Before the Target
Scalpers, take note 👀 : only scalp on the Long side. If you have a lot of money, you can go straight away; if not, you can join swing traders and carry out the robbery plan. Use trailing SL to safeguard your money 💰.
📰🗞️Fundamental, Macro, COT, Sentimental Outlook:
🔴Fundamental Analysis
- Increasing Adoption: Litecoin's growing adoption and use cases, such as its integration with payment processors, are driving up demand and prices.
- Improving Scalability: Litecoin's transition to proof-of-stake (PoS) and the implementation of sharding are expected to improve scalability, reducing transaction costs and increasing efficiency.
⚪Macroeconomic Analysis
- Global Economic Trends: The current global economic uncertainty and inflation concerns are driving investors towards cryptocurrencies like Litecoin, which are seen as a hedge against traditional assets.
- Monetary Policy: Central banks' monetary policies, such as interest rate decisions, can impact Litecoin's price.
🟠COT Report
- The COT report suggests that speculative traders are bullish on LTC/USD, while commercial traders are bearish. This could indicate a potential buying opportunity for traders who follow the contrarian approach.
COT Data Breakdown
Long Positions: 52.3% (speculative), 21.1% (commercial)
Short Positions: 47.7% (commercial), 28.9% (speculative)
⚫Sentimental Analysis
- Market Sentiment: Market sentiment is mixed, with some investors expecting a bullish movement due to increasing adoption and improving scalability, while others are bearish due to regulatory uncertainty and market volatility.
🟡Institutional Trader Analysis
- Institutional Positions: Institutional traders are increasingly investing in Litecoin, driven by its growing adoption and use cases.
🟤Retail Trader Analysis
- Retail Positions: Retail traders are also cautious, with some taking long positions on LTC/USD due to increasing adoption and improving scalability, while others are taking short positions due to regulatory uncertainty and market volatility.
🟢Outlook
- Based on the analysis, the LTC/USD pair is expected to move into a bullish direction in the short term, with a target level of 160.00. However, the movement is likely to be volatile, and investors should be cautious ahead of regulatory developments and economic data releases.
⚠️Trading Alert : News Releases and Position Management 📰 🗞️ 🚫🚏
As a reminder, news releases can have a significant impact on market prices and volatility. To minimize potential losses and protect your running positions,
we recommend the following:
Avoid taking new trades during news releases
Use trailing stop-loss orders to protect your running positions and lock in profits
📌Please note that this is a general analysis and not personalized investment advice. It's essential to consider your own risk tolerance and market analysis before making any investment decisions.
📌Keep in mind that these factors can change rapidly, and it's essential to stay up-to-date with market developments and adjust your analysis accordingly.
💖Supporting our robbery plan will enable us to effortlessly make and steal money 💰💵 Tell your friends, Colleagues and family to follow, like, and share. Boost the strength of our robbery team. Every day in this market make money with ease by using the Thief Trading Style.🏆💪🤝❤️🎉🚀
I'll see you soon with another heist plan, so stay tuned 🫂

LTCUSDT on the Rise: Major Breakout Signal!!MARKETSCOM:LITECOIN ( BINANCE:LTCUSDT ) has broken out of a major resistance level with strong volume, indicating renewed bullish momentum. This breakout marks the start of a potential uptrend, as BINANCE:LTCUSDT shows strength above the critical zone.
If the price holds above this resistance level, we could witness further upside movement, potentially challenging and even surpassing its previous all-time high. With increasing market interest, LTC might just be gearing up for a remarkable rally.
BINANCE:LTCUSDT Currently trading at $130
Buy level: Above $115
Stop loss: Below $85
Target : $410
Max Leverage 3x
Always keep Stop loss
Follow Our Tradingview Account for More Technical Analysis Updates, | Like, Share and Comment Your thoughts

#LTC/USDT #LTC
The price is moving in a descending channel on the 1-hour frame and is expected to continue upwards
We have a trend to stabilize above the moving average 100 again
We have a descending trend on the RSI indicator that supports the rise by breaking it upwards
We have a support area at the lower limit of the channel at a price of 110
Entry price 112
First target 114
Second target 116
Third target 120

LTCUSDT 1WLTC Update ~ 1W
#LTC Retesting this support Block,. buy gradually inside this support block,. Minimum target 20%+ from here.
