LTO Analysis - What Shall we Expect !!!If the price can break through this Wedge's resistance, I expect it to reach $0.05 in a short time.
Stay Awesome , CobraVanguard
LTO

LTOUSDT 1W Analysis LTO ~ 1W Analysis
#LTO Buy back gradually from here if you still have confidence in this coin with a short term target of at least 20%+ from this support.

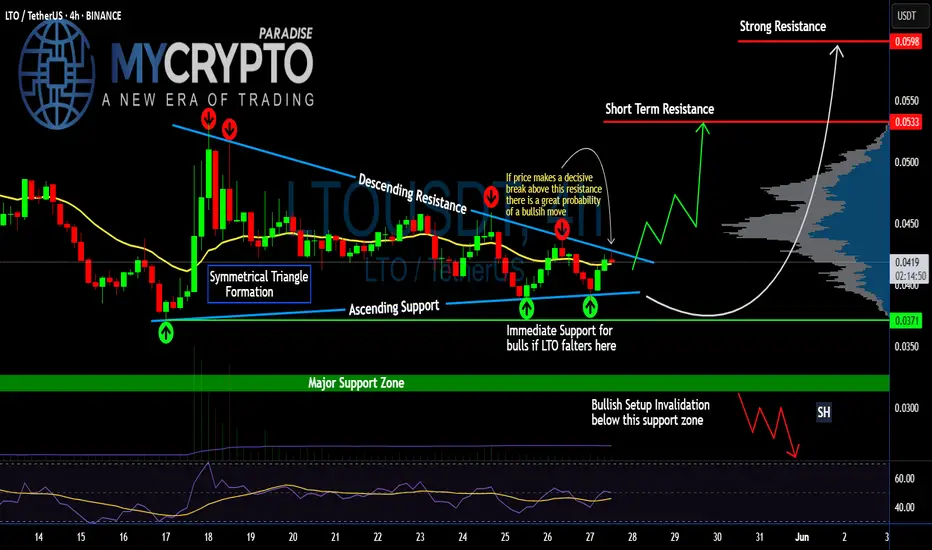
Is #LTO Ready for an Explosive Move or Another Trap Ahead? Yello Paradisers! Are you watching how #LTO is quietly tightening within a triangle while the rest of the market looks away? This might just be the last moment of silence for #LTONetwork:
💎#LTOUSDT is currently consolidating within a clean symmetrical triangle, wedged tightly between a descending resistance and an ascending support trendline. This pattern has already seen multiple touches on both edges, suggesting price is nearing the point of decision.
💎What makes this formation more compelling is how #LTOUSD is holding just above the immediate support at the $0.0371 zone and 20EMA is also acting as support. This area has acted as a launchpad twice already, keeping bullish hopes alive. Price is once again pressing against the upper boundary of the triangle, increasing the odds of a breakout on the next attempt.
💎If bulls manage to push above the descending resistance and we see a confirmed breakout with strong volume, the first upside target sits at $0.0533, which is a key short-term resistance level. From there, momentum could carry the price toward $0.0598, where a strong historical resistance lies based on the volume profile.
💎However, the bullish structure is clearly invalidated on a break below $0.0321. Any decisive move under this support zone would shift the short-term outlook in favor of the bears, potentially opening a path toward lower support.
Discipline, patience, robust strategies, and trading tactics are the only ways you can make it long-term in this market.
MyCryptoParadise
iFeel the success🌴
LTOUSDT 1D Analysis LTO ~ 1D Analysis
#LTO Buy after successfully breaking this resistance line with a short term target of at least 10%+ from here.

LTO - Its Logo Says It All...Hello TradingView Family / Fellow Traders. This is Richard, also known as theSignalyst.
📚 After breaking above the $0.03 structure marked in blue, GETTEX:LTO has shifted its momentum from bearish to bullish.
It is currently in a correction phase, but as long as the $0.03 support holds, we’ll be eyeing trend-following long setups to catch the next impulsive wave upward.📈
🎯 Short-term target: $0.05
🎯 Mid-term target: $0.10
🎯 Long-term target: $0.50
📚 Always follow your trading plan regarding entry, risk management, and trade management.
Good luck!
All Strategies Are Good; If Managed Properly!
~Rich

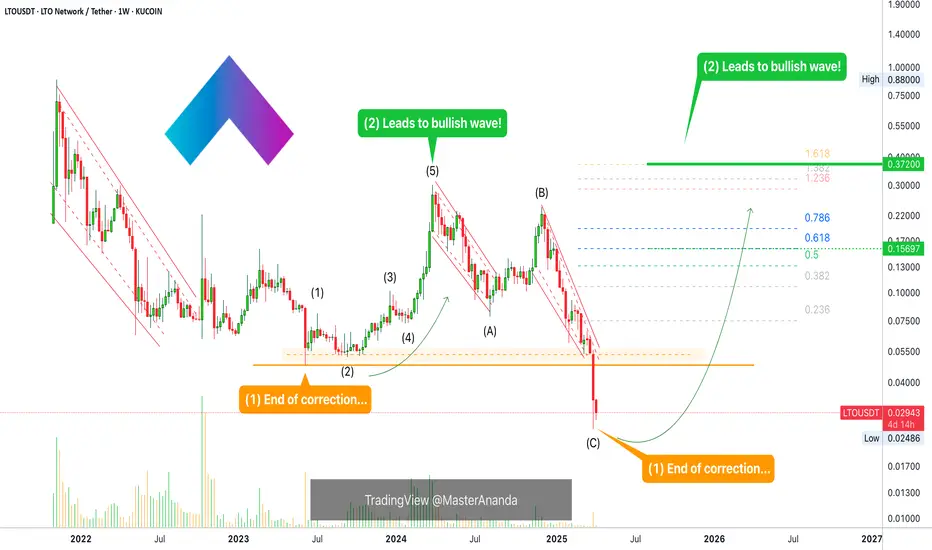
LTO Network: Your Altcoin ChoiceA bullish wave follows a correction.
The end of a correction signals the start of a bullish wave.
What we have here is the long-term LTO Network chart. The last part is clearly a strong correction. After this correction a bullish impulse will develop. 5-up waves. 1,2,3,4,5.
Last week LTOUSDT produced an All-Time Low. This session also have some of the weakest volume ever for a major move. Lower low on low volume means that the bearish move reached its end. If the bearish move is over, what happens next?
This is the stop-loss hunt event. All LONG positions liquidated. All spot stop-loss orders activated. Full market flush and reset complete. With this move, literally millions of participants left the market, they will trade Crypto no-more. They will have nightmares when you mention Cryptocurrencies for years to come. But not all is lost.
At the same time that the bearish cycle ends, this heralds the start of a new cycle and bullish phase. It will be great.
Just as the market can hit new All-Time Lows when the bears are in control, the market can hit new All-Time Highs when the bulls control the game.
The time to buy is now.
Once you hit bottom, there is no other place left to go but up.
LTO Network already hit bottom, so we can be sure that soon enough we will experience a new phase of growth.
The action won't go full green right away. The bull market will not happen as the C wave of the current corrective phase, no. It tends to build up slowly for months. Months sideways, growing, slowly; higher highs and higher lows.
Some shakeouts happen but still the base, the ATL, stays the same. The shakeouts remove a big portion of the slow and steady growth, but just as fast as the market drops it starts to recover again. The recovery is always slow... It builds up for months and then bullish momentum shows up.
Bullish momentum leads to the first strong bullish wave. After this wave a major correction, just one, strong higher low, strong recovery and then come the bull-run phase.
This is the bull market dynamics in a glance. It will take time but it will be great.
Many people will lose patience and fold.
Some will become bored.
Others will look at the screen, track the market but will never buy when prices are low.
Then, suddenly, everything starts going up. Some of these people that are looking at the screens and the prices daily, they will be wondering, "Why didn't I buy when prices were low?" "What was holding me back?" "Why didn't I take action?"
You don't have to be in that group.
You can be in the group that will end up saying, "Wow, this time I managed to secure profits on most of my coins. 10-20X nice. Thank you Master, thanks a lot for your continued support!"
But you have to start today.
If not buying, start planning and then take action.
Thank you for reading.
Namaste.
LTOUSDT 1W AnalysisLTO ~ 1W Analysis
#LTO Buy back from here with a short -term target of at least 20%+ from here. This is the lowest support for now.

LTO - Two Potential Longs!Hello TradingView Family / Fellow Traders. This is Richard, also known as theSignalyst.
📚 LTO has been rejecting a massive weekly support and the key $0.02 round number.
🛡️ As long as this level holds, I'm eyeing a potential 5x move towards the upper bound of the falling channel and the $0.10 round number.
🚀 From a macro perspective, a break above $0.10 could trigger a continuation towards $0.30 — unlocking major upside potential!
📚 Always follow your trading plan regarding entry, risk management, and trade management.
Good luck!
All Strategies Are Good; If Managed Properly!
~Rich

LTO - Shift in Momentun in Action!Hello TradingView Family / Fellow Traders. This is Richard, also known as theSignalyst.
📚 LTO is a perfect practical example of a momentum shift in action.
It’s clear that the bears are losing steam — the impulse moves marked in red are becoming flatter and smaller, forming a wedge pattern.
Moreover, LTO just tapped into a key weekly support zone near the $0.03 round number, making it a prime area to look for potential long setups.📈
🚀For the bulls to confirm this momentum shift in their favor and aim for the $0.05 round number as the first target 🎯, a break above the last major high marked in green at $0.0345 is essential ✅.
📚 Always follow your trading plan regarding entry, risk management, and trade management.
Good luck!
All Strategies Are Good; If Managed Properly!
~Rich

LTOUSDT 1WLTO ~ 1W Analysis
#LTO Buy back gradually from here if you still have a Conviction on this coin with a short -term target of at least 20%+.

LTO - Massive Support => Bullish Potential!Hello TradingView Family / Fellow Traders. This is Richard, also known as theSignalyst.
⚔️ LTO is retesting a massive zone , which marks the intersection of two key rejection points:
1️⃣ The $0.02 support level and psychological round number
2️⃣ The lower red trendline, acting as an oversold area
📚 According to my trading style:
As #LTO hovers around the blue circle zone, I’ll be watching for bullish reversal setups (such as a double bottom pattern, trendline break, and so on).
🏹 Moreover, from a medium-term perspective:
For the bulls to shift momentum in their favor, a break above both the upper red trendline and the blue structure is required.
📚 Always follow your trading plan regarding entry, risk management, and trade management.
Good luck!
All Strategies Are Good; If Managed Properly!
~Rich

LTOUSDT 1WLTO ~ 1W Analysis
#LTO Buy gradually from here with a short -term target of at least 20%+. This is support that continues to be maintained so far.

LTOUSDT 1WLTO ~ 1W Analysis
#LTO Buy gradually in this support block if you still have a Conviction on this Coin with a minimum target of 20%+

LTO Bullish LTO-USDT is showing strong bullish signals, supported by several key technical indicators. The price has successfully retested the weekly resistance level, coinciding with the 61.8% Fibo
which is a critical area for confirming bullish momentum.
This retest was accompanied by a significantly high trading volume compared to the previous period, similar to the volume spikes observed during previous breakout waves, indicating strong Zone.
Additionally, LTO-USDT has breached a major downtrend line, further solidifying the bullish reversal.
On the 4-hour chart, a falling wedge pattern has been identified, which is typically a bullish continuation pattern. This combination of factors—retesting key resistance, high volume, breakout of a downtrend, and a falling wedge—suggests a strong potential for upward movement in LTO-USDT.

LTOUSDT 1WLTO ~ 1W
#LTO This is the RWA sector coin. If you still have Conviction on this coin,. This support block would be a very good buy for now. Minimum target 20%++

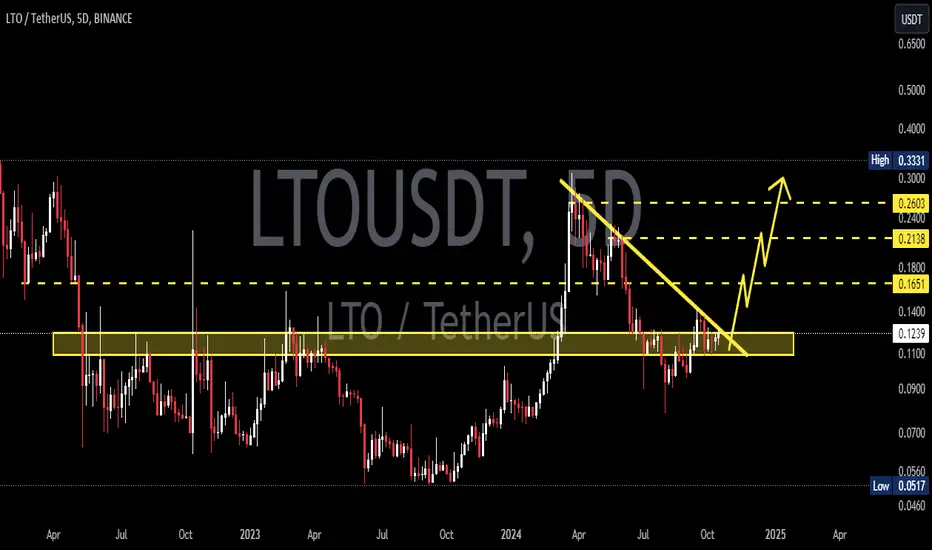
The Future of LTOUSDT: A Look at the Key Catalysts - LTO Network◳◱ On the BINANCE:LTOUSDT chart, the Trendline Touch pattern suggests a consolidation phase that could precede a trend continuation or reversal. Traders might observe resistance around 0.213 | 0.2278 | 0.2663 and support near 0.1745 | 0.1508 | 0.1123. Entering trades at 0.2217 could be strategic, aiming for the next resistance level.
◰◲ General Information :
▣ Name: LTO Network
▣ Rank: 635
▣ Exchanges: Binance, Kucoin, Gateio, Hitbtc
▣ Category / Sector: Infrastructure - Enterprise and BaaS
▣ Overview: LTO Network is a hybrid blockchain designed for trustless B2B collaboration. The private layer is for data sharing and process automation (each process residing on its own miniature ad-hoc permissionless private chain). The public layer acts as a global security settlement layer — an immutable digital notary. This hybrid approach makes LTO Network GDPR and data privacy compliant, as well as scalable and ready for adoption.
◰◲ Technical Metrics :
▣ Current Price: 0.2217 ₮
▣ 24H Volume: 3,401,353.860 ₮
▣ 24H Change: 1.884%
▣ Weekly Change: 14.23%%
▣ Monthly Change: 87.18%%
▣ Quarterly Change: 117.57%%
◲◰ Pivot Points :
▣ Resistance Level: 0.213 | 0.2278 | 0.2663
▣ Support Level: 0.1745 | 0.1508 | 0.1123
◱◳ Indicator Recommendations :
▣ Oscillators: NEUTRAL
▣ Moving Averages: BUY
◰◲ Summary of Technical Indicators : BUY
◲◰ Sharpe Ratios :
▣ Last 30 Days: 6.69
▣ Last 90 Days: 3.77
▣ Last Year: 1.55
▣ Last 3 Years: 0.32
◲◰ Volatility Analysis :
▣ Last 30 Days: 1.25
▣ Last 90 Days: 0.92
▣ Last Year: 0.93
▣ Last 3 Years: 1.15
◳◰ Market Sentiment :
▣ News Sentiment: N/A
▣ Twitter Sentiment: N/A
▣ Reddit Sentiment: N/A
▣ In-depth BINANCE:LTOUSDT analysis available at TradingView TA Page
▣ Your thoughts matter! What do you think of this analysis? Share your insights in the comments below. Your like, follow, and support are greatly valued and help sustain high-quality content.
◲ Disclaimer : Disclaimer
The content provided is for informational purposes only and does not constitute financial, investment, or trading advice. Always conduct your own research and consult a qualified professional before making any financial decisions. Use of the information is solely at your own risk.
▣ Explore the Power of Charting with TradingView
Unlock a wide range of financial analysis tools, data, and features to elevate your trading experience. Take a tour and see the possibilities. If you decide to upgrade your plan, you can receive up to $30 back. Discover more here - affiliate link -

#LTOUSDT Breaks Out—but Is This the Start of a Rally or a Trap?Yello, Paradisers! After months in a brutal downtrend, could #LTOUSDT finally be ready to reverse course? Let's discuss the latest #LTONetwork analysis:
💎#LTO has finally managed to breakout from the descending triangle and seems ready to rally. This breakout from its descending triangle is promising and is ignited by a bounce off the critical demand zone at $1.04. But hold on—before we get too comfortable, there's a strong possibility we could see a retest of this support.
💎To keep the rally alive, #LTONetwork needs to break through the minor resistance level at $0.138. This is a critical hurdle; if the bulls can push past it, we might see a more powerful surge. A move through $0.138, coupled with rising volume and the backing of the 50EMA, could confirm that the bulls are finally gaining control. Watch this level closely!
💎But, if momentum fades here, a pullback becomes likely. Be prepared for the price to revisit the breakout zone or even test the major demand area at $1.04. Should this support fail to hold, we’re looking at a potential drop to the next major support between $0.078 and $0.085.
💎A break below $0.078 could swing the control back to the bears, paving the way for a deeper correction and squashing any near-term bullish hopes. Trading at these levels requires vigilance, Paradisers—stay strategic and cautious.
Stay focused, patient, and disciplined, Paradisers🥂
MyCryptoParadise
iFeel the success🌴

LTOUSDT 5DLTO ~ 5D
#LTO This coin is in the LSE:RWA sector. If you have Conviction on this coin. This support block would be an excellent buy spot for now. buy in stages with a minimum target of 20%++

LTOUSDTLTO ~ 5D
#LTO This coin is in the RWA sector. If you have Conviction on this coin., this support block would be a very good buy for now.
#LTO (SPOT) entry range below ( 0.1290) T.(0,1536) SL(,1218)BINANCE:LTOUSDT
entry range below ( 0.1290)
Target (0.1536)
SL .4H close below (0.1218)
1:3 Trade
**** #Manta ,#OMNI, #DYM, #AI, #IO, #XAI , #ACE #NFP #RAD #WLD #ORDI #BLUR #SUI #Voxel #AEVO #VITE #APE #RDNT #FLUX #NMR #VANRY #TRB #HBAR #DGB #XEC #ERN #ALT #IO #ACA #HIVE #ASTR #ARDR #PIXEL #LTO ****

Is LTOUSDT on the Brink of a Major Move? Yello, Paradisers! Are you ready for the next potential big move on #LTOUSDT? Our latest analysis suggests a pivotal shift in momentum that could either send this asset soaring or plummeting. Let’s break it down!
💎 GETTEX:LTO is currently holding a key support level within a descending channel, increasing the likelihood of a bullish continuation. The critical zone to watch is the $0.0893 support level, where bullish momentum is beginning to build. If this support holds strong, we could witness a significant push towards the descending resistance—and possibly see a breakout above it.
💎If #LTO maintains its upward momentum, potential targets lie at the resistance levels above. This could mark the beginning of a substantial rally, so keep a close eye on those price levels.
💎But as always, we prepare for all scenarios. Should #LTO fail to hold the $0.0893 support and break below it, we could see a bearish trend take over, potentially leading to a sharp price decline.
This is a critical moment for LTOUSDT. The coming days could define its next major move, whether it's a surge to new highs or a correction to lower levels. Remember, in trading, staying disciplined is key.
MyCryptoParadise
iFeel the success🌴

#LTOUSDT in a Perfect Setup to Rally From the Key Support Yello, Paradisers! Have you been tracking the recent breakout on #LTONetwork? If not, it's time to pay attention.
💎 GETTEX:LTO has recently broken out of a descending resistance, hinting at a potential upward trend. The key level to watch right now is the $0.091 support zone, where bullish momentum is starting to build. If this support holds, we could see a strong push towards the next resistance levels.
💎Should #LTO maintain its upward momentum, we’re eyeing potential targets above current levels. The 20EMA is reinforcing this bullish outlook, so keeping a close watch on those price levels is crucial.
💎But as always, we prepare for all scenarios. If #LTOUSDT fails to hold the $0.091 support and breaks below, we might see a pullback to the lower bullish Order Block (OB) level. However, a drop below the $0.078-$0.083 range could trigger a bearish trend, potentially leading to a significant price decline.
The coming days could define its next major move—whether it's a surge toward new highs or a correction to lower levels. Remember, in trading, discipline is key. Stay focused and be prepared to act!
MyCryptoParadise
iFeel the success🌴

LTO Technical Analysis in a Weekly TimeframeHello everyone, I’m Cryptorphic.
For the past seven years, I’ve been sharing insightful charts and analysis.
Follow me for:
~ Unbiased analyses on trending altcoins.
~ Identifying altcoins with 10x-50x potential.
~ Futures trade setups.
~ Daily updates on Bitcoin and Ethereum.
~ High time frame (HTF) market bottom and top calls.
~ Short-term market movements.
~ Charts supported by critical fundamentals.
Now, let’s dive into this chart analysis:
LTO is in a downtrend, with the price close to the support level. The price has already dropped 74% from the local high, and it could fall another 30%-40% if the downtrend continues.
The support and accumulation range for LTO will be between $0.0534 and $0.080.
DYOR, NFA.
Please hit the like button to support my content and share your thoughts in the comment section. Feel free to request any chart analysis you’d like to see!
Thank you!
#PEACE
