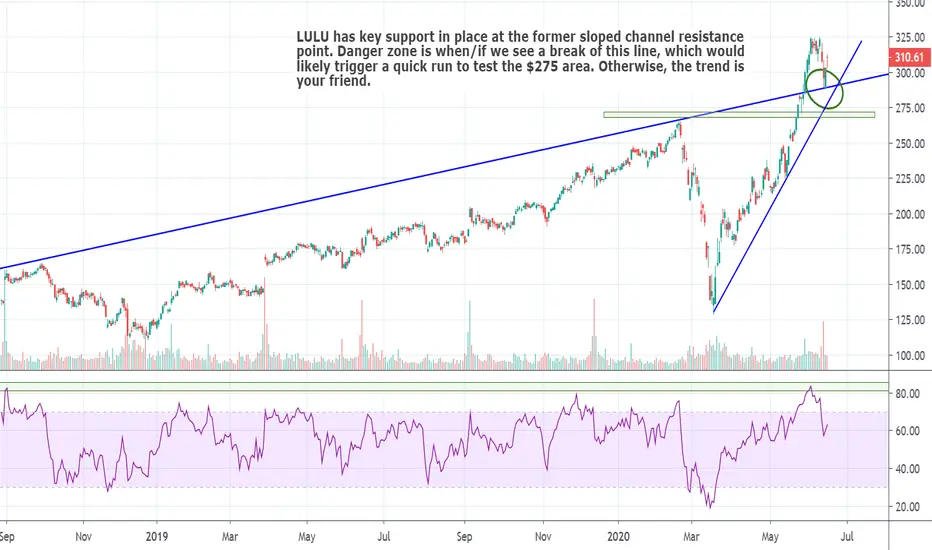
$LULU.. the Trend is Your Friend.. Until It Isn'tLULU has key support in place at the former sloped channel resistance point. Danger zone is when/if we see a break of this line, which would likely trigger a quick run to test the $275 area. Otherwise, the trend is your friend.
LULU
Triple bottom on Macy dating back to 1992 =o !!!! $MWhat is Macys?
Macy's, Inc., an omnichannel retail organization, operates stores, Websites, and mobile applications. The company sells a range of merchandise, including apparel and accessories for men, women, and children; cosmetics; home furnishings; and other consumer goods. As of April 1, 2019, it operated approximately 680 department stores under the Macy's and Bloomingdale's names; and 190 specialty stores
The bull case?
-The company has good profit margins for a retail.
-The company has good debt to capital because they sold a lot of real-estate a few years ago.
- Could get a dead cat bounce (lol)
- I've noticed that Yacktman Hedge fund started acquiring over 20% of macy shares.( this is one of those long term investment companies, kinda like Berkshire and warren buffet style, they look for value)
-Lastly they got a good online store and ladies love to shop! shopaholics gonna be shopaholics. (I mean that's why i invest in the market, so i can make extra money for my lady to buy stuff lol)
The bear case?
-retail sector has been going down hill
-Corona shutdown gonna affect their revenue this year by 25% easily so we'll be looking at breakeven for them this year.
we can bear case all day for sure but that's some of the main ones, so know your risk!
So what's my play?
picking some up around the $5 range, gonna add a trailing stop-loss at $1 below ( trailing stop means at $4 stoploss, if you don't know, just msg me)

$LULU out of its long term monthly channel$LULU has run up with the recent overall market run up. It has now gone out and over its long term monthly chart. It should either just trend here or pull back to its long term channel.

LULULEMON ($LULU) 👖 | Is Becky's portfolio about to take a dip?📊🧐 Analysts have low expectations for Lululemon earnings this quarter, but the chart and other factors (like its expansion into international markets) point to high hopes moving forward.
In the chart, we take a look at some levels for LULU and compare its strength to the S&P (White) to show how recent weakness and divergence from the broader market's uptrend could result in us eventually retesting support before making another attempt at highs.
Support.
The S1 orderblock is the target for LULU bulls if we see a correction for LULU instead of an immediate uptrend. Despite potential outlooks for future quarters, the COVID quarter earnings are unlikely to instill greed, so a correction may just be in order from that perspective alone. Below that we have the S2 and S3 bullish S/R flips, both of which could act support if S1 doesn't hold.
Resistance.
R1 is the main resistance on the chart. The R1 range highs aside, the current range may also end up acting as resistance if we do move down to S1 or lower.
Summary.
The bull case for LULU still makes sense. However, it'll take a really great outlook and perhaps an earnings beat to have the market disregard what is likely to be an underwhelming earnings report and push LULU to new highs. Given the short term weakness on the chart and expected weakness in earnings, the bulls will probably want to focus effort on defending support rather than trying to FOMO into earnings.
Resources: www.earningswhispers.com + www.barrons.com + www.modernretail.co
✨Drop a comment asking for an update, we do NEW setups every day! ✨
Like, Comment & Follow to help the community grow 🎉🎉

THE WEEK AHEAD: CHWY, LULU, PVH EARNINGS; GDXJ, XOP; VIXEARNINGS:
CHWY (71/85/17.34%)* announces Tuesday after the close.
The June 19th 41.5/60 17-delta short strangle pictured here pays 2.55 with break evens wide of the expected move. The similarly delta'd July 17th 39/65 gives you more room to be wrong, but doesn't pay that much more for the wait -- 2.48 at the mid.
LULU (36/57/10.01) and PVH (57/85/14.8) announce Thursday after market close, but have less than ideal volatility contraction play metrics.
SECTOR EXCHANGE-TRADED FUNDS SCREENED FOR >35% 30-DAY WITH JULY SHORT STRADDLE PRICE AS A FUNCTION OF SHARE PRICE:
EWW (37/38), <10%
GDXJ (36/53), 13.74%
GDX (33/43), 11.12%
TQQQ (30/77), 17.7%
XLE (30/39), <10%
EWZ (29/48), 11.75%
XOP (17/49), 12.4%
GDXJ looks to be the most productive from the premium selling standpoint, although we're getting on the short side of duration for July (40 days until expiration).
BROAD MARKET EXCHANGE-TRADED FUNDS WITH JULY SHORT STRADDLE PRICE AS A FUNCTION OF SHARE PRICE:
IWM (39/35), 8.66%
EFA (28/25), 5.50%
QQQ (22/25), 5.93%
SPY (21/24), 5.43%
IRA DIVIDEND EARNING EXCHANGE-TRADED FUNDS SCREENED FOR 30-DAY >35%:
EWZ (29/48)
VIX/VIX DERIVATIVES:
The /VX July contract finished the week at 27.21, with the VIX July 22nd 27/29 short call vertical paying .75 at the mid and the 27/30, nearly a buck at .95. Going out farther in time to take advantage of contangoized term structure here doesn't net you much additional juice, unfortunately. /VX August finished the week at 27.25 -- only .04 above August. September traded at 27.70, but the 27/29 pays only .65, probably due to the fact that the VIX of the VIX (i.e., VIX implied), slopes away, with nearer term implied being higher than those of longer duration.
In "derivative land," the VXX July 29/30 is paying .38, the 29/31, .71, and the 29/32, .99. UVXY is probably also paying 1/3rd the width for similar setups, although options pricing is showing wide in the off hours ... .
* -- The first metric is implied rank; the second, 30-day implied, and the third, the percentage of share price that the nearest monthly at-the-money short straddle is paying (i.e., the LULU June short straddle is paying 10.01% of share price, the PVH June short straddle, 14.8%).

LULU A Nice Short Here IMOMy opinion only.
Short LULU - Thesis of the idea is that it's run up $80+ pts the month of May. Rebalancing should see plenty of institutions selling beginning of June if not late today. Earnings on June 9th should also be underwhelming. ($100+ yoga pants with the amount of unemployment we have?)
Not investment advice.
LULU

LULU Weekly Trend at ResistanceRSI/price divergence and weekly trend at resistance, should be a good short opportunity. I'll be looking for $230-240 puts exp mid to late July.

LULUAnother one I'm watching today. LULU is just hanging out chopping up and down trying to figure out where to go. For this one, falling out from a previous wedge, my bias is to the upside ... eventually. Either 1) if we go to demand, I'd like to look for an entry long because generally after price breaks down from a wedge pattern, price action tends to retrace and backtest the wedge, with the wedge acting as resistance. Or 2) if we go straight back up to back test, just so happens that the back test area is in alignment with a supply zone.
So, eventually I see LULU making its way back up to back test. If we go to demand zone below, I'll enter a small long with price target up to the supply zone. If we go up first to supply zone and back test, I'll watch as there is potential to re-enter the channel and go trough supply. My bias is to short once price enters supply.

LULUWill watch LULU tomorrow and see what kind of action happens. Think if it holds this demand it currently is in, which aligns with .32 fib retrace, possibly a good opportunity to grab some calls for the upside for wave “c.”
If current demand fails, will wait for it to drift down to next level demand. If gaps up in the overnight, like this market seemingly likes to do both up and down, will see what price does if it shoots to the upside price target / supply zone around the $215 area.

LULU - H&S short setup LULU - Short alerted at 192.43 on Friday. Stop loss 196.53, Target 172.13. Target 2 163.66 Target 3 141.23.Earnings were fine but they failed to provide an update for guidance. What does that tell you! if i was long i would be selling , i am short so i will be holding. Holding $195 May puts. Still a possible trade using same options. Would look to take some profits on the way down.


LULU 2. History lesson.So 1st wave on 14d chart back in the time of first Hyper Growth Period for LULU had 27 bars , and 2nd wave is somewhat 1/3 shorter.
Current 1st wave is counting 25 bars , and second is more then 2/3 of 25. so it should crack soon.

LULU OMG. This one is gonna crack. 14D , 2W chart... This is impressive for yoga pants company.. however it's a bubble.
watching to short as soon as divergence turns red.

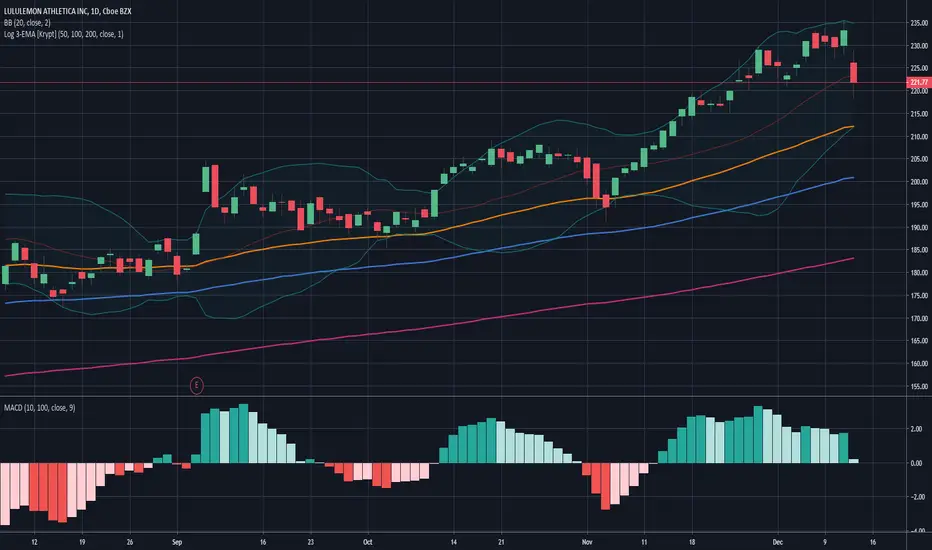
LULU Drop Not Over Yet TP @ 212-213We will continue the drop to the bottom of the Bollinger bands which coincidentally also the 50 Log-EMA level which should provice some resistance and hopefully we bounce back from there.
If you also long from that point put your SL below the band and the EMA.
THE WEEK AHEAD: CHWY, LULU, COST, ORCL EARNINGS; EEM, VIXEARNINGS:
It's a fairly light week for earnings, but there is some highly liquid underlyings to play for volatility contraction:
CHWY (--/74): Monday, After Market Close.
LULU (64/42): Wednesday After Market Close.
COST (44/23): Thursday, After Market Close.
ORCL (42/26): Thursday, After Market Close.
Pictured here is a CHWY January 17th 21 short put at the 20 delta, paying .78 at the mid price as of Friday close with a 20.22 break even. In this particular case, I'm not looking to play earnings for volatility contraction, but waiting for earnings to pass, as well as lock up to end, which is supposed to occur on the 11th (Wednesday) with a whopping 83% of outstanding shares subject to lockup. Depending on what happens with the share price at the end of lock up, as well as implied volatility, I will look to put on a play thereafter.
The only other play I'm potentially interested in is LULU, where the January 17th 190/200/260/270 iron condor is paying 2.61 with delta/theta metrics of -1.69/5.35. It's not a one-third the width setup, but LULU has had a tendency to move, so my inclination would be to go wider to stay clear of potential friskiness.
EXCHANGE-TRADED FUNDS:
UNG (55/54)
TLT (44/13)
USO (21/30)
GLD (19/10)
GDXJ (18/27)
With the possible exception of UNG, shorter duration premium selling isn't ideal here, with rank below 50% and 30-day below 35%.
As an interesting aside, however -- compare and contrast premium selling in UNG and USO versus trading /NG and /CL directly, using at-the-money short straddle pricing:
UNG January At-the-Money Short Straddle: 2.68 versus 18.03 (14.9%)
/NG January At-the-Money Short Straddle: .309 versus 2.25 (13.1%)
USO April At-the-Money Short Straddle: 1.75 versus 12.32 (14.2%)
/CL March At-the-Money Short Straddle: 6.76 versus 59.07 (11.4%)
BROAD MARKET:
EEM (8/16)
QQQ (7/16)
IWM (6/16)
SPY (2/13)
First Expiries in Which At-the-Money Short Straddle Credit Exceeds 10% of Value of Underlying:
EEM: June: --4.48 versus 43.07 (10.4%)
QQQ: June -- 21.49 versus 205.00 (10.5%)
IWM: September -- 20.05 versus 162.83 (12.3%)
SPY: September 34.46 versus 314.87 (10.9%)
As with the exchange-traded funds, short duration premium selling isn't paying here, so your choices are to hand sit or sell in higher implied volatility expiries farther out in time. I've been largely opting for the latter, while simultaneously exercising some restraint as to sizing, since the last thing you want to do is tie up buying power with longer-dated setups, only to have literally nothing left over to take advantage of shorter duration volatility pops. Secondarily, I've been managing these longer-dated setups more aggressively, taking them off in profit in many cases a good deal short of 50% max.
FUTURES:
/6B (60/12)
/NG (55/58)
/CL (21/29)
/6E (20/5)
/GC (19/10)
As with the exchanged-traded funds, volatility is in natty and oil with /NG paying in short duration (January). One thing I noticed is that /CL expiry-specific premium selling doesn't necessarily lend itself to going longer-dated (at least at this moment in time) since implied is about the same regardless of where you go (i.e., January: 28.9%; February: 29.5%; March: 29.3%), so all you're basically getting paid for is duration, as compared to -- for example -- expiry-specific implied in SPY, which generally increases incrementally over time (i.e., January: 14.5%; February: 15.7%; March: 16.8%, etc.). This is not necessarily a bad thing, just an observation of what you're getting by going out farther in time with /CL options versus other instruments that have a sort of expiry-specific implied volatility "term structure."
VIX/VIX DERIVATIVES:
VIX finished Friday at 13.62, with /VX futures contracts trading at 16.32, 17.51, 17.63, and 18.19 in January, February, March, and April respectively. Consequently, the contango environment remains productive for term structure trades in those expiries, although it's apparent that you won't get much trading February over January due to the fairly small differential between where those two contracts are trading at the moment. In practical terms, the February 17/19 short call vertical is paying .65 with a 17.65 break even versus 17.51; the March 17/19, .65, with a 17.65 versus 17.63. In other words, it doesn't pay to go longer in duration (February versus March) here ... .
As before, I'll look to put on bullish assumption plays in VXX or UVXY at extreme lows (these setups don't work well in VIX directly due to /VX term structure) and add bearish assumption in VIX, VXX, and/or UVXY on VIX pops to greater than 20 on top of any VIX term structure trades that I'm working ... .


LULU in Speculative Run at New HighLULU has been trending upward and gaining momentum as it enters a new all time high price level.

Rising wedgeIf it looks like bird, smells like a plane and talks like a crow then it’s a rising wedge. Lol for real though

Lululemon (LULU) moves off Trendline Support and Breaks HigherLULU has been rising in a trend channel since April. The price recently pulled back to channel support and then consolidated there. On Oct 10 the price broke above the consolidation signaling a long entry.
The chart shows two trade scenarios. One is entering when the price breaks above the consolidation. This trade has a 6:1 reward to risk based on the estimated exit (top of channel). Spotting the channel and the consolidation would have alerted a trader to be on the lookout for an upside breakout. I posted this on Oct 9 in my free Facebook swing trading group (www.facebook.com). An order could have been placed to enter when the price broke above the consolidation high.
The other scenario is a late entry near the closing price on Oct 10. Still a good trade potentially, but the reward:risk drops to about 3:1.

$IWMThinking about shorting the golden ratio/200 MA for a day trade - medium/big size position, since SL is tight. Close above that will look for longs aiming for trendline resistance

LULU Long (Naked Call)
Lulu has been solid channel up since December 2018. We broke new highs in early April 2019 and have since been grinding higher.
- At market close we are at a resistance level of about $190. If we gap up on Monday, I will be looking for an entry on a lower time frame at this same level of resistance to go long.
- However, if we get rejected at this price level, I will be looking for an entry when price touches the 21 EMA.


LULU EARNINGSSo we netted a 2000% return on Dave & Busters puts, let's take a look at another bigger name is a small earnings group of mostly no names.
LULU should be a good play. STRADDLE this with some options.
I'll give us an upside potential of $183.00 and if things get ugly a downside target of $133.00.
Let me know your thoughts in the comments below and have a great day.
