Luna at strong supportLuna is currently sitting at strong support ,
An upward move is expected , NFA, DYOR
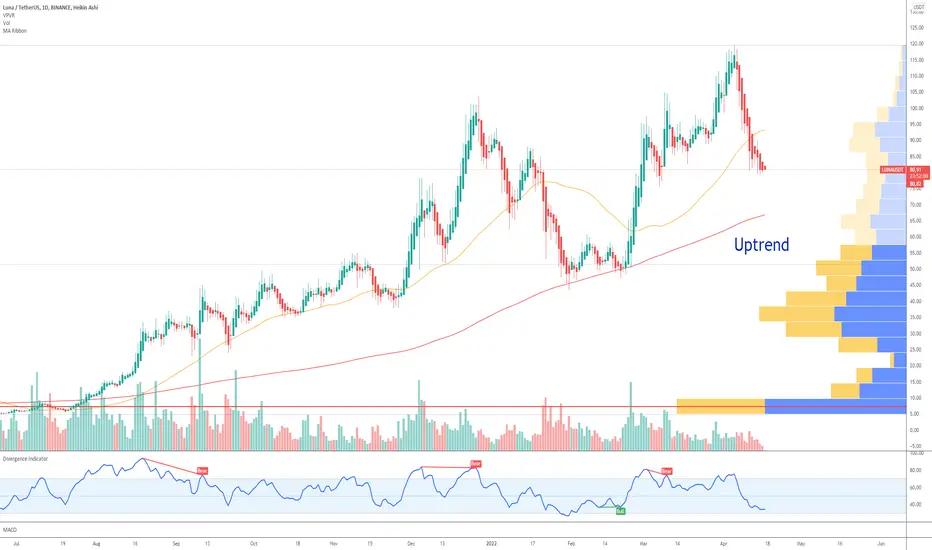
LUNAUSDT


where is the bottom ?at the moment there is a strong support at 50$ area , considering the fast burning process of LUNA , it seems it is going to be a good buy at these point , DCA is always useful

BUY LUNA📍SIGNAL ID: #031📍
COIN: LUNA/USDT ( Sport / 10x )
Positions : BUY / LONG 🚨
➖➖➖➖➖➖➖
Entry > $79
SL max $63
TP max $95

Terra (LUNA) - April 18hello?
Traders, welcome.
If you "follow", you can always get new information quickly.
Please also click "Like".
Have a nice day.
-------------------------------------
(LUNAUSDT 1W Chart)
You need to make sure you can rise within the rising channel.
Above 52.16: Expected to make a new wave.
Below 34.69: There is a possibility of entering the mid- to long-term investment area.
(1D chart)
I think it's very risky to buy on the spot.
Therefore, it is important to check how it is supported over the 66.95-69.44 section.
------------------------------------------------------------ -----------------------------------------------------
** All indicators are lagging indicators.
Therefore, it is important to be aware that the indicator will move accordingly as price and volume move.
However, for convenience, we are talking in reverse for the interpretation of the indicator.
** The MRHAB-T indicator used in the chart is an indicator of our channel that has not been released yet.
** The OBV indicator was re-created by applying a formula to the DepthHouse Trading indicator, an indicator disclosed by oh92. (Thanks for this.)
** Support or resistance is based on the closing price of the 1D chart.
** All descriptions are for reference only and do not guarantee a profit or loss in investment.
(Short-term Stop Loss can be said to be a point where profit and loss can be preserved or additional entry can be made through split trading. It is a short-term investment perspective.)
---------------------------------

LUNA Ending diagonal on the 4hrEnding diagonal to end the 🌊 (A) . Then a big move to the upside for 🌊 (C). This week.

LUNA UpdateWhat I'm seeing (and I could always be wrong) is a 5-3-5 corrective pattern. The 5th wave of (A) will be an ending diagonal at around 77.90, which will lead up to a (B) wave that will close between the 0.382 and 50% fib area. Then it will make it's descent down to the major support/demand area around 57-47 range to complete wave (C).
The (C) went could be shortened or whatever, but when looking at the weekly that major support looks like a landing pad.
But again my TA is just a reference to whatever you are seeing. I will be closing my shorts when the (B) is identified. Probably here soon, then riding the wave till it produces a closed swing for me up finish shorting.
Happy Easter 🐇

LUNA owns $1.7 billion in BTCLuna Foundation Guard wallet contains $1.7 billion in BTC.
In total, 42,410 BTC, the 19th largest wallet in total bitcoin holdings.
LUNA is still in an uptrend, despite the recent correction.
It`s above the 200 MA.
FAILED ESSENTIAL LUNA 'S SUPPORT !!!
Our previous trendline support is failed and have shifted to a significant channel. The channel floor and static support has made a kind of prz that may see a rejection.

LUNA possible sideways trend.Hello everyone, let's take a look at the LUNA to USDT chart in 1 day. As you can see, the price is moving in an uptrend channel marked with blue lines.
Let's start with the line of support and as you can see the first support is $ 73, if the support breaks down, the next is $ 60, and the next is $ 44.
Now let's move from the resistance line as you can see the first resistance is $ 88, if you can break it the next resistance will be $ 94 and $ 99.
Looking at the CHOP indicator, we can see that in the 1D interval the energy has been used. We can expect LUNA to follow a sideways trend if BTC remains stable.

LUNA Trading zonesIf you are a LUNA Trader and looking for long zones..
Note this is a HVA requires small size. For this reason, if you are going to invest based on core fundamentals, then the TECH zone noted much lower is for you... but nonetheless, Price action methods and TECH analysis remains the same regardless of what we are Trading.
BTC/ETH and those alike are much safer to trade, so if you have a preference it is better to pick those.. There are those however who want to trade LUNA and it is OK to do so if you are trading safely and accurately..
It is on these assets you must concur about the fundamental side in your own process. Trade HVA's small in doing so.

lunaluna After reaching the support area and breaking the downtrend line in the rsi indicator also has a positive divergence and has given us a good entry point.

Special analysis of LUNALuna is well supported in the $ 75-80 range, buying in this range can be very low risk.

$LUNA ready to reverse downward trend?$LUNA seems to have found support on the 200 EMA on the 12 hr chart. Perhaps it's ready to reverse the downward trend and head north?
Agree? Disagree? Comment to explain...
NFA! New to TA and trend analysis. TFWIW.

LUNA daily chart showing Hidden Bullish Divergence. Its Go TimeLUNA, Daily Chart: This Chart is standing out to me
currently. DeMark9 Indicator is reading "BUY"
The 100 day ema is support, 50 day ema is first
resistance, and Hull Suite is the 3rd resistance.
Its above the Bull Market support band..
.Rsi is reading Hidden Bullish Divergence. Its Go Time! Look at the
Circled % gains on the right side.


🐻 LUNA Bearish 📉LUNA is looking quite bearish with the daily candle being a bearish engulfing.
I have labelled out key points of the chart to watch.

LUNALUNA update:
Invalidation ng bearish engulfing candlestick 94 if ma- proclaim ulit natin. A bearish divergence sa weekly. Still bears in control pa rin sa Luna.


Luna/UsdtLuna received Long Signal on Binance 15m chart pattern
Note: Before taking any Position Keep eye on Bitcoin Behavior

Flag 💔It didn't quite reach the 90ish area but it is starting to break down lovely. Target still in my scopes. I believe this is the beginning of the 5th wave down if I counted right. 🧐 Stoch RSI bearish. Volume up and red. May restest resistance but overall look out below🗣️
🧸🍯


LUNA - Trend-Following Setup!Hello everyone, if you like the idea, do not forget to support with a like and follow.
LUNA is overall bullish trading inside the blue channels.
Moreover, 60.0 is a strong demand zone.
So the highlighted purple circle is a strong area to look for buy setups as it is the intersection of the green demand and lower blue trendline. (acting as non-horizontal support)
As per my trading style:
As LUNA approaches the purple circle zone, I will be looking for bullish reversal setups (like a double bottom pattern, trendline break , and so on...)
Always follow your trading plan regarding entry, risk management, and trade management.
Good luck!
All Strategies Are Good; If Managed Properly!
~Rich
