$lyft daily-Bearish cross on Macd incoming
-Break of symmetrical triangle
-Large volume for confirmation
-Targets indicated below
Lyft

$LYFT is Set for Action.. and Significant Differences of OpinionLYFT is in a tough spot. Frankly, we don't love this one because both it and UBER are SV VC plays built solely on a thesis of private sector autonomous vehicles in coming years. That's the payoff. But there are plenty of signals that suggest that thesis could die of either public-sector rules or a longer timeframe.
But expect it to be "in play" tomorrow after better than expected Q2 results. Everyone knew demand would be awful. $32.50 means $40.

Why Most Traders Lose Money - Here Are The Top 3 ReasonsAnyone that has been around the markets and trading for any period of time has probably heard that most traders lose money.
In fact, there’s actually an old trading adage that says:
90% of new traders will lose 90% of their account within 90 days.
So after reading that, before you reach for your broker’s phone number to wire out all of your money… how about I let you in on a little secret:
If you follow some simple rules and avoid these 3 mistakes, you can be in that minority of traders that actually make money consistently in the markets.
And if you are currently making one or all of the mistakes, I’ll also show you exactly how to fix it.
So let’s dive in!
1) Most Traders Enter A Trade Too Late
The first thing on my top 3 reasons why traders lose money is: Most traders get into trades WAY too late!
There are a lot of reasons this happens, but most commonly it’s because new traders are basically gambling. They’re buying stocks or options based on news, or a hot stock tip, which really isn’t what I would consider a strategy.
So let me give you a great example with a company I’m sure you’ve heard of: Uber Technologies (Yes, enemy #1 for taxi drivers worldwide.)
Last year Uber, known for its popular ride-sharing and food delivery services, IPO’d in May (2019).
With the disruption this company caused, their IPO had a lot of hype surrounding it, bringing a lot of investors to the table.
On the day of their IPO, UBER opened at $42/share and people poured into the stock.
For a few weeks, the stock had a turbulent, roller coaster of a ride all the way to as high as $47.08/share, a little over a 13% increase since its IPO.
And around this new high, more and more inexperienced retail traders piled in thinking that it would continue its bullish run with dollar signs in their eyes.
The mainstream media was continuing to hype it and more and more and investors and traders gobbled up more of the stock.
Looking at the image below, you’ll see after that high of $47 things got UGLY fast, with UBER falling day-after-day, week-after-week.
It wasn’t until November of 2019, about 7 months after their IPO that UBER found a temporary bottom at $25.58, down more than 45% from its high of $47.08… and I would bet there were a LOT of people who bought near or at the highs and were still holding at that point.
So what did retailer traders do when UBER made a bottom?
Yes, once again most (losing) retail traders didn’t get in at, or even around the bottom… once again, they piled as UBER neared its previous highs.
And as you’ll see yet again, UBER rolled over on its way to making another new all-time low this past March 2020 going all the way down to $13.71/share.
That’s more than a 70% decrease from its ATH and yes, I’m sure some investors rode it all the way to the bottom.
Now I want to share a second example with you, so let’s take a look at Amazon (AMZN).
So as you know, AMZN is a HOT STOCK, and last year it has a crazy move where it crossed $2000/share…. and yes, just like our example with UBER, inexperienced retail traders piled in at the very top.
Once again, in the weeks that followed, AMZN’s stock tanked leaving those who’d piled in dazed and confused, now holding onto sizable losses.
So as you can see, the first of my top 3 reasons most traders are losing money is simply because they’re piling in way too late in a stock’s move, generally near a high.
Now on to reason number 2:
2) Most Traders EXIT Too Late
Yes, as you can imagine if people are getting in too late, well, they’re also typically getting out too late as well.
So let’s talk about why this happens. Why do retail traders tend to hold onto trades way too long, either turning a small loss into a BIG loss or sometimes even more painful, turning a winner into a loser?
Let’s take a look at another example with an UBER competitor, LYFT .
Like UBER, LYFT also had its IPO in 2019, opening up at $87.24/share… but that didn’t last long.
In less than two months, LYFT went as low as $47.17… and what do you think those who bought during the IPO are saying right about now:
“Oh, I’m holding it because IT WILL TURN AROUND!”
This is generally where I see traders get religious 😉
Instead of ‘taking their medicine’ and getting out when the trade moved against them, they held on and are now pleading and praying the stock will turn around.
I hate to be the one to break it to you, but ‘hope’ is not a strategy… at least not one with a winning trading record.
Now on to number three in our list of top reasons why most traders lose money:
3) They Don’t Have A Trading Strategy
As you’ll see, I’ve saved the best for last as this one alone can help fix or eliminate the other two we just discussed.
So first, let’s answer this question: What Is A Trading Strategy?
Well, a trading strategy gives you three key pieces of information you need before ever entering a trade:
1) It tells you WHAT you are trading. Is it stocks, options, futures, cryptocurrencies? This is answered in your trading strategy.
2) It answers when you ENTER a trade.
3) It answers when you EXIT a trade and that’s exiting with a profit or loss.
Now, let’s take a look at an example here using TSLA on how I make decisions trading.
I like to look at three different indicators, that when in alignment, give me a clear signal to go long or short a stock or ETF.
As you can see on the charts, back in December of last year (2019) my indicators gave us a long signal on TSLA at around $370/share.
TSLA Chart
And the indicators told me we were good to go until around $850/share. All I had to do is let the indicators tell me when to get in and when to get out… no guessing, hoping, or praying.
Summary
So as you can see, there’s actually no big secret to why most traders are losing money.
It’s actually pretty simple to see and correct, but it takes a plan and a little bit of discipline.

$lyft Daily- Inverted hammer
- Not much support below $29.30ish
- Gap fill to $23
- Earnings tomorrow

$UBER 1h/30m- After bear flag break, clear selling volume selling drying up
- rounding bottom reversal pattern
- pick in volume to the upside
- coming into volume shelf
- 30 minute wick has some down side selling pressure into the volume shelf

THE WEEK AHEAD: LYFT, UAL, MGM, DAL, CNX, SLV, GDXJEARNINGS:
LYFT (20/82/19.8%) announces earnings on Wednesday after the close, so look to put on a play in the waning hours of Wednesday's New York session if you want to play the volatility contraction.
Pictured here is a directionally neutral 29/38 short strangle camped out at the 20 delta in the September monthly. Paying 1.26 as of Friday close, it has 27.74/39.26 break evens, which are wide of 2 times the expected move on the call side, but somewhat short of 2 times on the put side due to skew; delta/theta .25/3.58.
You'll have to go somewhat tighter (the 25 delta) to get one-third the width out of an iron condor, with the 27/30/37/40 iron condor paying .97; 29.03/37.97 break evens, which are at the expected move on both sides; delta/theta 2/1.31.
I've stuck on an UBER line just to show how LYFT's competitor did with its earnings in the coronavirus environment ... .
CSCO (28/36/8.4%) also announces, but has less than ideal metrics for a volatility contraction play.
EARNINGS AFTERGLOW:
There are a number of underlyings with earnings in the rear view that still have sufficient implied to potentially make them worthwhile just as pure premium selling plays. Here are a number of them, ranked by the percentage that the September at-the-money short straddle is paying relative to stock price and screened for those paying greater than 15%:
UAL: 20.8%
MGM: 17.7%
DAL: 17.7%
CNX: 17.6%
WYNN: 16.9%
PINS: 16.1%
ROKU: 16.0%
BYND: 15.8%
SNAP: 15.7%
BA: 15.3%
SQ: 15.2%
AMD: 15.1%
LUV: 15.1%
I may pick one or more of these if I have nothing better to do, keeping in mind correlations here (i.e., UAL, DAL, and LUV are all airlines; BA is airline-related).
EXCHANGE-TRADED FUNDS, RANKED BY SEPTEMBER AT-THE-MONEY SHORT STRADDLE PRICE/STOCK PRICE RATIO AND SCREENED FOR >35% 30-DAY IMPLIED:
SLV (70/81/19.9%)
GDXJ (24/62/15.6%)
GDX (24/43/12.8%)
XOP (11/48/12.7%)
EWZ (18/43/11.2%)
Here, I've screened out those paying <10%. I'm in an August GDXJ play, but may re-up with a SLV, even though there is going to be some correlation with miners. The September 18th 20 delta 22/36 short strangle was paying 1.45 as of Friday close, with the 25 delta 20/23/33.5/36 iron condor paying .99. There is some massive call side skew to potentially accommodate here, so could see going "double double" (double the contracts on the put side, but double the width on the call).
Two Examples: September 18th 2 x 18/2 x 20.5/33/38 "double double" iron condor, paying .98 or September 18th 2 x 15.5/2 x 25.5/33.5/44 "double double", paying 1.30, the latter of which approaches the metrics of the naked short strangle.
BROAD MARKET EXCHANGE-TRADED FUNDS:
Most of the fun has bled out ... :
IWM (25/30/7.3%)
QQQ (25/28/7.2%)
EFA (17/21/4.8%)
SPY (15/22/5.1%)

$LYFT Daily- Giant bear flag
- Uber weakness
- Break below parallel channel, first support at 28
- Gap fill $23

$LYFT 4hr- GIANT bear flag
- Uber report shows sign of weakness, only propped up by Uber eats, which Lyft does not have.
- Looking to fill gap to $22.20

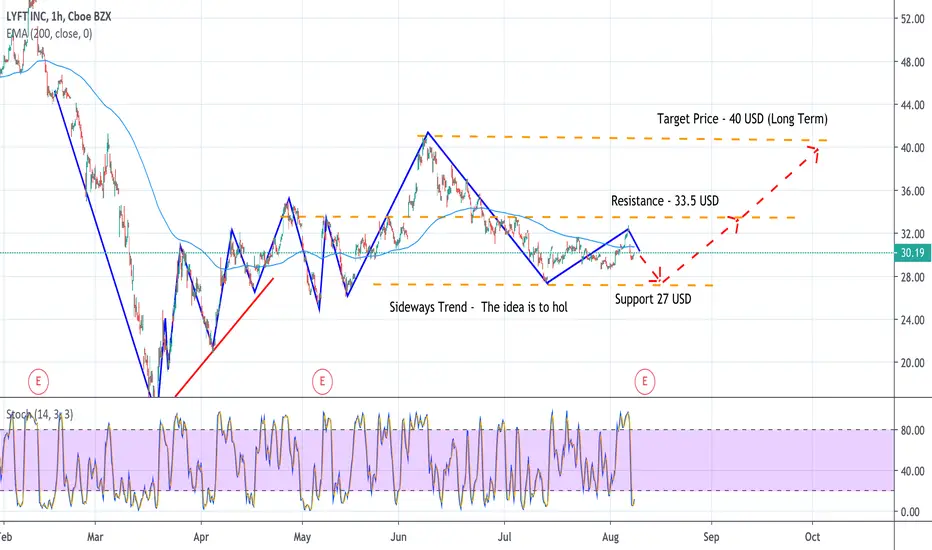
LYFT Stock AnalysisSideways Trend - The idea is to hold.
Wait that the prices will reach the bottom support line before going long.

LYFT BACK TO 40 lyft looking to breakout. probably pull back and see a breakout next monday. looking good

LYFT - ShortWhats up Traders -
Made a nice trade on Lyft last week . . Following up on it this week with a swing trade.
We're looking at Lyft Puts - $30 - 7/24
Theyre currently trading at about .80c giving us a solid 2.5x RR for the trade.
Seeing a break in the uptrend and expecting us to re-test lows. I doubt we will hold this option full term, but i am prepared to.
Let me know if you have any questions or see things differently.

Waiting for Pullback to Short.Lyft is still on major downtrend. IF you are keen, you may wait for a pullback to short this counter. I have draw 2 channel (blue major downtrend & Red temporary uptrend).
If the price breakthrough blue channel, downtrend will be invalid. therefore SL can set anything above the blue channel.
Short @ $38
SL @ $44
TP @ Ride with the trend

Uber Short- Long technical analysisNYSE:UBER
Pullback occurred next week gap will be filled and I marked the PT.
Stay Tuned

Lyft Stock will go upLyft Stock will go up.
**Disclaimer** the content on this analysis is subject to change at any time without notice, and is provided for the sole purpose of assisting traders to make independent investment decisions.

LYFT - Technical AnalysisThe Idea is to go long only if the resistances/target prices will be broken.
LYFT - Ascending - Pushing higherPushing it to $40 range : New ebitda forecast , re-opening of economy

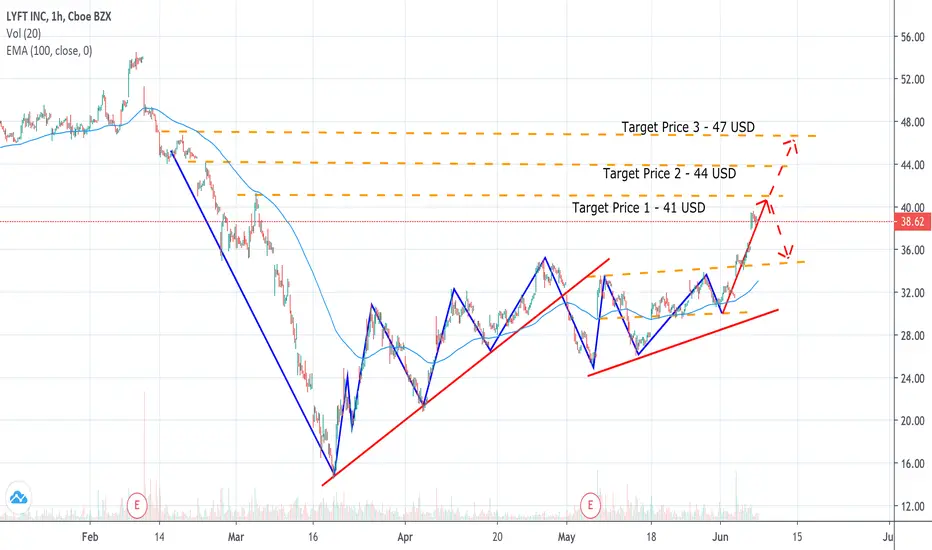
LYFT BreakoutAfter our March low, we've rallied +140% off the lows and formed a huge ascending triangle. Given our bullish momentum, it's likely we continue upwards into the green zones highlighted around the $40 and $47 marks.
RSI is not oversold and has been coiling, which shows signs of momentum heating up with plenty of room of run. If we break out from here, there is a high probability we fill the liquidity void above us in the $40-$50 range. Watching this one closely.
First target: ~$40 for a 20% gain
Second target: $48 for a 50% gain.

Uber vs Lyft - Technical AnalysisUber and Lyft seem ready to go up to the price level that they had before the virus.
The Idea is to Buy Uber or Lyft, just wait the right time as Uber might start a retracement price.
It seems that there might be more margin investing in Lyft as it should go up to close the gap with Uber (Uber is moving uptrend, while Lyft is moving sideways).

LYFT ($LYFT) - Trendline Rejection25% gap up? I'm not buying it! Trading the trend-line rejection targeting the $25 area.

LYFT - GREAT Buy Opportunity, IF ... !!Hello! Friends,
This would be a great Buy Opportunity, IF NASDAQ:LYFT breaks up the Resistance !!

UBER Technical and Fundamental Analysis - Short termNYSE:UBER
Based on Technical, but mostly on fundamental analysis, Uber, for a short term analysis should go down.
UBER has to face a lawsuit claiming its illegal predatory pricing and other anticompetitive practices killing competition, including the accusation of secretly booking and cancelling rides on competitors' app.
Lyft keeps following UBER and Vice versa, it might imply that the Uber's fundamental information did not have anY impact on the priceS or, the Uber's prices already take in account in the fundamental information (BEARISH MARKET) and that Lyft stock tend to follow UBER.

LYFT - FAKE UP-TRENDLINE BREAKThis is a company which in these times
quarantine demand has increased
like UBER, which positions it
among the most valuable companies in matters
mobility, which gives me to understand that this
movement you're having is just a throwback
to trick sellers into believing
to change the trend, when simply
will make a correction and continue its course to the upside
possibly making a higher stop (HH)
In the next weeks
