BTC to create a low and then a new ATH!BTC may go low around 95k before pushing for a new ATH. This analysis is based on past price action as seen in red lines and previous circles. It confirms to the basic market structure analysis of HH, HL and HH.
However, do note that past price actions do not indicate certainty of future price. DYOR
M-oscillator

Skeptic |EUR/USD : Bearish Breakout Unlocks Deep Corrections!Hey everyone, Skeptic here! Let’s start this Friday morning with a fresh EUR/USD analysis—some juicy setups are waiting! 😊 Our previous long position after the 1.13485 resistance break turned out to be a fake breakout, hitting our stop loss. But the short trigger I mentioned below 1.12676 activated, hitting a 2:1 R/R with a safe stop loss. Now, we’ve seen a pullback to that broken level, and if the trend continues, we can find more solid triggers. Stick with me to break it all down! Let’s start with the Daily Timeframe. 📊
📅 Daily Timeframe: The Big Picture
The upward channel on the daily chart has finally broken , and when we talk about a channel break, we don’t mean a weak one—this was confirmed by two strong bearish candles. We might see a pullback to the channel, but if not, a break below the 1.12006 support could send us into a deeper correction toward 1.08454 . To confirm a full trend reversal, we’d need to see lower highs and lower lows on the daily.
So, with this in mind, it’s smarter to take positions in lower timeframes (like 4H or below) in the direction of the current bearish momentum to boost your win rate and R/R. Let’s zoom into the 4-Hour Timeframe for the actionable setups.
⏰ 4-Hour Timeframe: Long & Short Setups
After a prolonged box range and a fake breakout above the box’s ceiling, the price has now broken lower and is pulling back. For our short setup, we already have a position open from above at 1.12676 . But after a break of 1.12012 (which aligns with daily support), we can add to our position—with proper capital and risk management, of course.
Another confirmation for the short? The RSI entering oversold territory can be a solid signal. Why oversold? We need tools to gauge momentum, like SMA, RSI, or volume (though volume only works well in crypto since forex volume isn’t transparent due to bank transactions, etc. In crypto, every transaction is recorded, so volume is reliable). RSI is one of my go-to tools for spotting momentum shifts, and it’s been a profit machine for me. But remember: oscillators and indicators aren’t entry signals —they’re confirmations for the setups we’re trading. Want to learn more? I could drop a few YouTube videos on RSI alone—it’s worth the deep dive! 📚
For a long setup , we’d need a return to the box range and a break above resistance at 1.13740 to open a long. I’m not giving any long triggers before that because, as we said, the daily momentum has shifted to a downtrend, and we don’t want to trade against the higher timeframe flow.
💬 Let’s Talk!
If this analysis helped you out, give it a quick boost—it means a lot! 😊 Got a pair or setup you want me to tackle next? Drop it in the comments, and I’ll get to it. Thanks for hanging out, and I’ll see you in the next one. Keep trading smart! ✌️

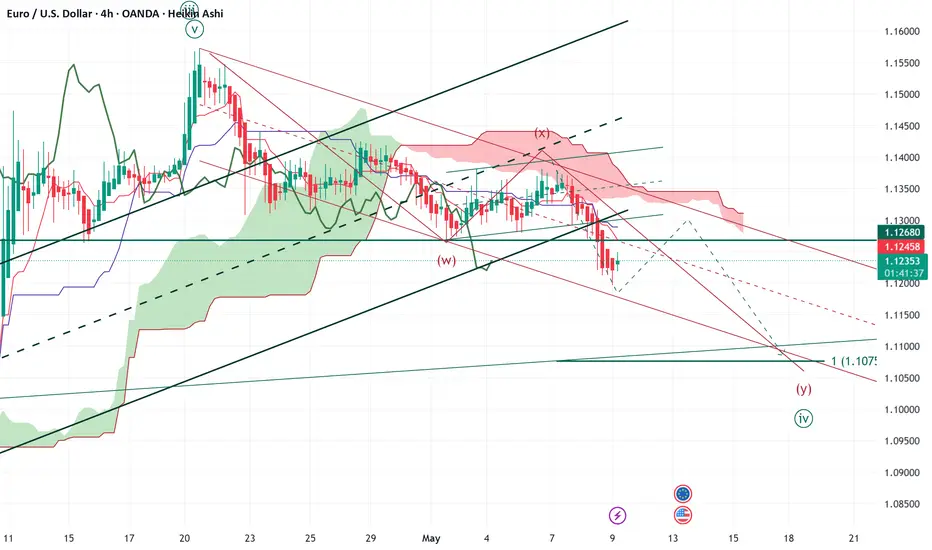
EWTSU EURUSD H4 minute wave ((4)) update
Elliott Wave Trade Set Up H4 EURUSD
minute wave ((4)) developping in a complex zigzag (double)
minuette (y) running in 3 waves to 1.1070 area - (w)=(y)
invalidation: price break steadly over 1.1370 area
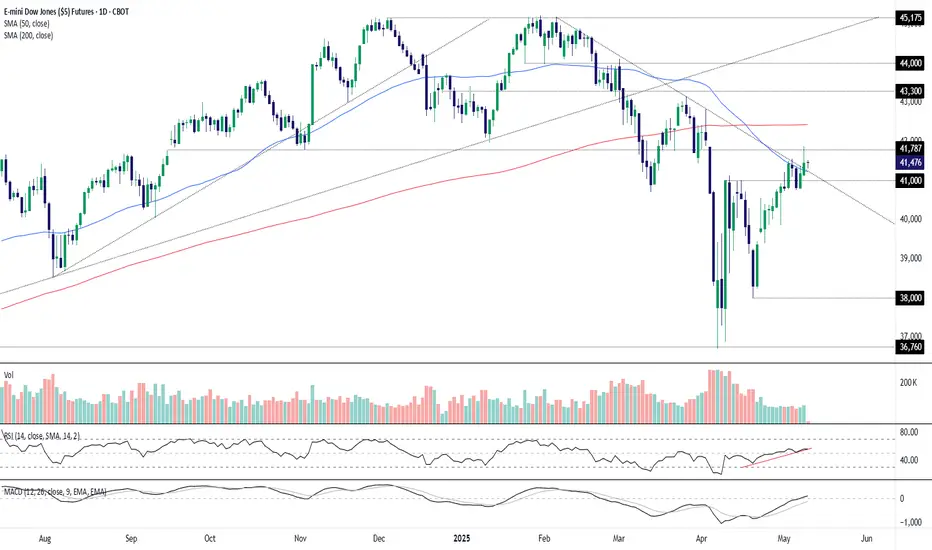
Dow Futures: Bullish Break in Play as Key Resistance FallsDow futures cleared not only the 200DMA on Thursday but also downtrend resistance dating back to the record highs set in February, suggesting a new trend may now be underway. While the initial rejection at 41787 warrants some caution, with momentum indicators swinging into bullish territory, there’s enough here to consider long setups heading into this weekend’s key trade meeting between the U.S. and China in Switzerland.
One idea would be to buy above the 50DMA with a stop below for protection. 41787 is an early hurdle to clear, with a break above opening the path for a potential run towards the 200DMA—that screens as a reasonable target.
If the price reverses and closes back below the 50DMA, the bullish bias would be invalidated.
Good luck!
DS
EWTSU XAUUSD H4 minute wave ((5)) monitoring
Elliott wave trade setup H4
monitoring the start of minute wave ((5))
minute wave ((5)) should develope in 5 motive waves (impulsive/leading diagonal)
confirmation level: price break up steadly over 3350 area
invalidation level: price break steadly lower 3275 area

BTC.D done or not?I like to think that 65% may be the top for BTC.D, but it cannot be ignored that BTC.D has gone to around 72% in the last three cycles. Will it do the same this cycle?

Attention BTCUSDT may fall in next week!If BTCUSDT fails to break the 101,300 resistance, it could fall to 71,200 next week

EURAUD Wave Analysis – 7 May 2025
- EURAUD reversed from the support zone
- Likely to rise to resistance level 1.7700
EURAUD currency pair recently reversed from the support zone between the support level 1.7415 (former resistance from the start of March), the lower daily Bollinger Band and the 50% Fibonacci correction of the upward impulse from February.
The upward reversal from this support zone stopped the previous short-term impulse wave 3.
Given the strength of the support level 1.7415 and the oversold daily Stochastic, EURAUD currency pair can be expected to rise to the next resistance level 1.7700.

AUDCHF is having Rising WedgesRising wedges on audchf, if break the neckline then we may see further drop to the nearest support

Bullish Divergence for 9618 in dailyGiven the spot of bullish divergence in RSI,
and that 1-2-3-4-5 is potentially completed,
I would like to change my prediction from a bearish market to a bullish market.
The retracement to $115 will be completed in future months.
I estimate 9618 will be raising as B in this month

EUR/AUD: Decision Time at the 50DMAHow EUR/AUD interacts with the 50DMA in the near-term may offer a useful steer on directional risks over the medium-term. For now, it’s bounced off the level, finding buyers after the initial disappointment from China’s latest support measures. Still, the long topside wicks on the past two daily candles, coupled with increasingly bearish momentum, suggest downside risks are building.
A break and close beneath the 50DMA would generate a setup where shorts could be established with a stop above for protection. 1.7113 or 1.7050 screen as targets. Alternatively, if the pair can hold the 50DMA, longs could be established with a stop beneath. 1.7700, 1.7865 or 1.8016 offer targets depending on the desired risk-reward.
Good luck!
DS

DAX Wave Analysis – 6 May 2025
- DAX reversed from key resistance level 23435,00
- Likely to fall to support level 22700.00
DAX index recently reversed down from the key resistance level 23435,00 (which stopped the previous impulse wave (1) in the middle of March).
The resistance level 23435,00 was further strengthened by the upper daily Bollinger Band.
Given the strength of the resistance level 23435,00 and the overbought daily Stochastic, DAX index can be expected to fall to the next support level 22700.00.

OTHERS.D: A New PerspectiveIt looks like we're forming a bottom for altcoins. Altcoin season seems to be getting closer by the day.

MILK's Volume Profile AnalysisThe volume profile for MILK/USDT shows a significant trading cluster around $0.1201. This level could act as a strong support or resistance depending on the market sentiment. Increased volume at this level could lead to a price breakout.

ADP Challenges ResistanceAutomatic Data Processing has moved sideways since the autumn, and now some traders may think it’s ready to move.
The first pattern on today’s chart is the series of lower highs since early March. The payrolls-processing company closed above that falling trendline on Friday, which may suggest it’s breaking resistance.
Next, prices tested and held their rising 200-day simple moving average (SMA). They’ve also fought back above the 50-day SMA. Those signals may be consistent with long- and intermediate-term uptrends.
Third, the 8-day exponential moving average (EMA) just crossed above the 21-day EMA. MACD also turned positive. Those signals may be consistent with short-term bullishness.
Finally, ADP’s results and guidance beat estimates on April 30. The resulting bullish outside candle could also suggest buyers are taking charge.
TradeStation has, for decades, advanced the trading industry, providing access to stocks, options and futures. If you're born to trade, we could be for you. See our Overview for more.
Past performance, whether actual or indicated by historical tests of strategies, is no guarantee of future performance or success. There is a possibility that you may sustain a loss equal to or greater than your entire investment regardless of which asset class you trade (equities, options or futures); therefore, you should not invest or risk money that you cannot afford to lose. Online trading is not suitable for all investors. View the document titled Characteristics and Risks of Standardized Options at www.TradeStation.com . Before trading any asset class, customers must read the relevant risk disclosure statements on www.TradeStation.com . System access and trade placement and execution may be delayed or fail due to market volatility and volume, quote delays, system and software errors, Internet traffic, outages and other factors.
Securities and futures trading is offered to self-directed customers by TradeStation Securities, Inc., a broker-dealer registered with the Securities and Exchange Commission and a futures commission merchant licensed with the Commodity Futures Trading Commission). TradeStation Securities is a member of the Financial Industry Regulatory Authority, the National Futures Association, and a number of exchanges.
TradeStation Securities, Inc. and TradeStation Technologies, Inc. are each wholly owned subsidiaries of TradeStation Group, Inc., both operating, and providing products and services, under the TradeStation brand and trademark. When applying for, or purchasing, accounts, subscriptions, products and services, it is important that you know which company you will be dealing with. Visit www.TradeStation.com for further important information explaining what this means.

Aussie Perks Up As Asia NapsAUD/USD closed last week at the highest level of 2025 and has extended the move today, pushing above the key 200-day moving average. The rally coincides with further strength in the offshore-traded Chinese yuan, which also finished last week at 2025 highs against the U.S. dollar.
While the price action is undeniably bullish—mirrored by strengthening momentum indicators—light turnover due to holidays across much of Asia warrants caution. The European open may offer a clearer read on whether this break above the 200DMA will stick.
If there’s no immediate reversal during European trade, traders may consider establishing longs with a tight stop below the 200DMA, targeting resistance near .6550. Alternatively, a move back beneath the 200DMA—echoing Friday’s reversal—could open the door for shorts, with uptrend support around .6370 and the 50DMA below that as possible downside targets.
Good luck!
DS

ABT round 2 about to start Yes look at round one at the bottom. Are we to repeat this pattern? Most likely. ABT couldn’t even back test the old high. Far too bullish!
The RSI bottomed out on the weekly time frame and created huge amounts of bullish divergence.
See you at $19 plus in the future.

RRGB is set to reverse soonEnding diagonal is going to complete until June end and then a trend reversal shall happen. This is supported by very clear and protracted MACD divergence on weekly view.

People can't imagine what's coming...The last time the monthly MACD for ETHBTC made a bullish cross, ETH went from around $175 to almost 5k. At that time the monthly RSI for ETHBTC was at 46. Now it is at 24 and the monthly MACD is still trending downwards but could turn anytime. Glorious times ahead! No financial advice!
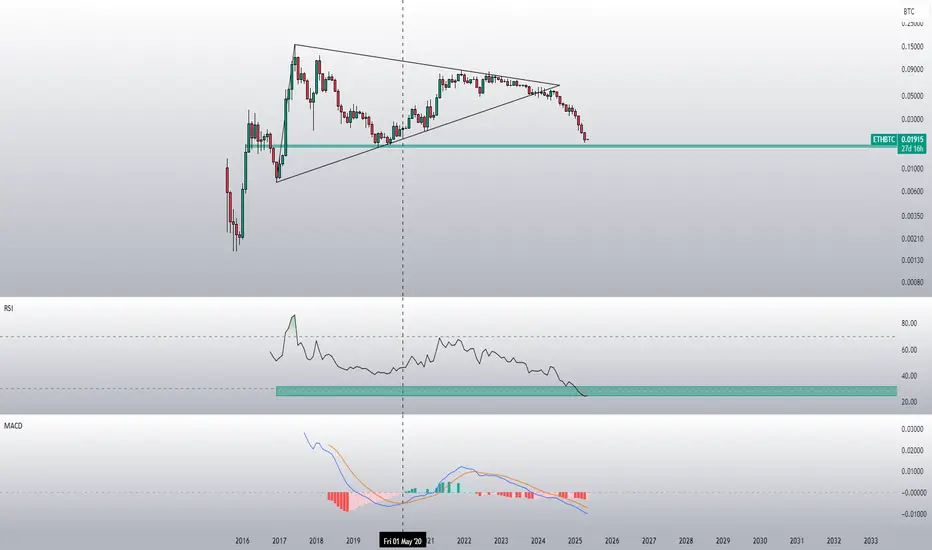
The smell of Altseason...The weekly RSI for ETHBTC is the lowest it has ever been. I expect one last liquidity grab at 0.01615 before the tide turns. No financial advice.

New Bitcoin ATH Incoming? Key Bullish Signals & Decoupling AnalyBitcoin at the Precipice: Analyzing the Confluence of Bullish Signals, Decoupling Dynamics, and the Looming Question of a New All-Time High
The cryptocurrency market, and Bitcoin in particular, exists in a perpetual state of flux, analysis, and fervent speculation. In recent weeks and months, a compelling narrative has begun to coalesce, woven from disparate threads of technical indicators, on-chain data, market dynamics, and historical parallels. Bitcoin, after a period of consolidation and correction, appears to be sending signals that have historically preceded significant upward movements. Analysts are pointing to specific indicators flashing green, a potential local bottom seems confirmed, and intriguing shifts are occurring in mining difficulty and Bitcoin's relationship with the wider altcoin market. All this culminates in the tantalizing question echoing across trading desks and social media: Is a new Bitcoin All-Time High (ATH) incoming, perhaps even within the next year?
This article delves deep into the multifaceted factors fueling this speculation. We will dissect the analyst flags suggesting a major rally, examine the evidence for a confirmed local bottom, explore the significant decoupling of Bitcoin from altcoins, analyze the implications of the shifting mining difficulty, evaluate the compelling comparison to Gold's historical breakout, and assess the technical picture presented by indicators like the Stochastic RSI and Taker Buy/Sell ratio. By synthesizing these elements, we aim to provide a comprehensive overview of the forces currently shaping Bitcoin's trajectory and the arguments underpinning the bullish outlook for a potential new ATH, possibly targeting Q2 2025.
Part 1: Reading the Tea Leaves – Indicators Flagging a Potential Rally
Experienced market analysts often rely on a combination of technical and on-chain indicators to gauge market sentiment and predict future price movements. Recently, several reports have highlighted specific indicators whose current state mirrors conditions observed just before previous major Bitcoin bull runs. While the exact proprietary indicators used by every analyst vary, common themes emerge:
• On-Chain Metrics: These look at the activity happening directly on the Bitcoin blockchain. Key metrics often cited include:
o Supply Dynamics: Tracking the amount of Bitcoin held by long-term holders versus short-term speculators. An increase in long-term holding often suggests accumulation and reduced selling pressure. Metrics like "Supply Last Active 1+ Years Ago" reaching high levels can indicate strong conviction among holders.
o Network Activity: While not always a direct price predictor, sustained growth in active addresses or transaction counts can signal underlying adoption and utility growth.
o Profit/Loss Indicators: Metrics like Net Unrealized Profit/Loss (NUPL) or Spent Output Profit Ratio (SOPR) help gauge whether the market is overheated or potentially finding a bottom. A shift from capitulation (heavy losses) towards profitability can be a bullish sign.
• Technical Indicators: These are derived from price and volume data.
o Moving Averages: Crossovers of key moving averages (e.g., the 50-day moving average crossing above the 200-day moving average, known as a "Golden Cross") are classic bullish signals for many traders. The positioning of price relative to these averages is also crucial.
o Momentum Oscillators: Indicators like the Relative Strength Index (RSI) and the Moving Average Convergence Divergence (MACD) measure the speed and change of price movements. Emerging from oversold conditions or showing bullish divergences can signal strengthening momentum.
• Market Sentiment Indicators: While harder to quantify, tools analyzing social media sentiment, futures market positioning (funding rates, open interest), and options market data (put/call ratios) can provide clues about the prevailing mood among traders.
The core argument presented by analysts is that a confluence of these diverse indicators, many of which have strong historical track records in predicting Bitcoin rallies, are simultaneously aligning in a bullish formation. It's not just one signal, but a pattern across multiple datasets suggesting that the groundwork for a significant upward move is being laid. This historical resonance provides a powerful argument for those anticipating a break towards previous highs.
Part 2: The Confirmed Local Bottom – Building a Foundation for Growth?
Complementing the forward-looking indicators is the assertion that Bitcoin has successfully established a "local bottom." This implies that a recent period of price decline has concluded, and a new support level has been found from which price can potentially rebound. Confirmation of a bottom is often a multi-step process:
1. Price Action: A clear cessation of the downtrend, often marked by a specific low point that holds despite retests. This might involve candlestick patterns indicating reversal (like hammers or engulfing patterns) or the formation of a sideways consolidation range after a fall.
2. Volume: Capitulation volume (a spike in selling volume near the low) followed by declining volume during consolidation, and then potentially increasing volume on upward moves, can support the idea of a bottom.
3. Indicator Confirmation: Technical indicators like the RSI moving out of oversold territory (<30) or MACD showing a bullish crossover below the zero line often accompany bottom formations.
4. Holding Key Support: The price successfully defending a significant historical support level or a key Fibonacci retracement level adds weight to the bottoming argument.
The claim that "all indicators flash bullish" in conjunction with a confirmed local bottom suggests a powerful technical setup. It implies that the selling pressure that drove the price down has exhausted itself, buyers are stepping back in at these levels, and multiple technical measures are signaling renewed upward momentum. Establishing a firm bottom is crucial; without it, any rally attempt could be short-lived. This confirmed base provides psychological reassurance to bulls and a defined level for risk management (placing stop-losses below the confirmed low). The question then shifts from "Will it stop falling?" to "Where is the price headed next?"
Part 3: The Great Crypto Decoupling – Bitcoin Forges Its Own Path
One of the most significant market structure shifts observed over the past year is the growing divergence between Bitcoin and the broader altcoin market. Historically, Bitcoin often acted as the tide lifting all crypto boats; when Bitcoin rallied, altcoins typically followed, often with even greater percentage gains (and vice-versa). However, recent data points to a stark change:
• Record Market Cap Gap: The difference in total market capitalization between Bitcoin and the entire altcoin sector has reportedly reached its largest point ever. This signifies that capital inflows are disproportionately favoring Bitcoin.
• Performance Divergence: While Bitcoin has made significant strides, reclaiming substantial portions of its previous losses and challenging key resistance levels, many altcoins have lagged considerably. Some have even continued to trend downwards relative to both the US Dollar and Bitcoin itself.
• Shift from Tandem Movement: The lockstep correlation that characterized previous cycles appears broken, or at least significantly weakened. Bitcoin is charting a course influenced more by its own specific drivers than by the general sentiment across the entire crypto asset class.
•
Several factors likely contribute to this decoupling:
• Institutional Adoption & ETFs: The launch and success of spot Bitcoin ETFs in the US (and similar products elsewhere) have provided a regulated, accessible channel for institutional capital to flow directly into Bitcoin. This capital is often focused solely on Bitcoin as a digital store of value or portfolio diversifier, largely ignoring the more speculative altcoin market.
• Narrative Strength: Bitcoin's core narrative as "digital gold" – a decentralized, scarce, censorship-resistant store of value – has gained traction, particularly in environments of macroeconomic uncertainty or inflation concerns. This narrative is unique to Bitcoin and doesn't necessarily extend to most altcoins, which often have different value propositions (utility tokens, DeFi platforms, etc.).
• Regulatory Clarity (Relative): While regulatory landscapes are still evolving globally, Bitcoin generally enjoys a greater degree of regulatory clarity (often classified as a commodity in key jurisdictions like the US) compared to many altcoins, which face ongoing scrutiny regarding their potential classification as securities. This perceived lower regulatory risk can make Bitcoin more attractive to cautious investors.
• Flight to Quality: During periods of market uncertainty or following negative events within the broader crypto space (like exchange collapses or protocol exploits), investors may rotate capital from riskier altcoins into the perceived safety and established network effect of Bitcoin.
•
This decoupling has profound implications. For investors, it means diversification within the crypto space is becoming more complex; owning altcoins is no longer a guaranteed way to amplify Bitcoin's gains. For Bitcoin, it suggests a maturation of its asset class status, attracting capital based on its unique properties rather than just general crypto market sentiment. This potentially makes Bitcoin's price action more robust and less susceptible to negative developments in obscure corners of the altcoin market.
Part 4: Mining Difficulty Adjustment – A Breather for the Network's Backbone
The Bitcoin network's health and security rely on miners who dedicate vast computational power to validating transactions and adding new blocks to the blockchain. The "Difficulty" is a crucial network parameter that automatically adjusts roughly every two weeks (every 2016 blocks) to ensure that new blocks are found, on average, every 10 minutes, regardless of how much total mining power (hash rate) is connected to the network.
• How it Works: If blocks are being found too quickly (more hash rate online), the difficulty increases, making it harder to find the next block. If blocks are being found too slowly (hash rate has dropped), the difficulty decreases, making it easier.
• Recent Trend: The report notes that difficulty had increased in the four previous adjustments, indicating a sustained rise in the total hash rate competing on the network.
• Expected Drop: Now, on-chain data forecasts an almost 5% drop in difficulty for the upcoming adjustment. This implies that a noticeable amount of hash rate has recently come offline.
•
Why might hash rate decrease, leading to a difficulty drop?
• Profitability Squeeze: Mining profitability is determined by the price of Bitcoin, the miner's electricity costs, the efficiency of their mining hardware (ASICs), and the current network difficulty. If Bitcoin's price stagnates or drops while difficulty remains high (or energy costs rise), less efficient miners or those with higher operating costs may become unprofitable and shut down their rigs.
• Hardware Cycles: Older generation ASICs become obsolete as newer, more efficient models are released. A difficulty drop might reflect a temporary lull before newer hardware is fully deployed or older hardware being permanently retired.
• External Factors: Regional energy price fluctuations, regulatory changes affecting mining operations in certain areas, or even extreme weather events impacting large mining facilities can temporarily reduce the global hash rate.
What are the implications of a difficulty drop?
• A Break for Miners: For the remaining miners, a lower difficulty means they have a slightly higher chance of finding the next block with the same amount of hash power. This can improve their profitability, potentially reducing the need for them to sell mined Bitcoin immediately to cover operational expenses. Reduced selling pressure from miners is generally considered a positive market factor.
• Network Self-Regulation: It demonstrates the robustness of Bitcoin's design – the network automatically adjusts to maintain its target block time, ensuring consistent transaction processing regardless of fluctuations in mining participation.
• Not Necessarily Bearish: While a significant drop could signal miner capitulation in a deep bear market, a moderate drop after a period of sustained increases might simply be a healthy cooldown or consolidation phase in hash rate growth, allowing the ecosystem to adjust.
This expected difficulty drop, therefore, provides a welcome respite for miners, potentially easing selling pressure and showcasing the network's adaptive capabilities.
Part 5: Technical Signals and Historical Echoes – Stochastic RSI, Taker Ratio, and the Gold Fractal
Beyond the broader indicators and market dynamics, specific technical signals and historical chart patterns are adding fuel to the bullish fire:
• Bitcoin Stochastic RSI: The Stochastic RSI is a momentum indicator that uses RSI values (rather than price) within a stochastic oscillator formula. It ranges between 0 and 100 and is used to identify overbought and oversold conditions, but often more effectively in identifying strengthening momentum. A signal suggesting "brewing bullish momentum" likely means the Stochastic RSI is rising from oversold levels or showing a bullish crossover, indicating that underlying momentum (as measured by RSI) is accelerating upwards. Such signals often precede periods of strong price appreciation.
• Taker Buy/Sell Ratio (Binance): This ratio measures the aggression of buyers versus sellers executing market orders (takers) on a specific exchange (in this case, Binance, a major hub for crypto trading). A "sharp increase" in the Taker Buy Ratio (or Buy/Sell Ratio) signifies that buyers are aggressively hitting the ask price to acquire Bitcoin, willing to pay the market price rather than waiting for their limit orders to be filled. This indicates strong immediate demand and buying pressure, often interpreted as a bullish signal suggesting conviction among buyers.
• Bitcoin Mirroring Gold's Breakout Structure: This is a fascinating observation based on fractal analysis – the idea that chart patterns can repeat themselves across different time scales and different assets. The claim is that Bitcoin's current price structure (consolidation patterns, corrections, subsequent recovery) closely resembles the structure Gold exhibited before one of its major historical breakouts. If this fractal pattern holds true, it suggests Bitcoin might be in the final stages of consolidation before a significant upward move, mirroring Gold's past trajectory. This analysis leads to the specific, albeit highly speculative, prediction of a potential new ATH occurring in Q2 2025. While historical parallels are not guarantees, they provide a compelling narrative and roadmap for traders looking for historical context.
• Sandwiched Between Support & Resistance: This describes the immediate technical battleground. Bitcoin's price is currently caught in a range defined by a significant support level below (a price floor where buying interest has previously emerged) and a major resistance level above (a price ceiling where selling pressure has previously intensified). The outcome of this battle is critical. Can the bulls, bolstered by the positive indicators and dynamics discussed, muster enough strength to break decisively above resistance? Or will the bears successfully defend that level, potentially leading to another rejection or further consolidation? This price zone represents the current line in the sand.
Part 6: Synthesis and Outlook – Weighing the Evidence for a New ATH
Synthesizing these diverse factors paints a complex but potentially bullish picture for Bitcoin:
• The Bullish Case: Multiple historically reliable indicators are signaling conditions that preceded past rallies. A local bottom appears confirmed, providing a stable base. Bitcoin is increasingly decoupling from the riskier altcoin market, potentially attracting more focused institutional capital via ETFs. A looming drop in mining difficulty could ease selling pressure from miners. Specific technical indicators like the Stochastic RSI and Taker Buy/Sell Ratio point towards growing buying momentum and aggression. Furthermore, a compelling (though speculative) historical parallel with Gold's breakout structure offers a potential roadmap towards a new ATH, perhaps by Q2 2025.
• The Hurdles and Risks: Despite the bullish signals, significant resistance levels lie ahead, representing areas where sellers have previously overwhelmed buyers. Macroeconomic uncertainty (inflation, interest rates, geopolitical events) can always impact risk assets like Bitcoin. Regulatory developments, while potentially clarifying for Bitcoin, remain a source of potential volatility. The crypto market is inherently volatile, and unforeseen events ("black swans") can rapidly alter market sentiment. The Gold fractal is a historical observation, not a guarantee.
Conclusion:
Bitcoin currently stands at a fascinating juncture. The confluence of bullish indicators flagged by analysts, the apparent confirmation of a local bottom, the significant decoupling from altcoins driven partly by institutional flows, the potential easing of pressure on miners via a difficulty drop, and specific technical signals like the Stochastic RSI and Taker Buy Ratio collectively build a strong case for optimism. The comparison to Gold's historical breakout adds another layer of intrigue, offering a specific (though speculative) timeline for a potential new All-Time High.
However, optimism must be tempered with caution. Major resistance levels loom large, representing the immediate challenge for bulls. The broader macroeconomic and regulatory environments remain key variables. While the indicators suggest brewing momentum and historical patterns offer encouraging parallels, breaking through established resistance and embarking on a sustained rally towards a new ATH is never a certainty in the volatile world of cryptocurrency.
The coming weeks and months will be crucial in determining whether the bullish signals translate into decisive price action. Can the bulls overcome the resistance that currently sandwiches the price? Will the decoupling trend continue to funnel capital into Bitcoin? Will the mining landscape stabilize favorably? The answers to these questions will likely determine if the whispers of an incoming ATH, potentially mirroring Gold's path towards Q2 2025, become a roar or fade back into the market noise. The stage seems set, the indicators are aligning, but the final act is yet to be written.

EURUSD Technical Expert Review - 3 May 2025📊 Comprehensive Analysis – Multi-Layered Setup Based on LQ Close + Classic Liquidity Manipulation
✅ 1. Proper Reaction to 8H LQ Close Zone
Price reacted accurately to the 8-hour LQ Close zone. However, the 40% level of the ATI candle remains untouched. If price revisits this area, we can expect a potential sell setup, especially if we get confirmation through structure breaks, engulfing candles, or ATI invalidation.
🧠 2. Manipulation of Classic Liquidity Patterns (Trendline, Channel, Triangle)
We see a clean sweep of all classic retail patterns – trendlines, ascending/descending channels, and triangle breakouts. These acted as liquidity traps and were perfectly manipulated, representing Phase 1 and 2 inducements, similar to concepts in ICT and Vector strategies.
📈 3. Bullish Move From 1H LQ Close to Black Trendline
From the 1H LQ Close zone, we had a bullish impulse that pushed price toward the black trendline. However, this move failed to sustain due to a sharp drop caused by news, indicating it might have been a fakeout or part of an incomplete internal structure.
⚠️ 4. Suicide Level Below = Potential for Short-Term Reaction
There’s a key “suicide level” at the bottom of the chart – a high-probability zone for a quick bullish reaction. If price shows impulsive behavior or liquidity sweeps on lower timeframes, this level could push price back up to the 1H LQ Close zone.
🔁 5. If Suicide Level Fails → Watch for 4H LQ Close Zone to Act as Reversal Point
If the suicide level doesn't hold, we shift focus to the 4H LQ Close zone, which could act as a major reversal area. Look for bullish confirmations like order blocks, strong engulfing candles, or liquidity voids forming around that area.
🎯 Final Note:
This chart is a perfect example of how LQ Close zones across multiple timeframes, paired with classic liquidity traps and smart price action confirmation, can guide high-quality setups in the Phantom Pips style.
Right now, we’re waiting for a clear reaction from either:
The 40% ATI candle zone above → Sell opportunity
The 4H LQ Close zone below → Potential buy setup

Are people sure they want to give up on ETH?Are people sure they want to give up on ETH? The weekly RSI looks like it may have found a major bottom. I wouldn't ignore it. No financial advice.
