NZD/USD at Risk of Retesting Yearly LowsThe Kiwi is clinging to uptrend support within a broader rising wedge, with selling pressure reemerging at .5680 despite Monday’s late recovery.
A clean break below the uptrend could see bears target .5650, the low from Monday. A move through that level would put .5600 in focus as the next downside target.
Momentum signals reinforce the bearish case—RSI (14) and MACD continue to trend lower into negative territory, favouring selling rallies and downside breaks.
If the price were to fail beneath the uptrend again and reverse back above .5680, the bearish bias would be invalidated for now.
Good luck!
DS
M-oscillator

Trading with the CoffeeKiller Suite: A Friend-to-Friend GuideHey there! So you've got the CoffeeKiller indicator suite loaded up on your charts, and you're wondering how to use them together as a cohesive trading system. Let me walk you through how I'd approach this setup with the Rev&Line with TrendMarker on your main price chart and the RSI+MFI Momentum Mapper and MACD Boundary as your oscillators below.
The Big Picture: How These Work Together
Think of this setup as a three-layer confirmation system:
1. Rev&Line with TrendMarker gives you the big picture trend and potential reversal points on price
2. RSI+MFI Momentum Mapper shows you the underlying momentum strength
3. MACD Boundary confirms cycle timing and helps with entry precision
What makes this system powerful is how they complement each other. When all three align, you've got a high-probability trade setup.
Reading Your Main Chart: Rev&Line with TrendMarker
This is your primary trend identifier. The key features to watch are:
- Background color: Green means bullish (both SuperTrend and PSAR agree), red means bearish. This is your first clue about trend direction.
- ZigZag lines: These connect significant pivot points, helping you visualize the trend structure.
- Marker lines: These track the price range of the current swing. The high (magenta) and low (cyan) marker lines create a channel that price tends to respect.
- Triangle signals: When you see a down triangle at a pivot high or an up triangle at a pivot low, pay attention! These often mark potential reversal points.
The beauty of the Rev&Line indicator is that it combines multiple technical concepts (ZigZag, SuperTrend, PSAR, and Donchian Channels) into one visual guide.
Checking Momentum: RSI+MFI Momentum Mapper
This oscillator is your momentum gauge, combining RSI and MFI for a more reliable signal:
- Zero line: Above zero means bullish momentum, below means bearish.
- Colored columns: Watch how these behave - the color changes tell you about momentum shifts.
- Marker lines: Just like on the main chart, these track the range of the current momentum swing.
- Peak markers: The yellow triangles mark significant momentum peaks and troughs.
When the marker lines are making higher highs in bullish territory or lower lows in bearish territory, the momentum is strong. When they start to flatten out, momentum is weakening.
Timing Entries: MACD Boundary
The MACD Boundary adds precision to your entries and confirms the other indicators:
- Histogram columns: The dynamic coloring tells you about strength and direction.
- Marker lines: These track the historical range of the current MACD cycle.
- Peak markers: Just like the RSI+MFI indicator, these show you momentum turning points.
One huge advantage of this MACD implementation is the timeframe flexibility - you can view a shorter timeframe chart but calculate the MACD on a higher timeframe for better trend alignment.
Putting It All Together: Trade Setups
Bullish Setup:
1. Main chart: Background turns green, ZigZag starts moving up, and we get an up triangle
2. RSI+MFI: Crosses above zero, columns turn green, and the high marker line starts making higher highs
3. MACD: Histogram turns green and crosses above zero
Bearish Setup:
1. Main chart: Background turns red, ZigZag starts moving down, and we get a down triangle
2. RSI+MFI: Crosses below zero, columns turn red, and the low marker line starts making lower lows
3. MACD: Histogram turns red and crosses below zero
Fine-Tuning Entries
For entry timing, I'd pay special attention to:
- When price tests the lower (cyan) marker line in an uptrend
- When the RSI+MFI indicator shows a yellow up triangle at a trough
- When the MACD histogram starts to turn back toward zero after making a notable low
Managing Risk
Use the marker lines on the main chart for stop placement - they create natural areas of support and resistance. In an uptrend, I'd place my stop just below the lower marker line. In a downtrend, I'd place it just above the upper marker line.
Pro Tips from Personal Experience
1. Watch for divergences: If the main chart is making higher highs but the oscillators are making lower highs, be cautious of a potential reversal.
2. Pay attention to confluences: When marker lines from different timeframes align at a similar price level, that's often a powerful support/resistance zone.
3. Don't fight the background color: One of the easiest mistakes is trying to short when the background is green or go long when it's red. Be patient and wait for full alignment.
4. Focus on peak markers: Those little yellow triangles on the oscillators often precede major moves, especially when they show up after a deep momentum thrust.
5. Use the percentage values: On the main chart, the percentage indicators show where price is within the current range - great for gauging how much "room" is left in the current swing.
Remember, no system is perfect, but this suite gives you a comprehensive view of market structure, momentum, and timing. When all three indicators align, that's when the highest probability setups occur.
Disclaimer
This trading system explanation is provided for educational and informational purposes only. Trading financial markets involves substantial risk of loss and is not suitable for all investors. The analysis, indicators, and strategies discussed do not constitute financial advice, investment recommendations, or signals to trade. Past performance of any trading system or methodology is not necessarily indicative of future results. Before implementing any trading strategy, consult with a licensed financial advisor who can provide personalized advice based on your specific financial situation, risk tolerance, and investment goals. Remember that no trading system can guarantee profits, and you should never invest money that you cannot afford to lose.

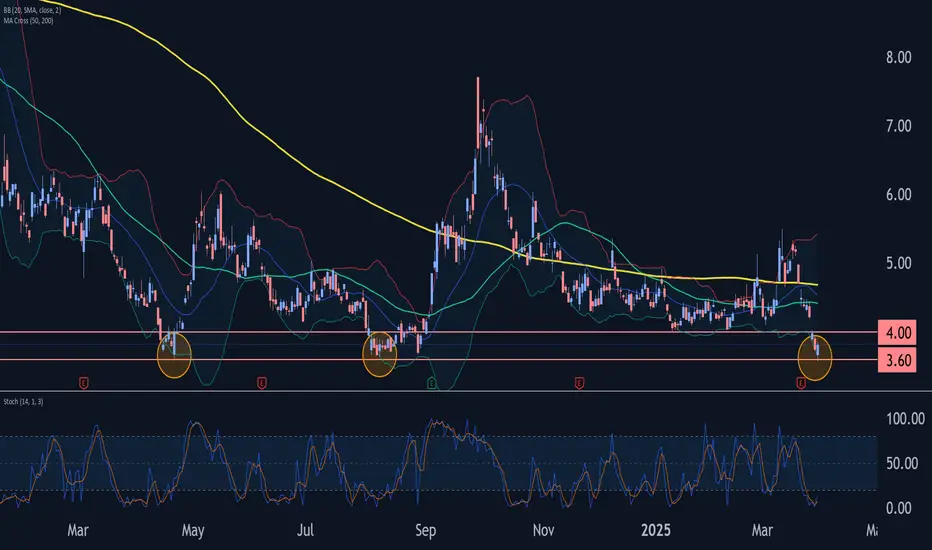
NIO Wave Analysis – 31 March 2025
- NIO reversed from support zone
- Likely to rise to resistance level 4.00
NIO recently reversed from the support area located between the multi-month support level 3.60 (which has been reversing the price from April of 2024) and the lower daily Bollinger Band.
The upward reversal from this support zone stopped the C-wave of the earlier intermediate impulse wave (B).
Given the strength of the support level 3.60 and the oversold daily Stochastic, NIO can be expected to rise to the next round resistance level 4.00 (former strong support from January).
XRP Weakens as Risk-Off Sentiment GrowsFundamentals:
XRP is under pressure as broader market sentiment turns negative. The cryptocurrency market continues to follow the Nasdaq, which is showing signs of weakness. With the index currently struggling, risk assets—including XRP—are seeing downside pressure. A stronger U.S. dollar is adding to the bearish outlook, weighing on both crypto and equities. Recent regulatory clarity on XRP failed to spark sustained gains, suggesting the news was already priced in.
Technicals:
Technical levels show that XRP is currently testing a key monthly support zone. If this level fails to hold, the next downside target could be around 1.5700. Bearish momentum is increasing, with sellers defending resistance zones aggressively. Volume patterns suggest that buyers are hesitant, leaving the market vulnerable to further declines. The RSI indicator is heading lower from previously overbought levels, indicating a potentially falling trend for now, reflecting growing bearish momentum. A break below the monthly support could accelerate selling pressure.
Traders should watch for confirmation with increased volume on a breakdown. If support holds, a short-term bounce could be possible, but broader sentiment remains weak. Macro factors such as interest rates and economic data will influence risk appetite. Bitcoin’s price action will also play a role in determining XRP’s next move. A reclaim of key resistance levels could shift sentiment, but for now, bears are in control. Traders should manage risk carefully, considering potential volatility. A retest of lower support zones could provide better long opportunities.
For now, caution is warranted as XRP remains under downside pressure.

Bitcoin back test 81kBitcoin is back-testing the trend line which is started almost 40 days ago, and in 4 hour time frame looks like we have got a bullish divergence on RSI from the previous low.

OMNOM. What's next?Sellers' strength is running out and the price tests the moving average twice in 105 days of downtrend. The asset is completely oversold, as is probably the case with many things on the market now.

ACH/USDT - Potential Bounce Incoming 30%+ Gains PossibleI'm analyzing the ACH/USDT 4-hour chart and spotting signs of a potential rebound. Here’s what I’m seeing:
✅ Support Zone: Price is testing a key support level around $0.02119, which has held strong in the past. The market appears to be accumulating in this area.
✅ EMA Crossovers: The chart shows a bearish crossover between the 12 EMA and 20 EMA, but watch for a bullish reversal as price approaches this support. Potential for a rebound if the EMAs cross back to the upside.
✅ Volume Delta Analysis: There's a notable increase in volume with a Delta Volume of 28.42%, indicating heightened interest at these levels.
✅ Reversal Probability: The chart shows an impressive 85.6% reversal probability, suggesting a strong chance of a bullish move soon.
✅ Targets: Looking for a potential 30%+ bounce towards key resistance levels at $0.02559, $0.02657, and $0.02845.
📉 Risk Management: Setting a stop loss slightly below the $0.02119 support level to minimize risk in case of further downside.
📈 If support holds and momentum shifts, a strong move upward could follow. Stay vigilant!
🚨 Not financial advice. Always do your own research.

Free Report #2:The SImple Guide To Trading Stock OptionsThis is the 3 Step Strategy
Am going to show you in this video
to help you with trading stock options.
Watch it to learn more.
#1-Wait for Momentum/Rate Of Change/ Bull Power indicator
#2-Wait for a candlestick chart pattern confirmation
#3-Use the Rocket Booster Strategy
If you want to learn more check out the resources and rocket boost this content
Disclaimer: Trading is risky please learn
risk management and profit taking strategies.
Also feel free to use a simulation trading account.

AMD - Perfect timing to grasp great potential ahead!AMD (Advanced Micro Devices) has shown strong potential for growth, and the recent trend analysis using the MACD (Moving Average Convergence Divergence) indicator suggests that the stock remains in a favorable position for continued upside momentum.
Technical Analysis:
The MACD is a powerful trend-following momentum indicator that helps traders identify potential buy and sell signals based on moving averages. For AMD, the MACD indicator is currently showing a bullish crossover, where the MACD line has crossed above the signal line. This suggests that the stock’s momentum is shifting positively, indicating an increasing rate of price change to the upside.
Key MACD Signals for AMD:
Bullish Crossover: The MACD line (typically the difference between the 12-day and 26-day exponential moving averages) has recently crossed above the signal line (a 9-day EMA of the MACD). This is a classic bullish signal, which often precedes further price appreciation.
Strong Momentum: The distance between the MACD line and the signal line is widening, signaling strong momentum in the upward direction. This suggests that buying interest in AMD is gaining strength, and the stock could continue to rise as long as the momentum remains intact.
Positive Histogram: The MACD histogram is currently above the zero line, reflecting that the difference between the MACD and its signal line is positive. This further validates the strength of the bullish momentum, indicating that the stock could continue to experience upward pressure.
AMD’s Fundamental Strength:
Beyond technical indicators like MACD, AMD's fundamentals also support the favorable technical outlook. The company continues to make significant strides in the semiconductor industry with its innovative product lineup, including the Ryzen processors and Radeon graphics cards. AMD has been gaining market share from competitors like Intel and Nvidia, further strengthening its long-term growth prospects.
Our conclusion for this stock.
With a favorable MACD indicator, coupled with the robust fundamentals of AMD, the stock is well-positioned for potential gains. The bullish momentum indicated by the MACD suggests that AMD could experience continued price appreciation, making it an attractive option for investors who are looking for stocks with solid upward potential.
Trade set-up
Entry: 105
Target: 135 - Our target is set up below the weak resistance which used to serve as a support line when the stock was trading at ATH levels.When we reach that key-level we would analyse the stock again to see if it has more favourable data to boost the price towards the strong resistance level of 170+ below the ATH area
Stop Loss: 70 which is an unsustained bottom, utilizing it for protection over the trade

EUR/AUD: Wedge Break in SightTraders should be alert to the risk of a resumption of the bullish trend in EUR/AUD.
It’s been coiling within a falling wedge for much of March, with the price rebound over the past two sessions leaving the pair testing downtrend resistance.
A bullish wedge break would put 1.7272 on the radar. If that were to give way it would open the door for a run towards the March 11 high of 1.7420. A stop beneath the downtrend would offer protection against reversal.
RSI (14) has broken its downtrend, suggesting bullish momentum may be starting to build again even though MACD has yet to confirm the signal.
Good luck!
DS

Silver Bulls in Control as $34.87 Retest Comes Into ViewThe bullish move in silver we anticipated has played out nicely following the break of wedge resistance earlier this week, with the price squeezing above $34.24 on Thursday. Bulls will now be eyeing a retest of the October 24 swing high of $34.87.
Momentum indicators such as RSI (14) and MACD are trending higher, reinforcing the bullish setup and favouring buying dips and bullish breaks.
A retrace back toward $34.24 would create a setup where longs could be established above the level with a stop beneath for protection. While resistance may emerge around $34.50, $34.87 screens as a more appropriate target for those seeking greater risk-reward. A break above that would leave silver trading at multi-decade highs.
If silver were to reverse and close beneath $34.24, the bullish bias would be invalidated.
Good luck!
DS

3M Wave Analysis – 27 March 2025
- 3M reversed from resistance area
- Likely to fall to support level 147.00
3M recently reversed down from the resistance area between the key resistance level 154.00 (which has been reversing the price from the end of January) and the upper daily Bollinger Band.
The downward reversal from this resistance area created the two consecutive Japanese candlesticks reversal patterns Doji – which highlights the strength of this resistance level.
Given the strength of the resistance level 154.00 and the overbought daily Stochastic, 3M can be expected to fall to the next support level 147.00 (low of the previous correction 2).

10-Year Treasury Yield Nudges HigherThe 10-Year Treasury yield has been rangebound for about 1-1/2 years, but some traders may see upside risk.
The first pattern on today’s chart is the series of lower highs since October 2023. TNX violated the trendline in December and may be holding above it now. That could suggest a period of downward movement has ended.
Second is the December low of 4.13. Yields tested and held that level in early March. They made a higher low in subsequent weeks -- even after the Federal Reserve reduced quantitative tightening (QT). MACD is also rising.
Third, TNX ended yesterday at its highest level in more than a month. It’s also challenging a gap from February 25 caused by weak consumer confidence.
Finally, Wednesday’s close was above the peak from June 2008, when the global financial crisis was taking hold. Staying here may confirm a long period of generationally low borrowing costs has come to an end.
TradeStation has, for decades, advanced the trading industry, providing access to stocks, options and futures. If you're born to trade, we could be for you. See our Overview for more.
Past performance, whether actual or indicated by historical tests of strategies, is no guarantee of future performance or success. There is a possibility that you may sustain a loss equal to or greater than your entire investment regardless of which asset class you trade (equities, options or futures); therefore, you should not invest or risk money that you cannot afford to lose. Online trading is not suitable for all investors. View the document titled Characteristics and Risks of Standardized Options at www.TradeStation.com . Before trading any asset class, customers must read the relevant risk disclosure statements on www.TradeStation.com . System access and trade placement and execution may be delayed or fail due to market volatility and volume, quote delays, system and software errors, Internet traffic, outages and other factors.
Securities and futures trading is offered to self-directed customers by TradeStation Securities, Inc., a broker-dealer registered with the Securities and Exchange Commission and a futures commission merchant licensed with the Commodity Futures Trading Commission). TradeStation Securities is a member of the Financial Industry Regulatory Authority, the National Futures Association, and a number of exchanges.
TradeStation Securities, Inc. and TradeStation Technologies, Inc. are each wholly owned subsidiaries of TradeStation Group, Inc., both operating, and providing products and services, under the TradeStation brand and trademark. When applying for, or purchasing, accounts, subscriptions, products and services, it is important that you know which company you will be dealing with. Visit www.TradeStation.com for further important information explaining what this means.

$SPY March 27, 2025AMEX:SPY March 27, 2025
15 Minutes.
AMEX:SPY struggling to move upwards as expected.
For the rise 561.48 to 576.42 it has retraced 61.8 levels to 567 levels.
Not it is taking support at 200 averages in 15 minutes
For the fall 576.33 to 567.92 570-571 is a good level to short for an initial target 565- 566 levels for the day.
Since below 200 in 5 minutes not a time to g long for the yet.

The 3 Steps System Called "The Rocket Booster Strategy"Yesterday I took a long walk and i thought about you.
Because I want to help you learn how to trade.
Look at this chart in order to find this chart I used the rocket booster strategy.
What is the rocket booster strategy?
Yesterday I took a long walk and i thought about you.
Because I want to help you learn how to trade.
Look at this chart in order to find this chart I used the rocket booster strategy.
What is the rocket booster strategy?
It has 3 Steps:
#1-Price has to be above the 50 EMA
#2-Price has to be above the 200 EMA
#3-Price has to Gap up
These shows you a strong uptrend on the week and on the day ratings.
Also considering the oscillator
Should give you a sell signal on your *New* TradingView screener.
But this has to be on a daily chart.
But one last step.
The MACD signal line (blue) Should be below the MACD level line (orange).
This gives you a red bar below the zero line.
If you don't understand this don't worry I will make video for you next time.
For now understanding the technical terms
Including the Rocket Booster Strategy is the key.
Learn more rocket boost this content
Disclaimer ⚠️ Trading is risky please learn Risk Management And Profit Taking Strategies. Also feel free to use a simulation trading account before you use real money.

Russell 2000 Futures: Bearish Reversal in Play?Russell 2000 futures may resume the bearish trend established earlier this year, trading below wedge support following the completion of an evening star reversal pattern on Wednesday.
Shorts could be established on the break with a stop above the former uptrend for protection. Support may be encountered around 2050, although 1994.8 looms as a more appropriate target for those seeking greater risk-reward.
RSI (14) has rolled over, while MACD remains negative despite grinding higher over the past fortnight, painting a picture of waning momentum that complements the bearish price signals.
If RTY were to reclaim the former uptrend, the bearish setup would be invalidated.
Good luck!
DS

ANKRUSDT: A Strong Demand Zone or Breakdown Risk?ANKRUSDT is currently sitting at a crucial demand zone, a level that has historically triggered massive price movements. This same area in February 2021 acted as a springboard for huge gains, leading to a double top formation at $0.21 before experiencing a major downtrend. Since August 2022, the price has been stuck in a sideways range, with no clear breakout in sight—until now.
Why This Demand Zone is Key
The weekly support level within the range has proven to be resilient, holding strong since 2021. Additionally, the Stochastic RSI is in oversold territory, signaling a potential loss of selling pressure. This setup suggests that buyers might step in soon, making this zone a prime accumulation area for long-term holders.
Best Buy Zone:
🔹 $0.015 - $0.022 → A historically strong support level, ideal for long-term positions.
Potential Targets:
📌 Short-Term Target: $0.057 - $0.066 (Top of the current range)
📌 Mid-Term Target: $0.097 (Potential supply zone)
📌 Long-Term Target: $0.21 (Previous all-time high)
Bearish Scenario: What If Support Breaks?
While the demand zone is strong, there's always a chance of a breakdown. If price fails to hold support, the next major demand zone lies at $0.008—a crucial level for long-term investors to watch.
Final Thoughts
✅ The setup is strong, with price at weekly support and indicators signaling a potential reversal.
⚠️ But always have a plan—if the demand zone breaks, be ready for lower levels.
💡 Risk management is key—stick to your strategy, and trade with confidence!
What’s your take on ANKR? Are you bullish or waiting for more confirmation? Let’s discuss in the comments! 🚀
Keep it shiny~!
KinaStar

GBPUSD Wave Analysis – 26 March 2025
- GBPUSD reversed from resistance area
- Likely to fall to support level 1.2800
GBPUSD recently reversed down from the resistance area between the resistance level 1.3035 (which has been reversing the price from October), resistance trendline of the daily up channel from January and the upper daily Bollinger Band.
The downward reversal from this resistance area created the daily Japanese candlesticks reversal pattern Evening Star which started the active wave 3.
GBPUSD can be expected to fall to the next support level 1.2800, the former monthly high from December.

Why I Think EURUSD Will Continue to Sell...Technical AnalysisHey Rich Friends,
I think EURUSD will continue to sell today and maybe this week. This is only my technical analysis, so please check the news and cross-reference the indicators you have on your chart. Here is what I am looking at:
- The market has rejected the most recent highs around 1.08610
- Bearish candles have picked up momentum in the last few hours
- Structure was broken on H1 and support was retested as resistance
- The STOCHASTIC is facing down, the orange line (slow) is on top of the blue line (fast), both have crossed below 50% and 80%
These are all bearish confirmations for me. I will set my SL at a previous high and use previous lows as my TPs. Good luck if you decide to take this trade. Let me know how it goes in the comments below.
Peace and Profits,
Cha

NVDA breaking supportSince June of last year NASDAQ:NVDA has been developing a $113 support level. Today we saw a retest of this level with strong momentum in accordance with a weakening market. I believe the Stock will break this level and continue down to its next significant support level at $96. Technically, the stock is bouncing off of a return to its 21 EMA below the 50 EMA which would have been the optimal entry point on this trade. Today also had a cross below the 14-day SMA in RSI. Finally, looking at the technical indicators provided by Trading View the stock is showing sell or neutral signals across all indicators except for 1.

GBPCAD Wave Analysis – 26 March 2025
- GBPCAD reversed from resistance zone
- Likely to fall to support level 1.8230
GBPCAD recently reversed down from the resistance zone between the resistance level 1.8625 resistance trendline of the weekly up channel from 2023 and the upper weekly Bollinger Band.
The downward reversal from this resistance zone created the weekly Shooting Star candlesticks reversal pattern – which started the active wave iv.
Given the strongly bearish sterling sentiment and the overbought weekly Stochastic, GBPCAD can be expected to fall to the next support level 1.8230.

US30: Sell below $42,360FX:US30 is currently retesting previously broken is currently retesting previously broken support on daily tf.
With price showing bearish divergence, break of support ($42,360) could start a bearish rally on smaller timeframes!

Free Report #1:How To Build A Solid WatchlistFinding this chart pattern took about two days.
First i had to create a screener to find the momentum
then today i looked at the watch list.
While looking at the watchlist i tried to screen
for a candle stick pattern,
This candlestick pattern is called the lower long shadow.
It is part of another chart pattern called the frying pan
bottom.
This means the chart price has hit higher new low
as you can see from the drawing on the chart
that looks like a triangle
ALso remember that on this chart is
a technial analysis system called
the rocket booster strategy.
Check out the references to learn about this
strategy.
Also take note of one the best osicllators
in technical analysis called the MACD
look close you will see two lines Crossing
This is rare sight to behold
and this is why i have to document this
and share it with you as well
Trade safe.
Rocket boost this content to learn more
Disclaimer: Trading is risky please learn risk management
and profit taking strategies.Also feel free
to use a simulation trading account before you
trade with real money
