Meta Platforms Finishing Local Trend. METAElliott Wave impulse is possibly finished, yet relying on Elliott counts alone comes with unfathomable risk, I looked for a constellation of additional pieces to qualify a short position on the 12H chart.
That is fairly strong bearish price action with lower lows, and indicators are generally bearish or downgoing in the least. More relevantly, RSX left OBOS territory, MIDAS curve has been crossed, and VZO/Ehler's StochRSI have crossed almost in tandem.
Ultimate goal is bottom of A, which an elliotician will recognize to be frequently 0.382 retracement, which interestingly forms a Fib cluster with the supposed fifth wave at 0.786 minor retracement.
M-oscillator

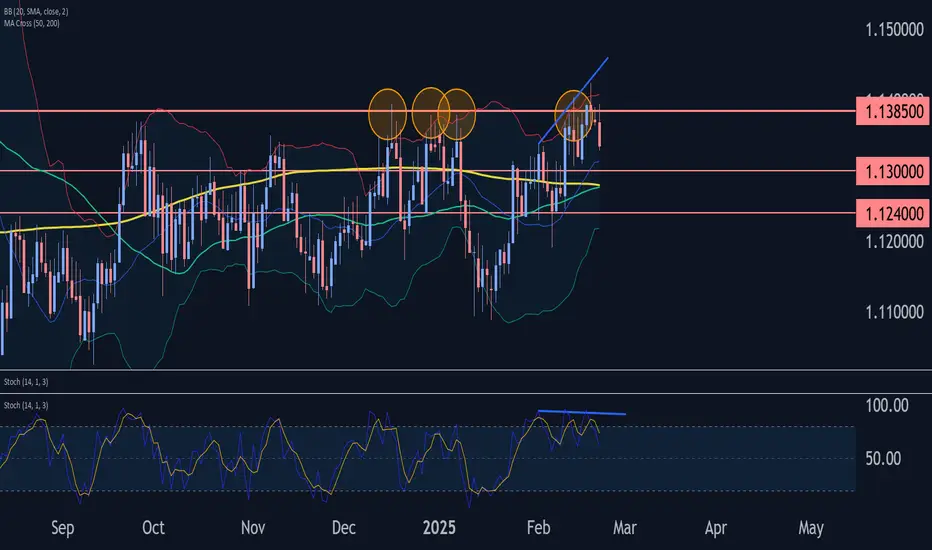
GBPCHF Wave Analysis – 21 February 2025
- GBPCHF reversed from resistance zone
- Likely to fall to support level 1.1300
GBPCHF currency pair recently reversed down from the resistance zone between the multi-month resistance level 1.1385 (which has been reversing the price from July) and the upper daily Bollinger Band.
The downward reversal from this resistance zone stopped impulse wave 5 of the intermediate upward impulse sequence (C) from January.
Given the strength of the resistance level 1.1385 and the triple bearish divergence on the daily Stochastic, GBPCHF currency pair can be expected to fall to the next support level 1.1300 (low of the previous minor correction 4).
$175,000 Bitcoin by SummerLooking at the parabola pattern for Bitcoin, it has played out perfectly this cycle. I'm expecting one final push on BTC's price before a plateau. Since the average price appreciation after RSI trend line breakouts are ~70%, I think anywhere between a $175,000 - $180,000 Bitcoin can happen relatively soon!

Bitcoin - preparing for a Mega bullish waveThe weekly chart is bullish for Bitcoin.
It shows a hidden bullish divergence on RSI, indicating that the price trend is likely to continue upward.
Additionally, the chart highlights a double bottom pattern on HTF.
Bitcoin maintaining support at 0.786 Fibonacci will give it the momentum needed to create a new high.
A new all-time high (ATH) for Bitcoin is expected in the coming weeks.
Best regards Ceciliones🎯

CYCLE 4 | Price %Change Extension from 20W SMABTC PRICE %Δ EXTENSION FROM 20W SMA ANALYSIS
Similar to previous Analysis looking at 'Price %Change Extensions' from moving averages (see links below), we take a look at the respective relationship BTC has held with the 20W SMA over its existence.
HISTORICAL BEHAVIOUR
Observable in Prior cycles BTC has topped and bottom out at High Points and Low Point of this relationship. We can see over cycle periods the highs are sloping downward (indicating ATH of future cycles diminishing in nature is historically in line with this relationship). This is observable via the downward sloping green zone connecting cycle peaks in the BTC Price %Δ Extension from 20W SMA.
For cycle bottoms (excluding the bloodbath of cycle 0), generally we see these occur ~around the 80% Price %Δ Extension region (see the red box below).
CYCLE 3 VARIATIONS | THIS TIME WAS DIFFERENT
It is notable that Cycle 3 was the first cycle where the high and low in this relationship occurred before the price All Time Low and High of Cycle 3, and in this instance the indicator displayed more divergent behavior (suggesting price momentum is reversing) with spikes of a lower high and higher low of this relationship indicating cycle 3 ATH and ATL.
CYCLE 4 ATH TAKEAWAYS
* A revisit of the Green Zone has historically coincided with a significant top or cycle ATH with prior price cycles.
* If Cycle 3 behavior is the new norm, then a revisit of the green area may indicate price momentum reversal. This divergent behavior indicated BTC was setting the final ATH for cycle 3.
* Either scenarios may play out again in Cycle 4 and may be a usual relationship to use with confluence of other relationships to identify Price / Market timing to take final profits.
See Relevant Previous Posts Below

ETHUSD and Crypto Signaling Risk On?So typically for equities I use the one hour, but when it comes to crypto being that a trading day is 4x a typical day for equities, I use the 4 hour. The one thing about my momentum indicator, is that forward testing has indicated that the longer a trade survives, the more likely it is to win! This one looks like we have a double bottom in the works as it approaches the neckline. If it can breakout, instead of testing that take profit, we are likely to smash thru it. I guess patience pays...
The signal was created by the King Trading Momentum Strategy combines the 5 EMA crossing above the 13 EMA, RSI strength, favorable momentum as measured by ADX plus evaluating recent volume changes and even something that measures breakout momentum called Beta for some equities! ETHUSD and over 100 equities are built into this script, as well as, BTCUSD and SOLUSD with optimal backtest take profits and stop losses and can be toggled on by simply checking a box (default they are turned off). I always enable Using Bar Magnifier and On Bar Close in Properties.

MSFT with Room to Run to UpsideI guess what I love about this one is the fact that right now MSFT isn't exactly getting all that much love, and this sleeper has room to run if it can get above it's 200 day SMA! This one has been open for a couple days and if we can get a VIX crush Friday tomorrow it may just be getting started!
The signal was created by the King Trading Momentum Strategy combines the 5 EMA crossing above the 13 EMA, RSI strength, favorable momentum as measured by ADX plus evaluating recent volume changes and even something that measures breakout momentum called Beta for some equities! MSFT and over 100 equities are built into this script with optimal backtest take profits and stop losses and can be toggled on by simply checking a box (default they are turned off). I always enable Using Bar Magnifier and On Bar Close in Properties.

Sellers in Control as 50DMA Rejection Reinforces Bearish BiasAustralian ASX 200 SPI futures were firmly rejected at the 50-day moving average earlier Friday, reinforcing the message that sellers remain in control following the bearish break of uptrend support flagged earlier this week.
With RSI (14) and MACD both firmly bearish, the near-term bias remains to sell rallies and downside breaks.
If the price squeezes back toward the 50DMA, it could present a short setup, allowing for positions to be established beneath the level with a stop above for protection. Ideally, another test and failure at the 50DMA would bolster the merits of the trade. Potential targets include 8251, 8135, or the key 200DMA.
Alternatively, a clean downside break of 8251 could open the door for shorts beneath that level, again with a stop above. Targets would be the same as the latter two mentioned above.
Beyond technicals, there’s been little discussion about how the sharp rally in Chinese equities is impacting markets outside of China. For years, investors wary of direct exposure to China gained access indirectly through other Asian markets, including the ASX. With China now looking far more investable, this shift—beyond earnings season—may help explain the abrupt weakness in Australian equities.
Good luck!
DS

Whose Brain Do You Trust? $BTRSTUSDDo you trust your brain? Do you trust my brain??
Don't trust just any brain, Put Your Trust in Brain Trust. ™
I have no idea what this is, but look at those oscillators!
Think of those old Smuckers commercials, and then read this:
With a name like Brain Trust, it has to be smart.
(yeah it better be)
CRYPTO:BTRSTUSD
And now, from a brain you cannot trust, here's what ChatGPT has to say:
Braintrust (BTRST) is a decentralized talent network that connects skilled freelancers with prominent global companies. Unlike traditional platforms, Braintrust is community-owned, allowing talent to retain 100% of their earnings while enabling organizations to assemble flexible, skilled teams on-demand at a fraction of the usual cost.
BRAINTRUST
Key Features:
Decentralized Governance: BTRST token holders participate in decision-making processes, influencing the network's development and policies.
BRAINTRUST
Incentive Structure: Members earn BTRST tokens by contributing to the network, such as referring new talent or clients, and vetting freelancers.
BRAINTRUST
Tokenomics:
Total Supply: 250 million BTRST tokens.
Distribution:
54% allocated for community incentives and rewards.
22% for early token purchasers.
19% for early contributors.
5% sold in the CoinList Sale.
BITDEGREE
Current Market Data:
Price: Approximately $0.3440 per BTRST.
Market Capitalization: Around $83 million.
Circulating Supply: 241,347,782 BTRST tokens.
BITDEGREE
Since its all-time high of $47.85 on September 16, 2021, BTRST has experienced a significant price decline, currently trading 99.28% below that peak.
BITDEGREE
Braintrust's innovative model has attracted over 50,000 community members, including both freelancers and enterprises, fostering a dynamic ecosystem that benefits all participants.
Hey pretty cool
Sounds like a lot of brains
So what are you saying Hollywood? Is this a buy or what?
Well, this certainly isn't financial advice, because that's not allowed, and I don't break the rules. I'm a good decent law abiding citizen. I just think those oscillators are dang Purdy. You gotta use your brains, make your own decision, but if you don't trust your brains, there's a brain you can trust with Brain Trust.
I'm gonna go take a nap now.

RITM Mean Reversion Band TradeCurrently developing and testing a mean reversion strategy for range-bound markets. Still work in progress, but using a simple setup of defined price band, low ADR value, RSI overbought/oversold and MACD indicating chance of reversal. Stop is 2x ATR.

Downgoing TJX. TJXEarly in the correction to a fairly large bullish impulse. Technically, we are all bearish across the board, plus divergences on some indicators on the latest set of peaks.

Walt Disney Throwing off a Bullish Constellation. DISABC zigzag complete, then one bounce, and now:\
1.vWAP crossed by 2. engulfing bullish candle
3. signals on VZO/StochRSI
4. cross of MIDAS line
5. Cross of Bolinger Band %PCT
We like to use combinations or pairs of different indicator, as it improves chances. Similarly, every indicator we use looks at every market from completely different perspectives, be it volume, volatility, statistical deviation, price action, stochastics.

Plus on Thermo Fischer. TMOThe last take on TMO brought 7.5% profit in 13 days. It was manly based on Harmonic/RSX OBOS combo signature. The change in the candle stick tendency now might be an earliest of the earliest signs of a pivot. This is a very risky take, given limited evidence: Stoch/RSI cross, vWAP cross, US support and bullish encompassing candle, thus the stop is very tight.

Bounce Off Floor for Pepsico. PEPThis is a second bounce post completion of a fairly obvious downward five wave impulse. Usually, when this happens more than twice, price action turns around and goes the other way. Despite lagging, the VZO/StochRSI combo both produced signals. vWAP and Ehlers Ultimate Smoother are both supportive.

Bounce Off the Bottom for Merck. MRKWe believe a downward impulse (Elliott) is finished and this is somewhat evident by the two candlestick price action. A change in the tone and flavor of candle sticks in momental OBOS area, overstretched VZO/StochRSI combo can be suggestive of a pivot and we believe this to be happening here. If the outlook is wrong then the obvious and tight stop will prevent large losses. Interstingly Ehlers StochRSI already produced a signal and momentum RSX "tipped."


Lam Research Pushes HigherLam Research has consolidated after dropping in July, but now traders may think the chip-equipment stock is coming back to life.
The first pattern on today’s chart is the weekly close of $84.74 from August 23. LRCX tried to break that level in September and October without success. But the stock closed above it yesterday as the broader Nasdaq-100 climbed. Is it finally breaking out?
Interestingly, the 200-day simple moving average is in the same approximate location. The stock additionally closed above it for the first time since last summer.
Next is the rounded basing pattern around an earlier peak from July 2023. That may suggest old resistance has become new support.
Finally, MACD is rising. The 8-day exponential moving average (EMA) is also above the 21-day EMA. Those patterns could indicate a bullish short-term trend.
TradeStation has, for decades, advanced the trading industry, providing access to stocks, options and futures. If you're born to trade, we could be for you. See our Overview for more.
Past performance, whether actual or indicated by historical tests of strategies, is no guarantee of future performance or success. There is a possibility that you may sustain a loss equal to or greater than your entire investment regardless of which asset class you trade (equities, options or futures); therefore, you should not invest or risk money that you cannot afford to lose. Online trading is not suitable for all investors. View the document titled Characteristics and Risks of Standardized Options at www.TradeStation.com . Before trading any asset class, customers must read the relevant risk disclosure statements on www.TradeStation.com . System access and trade placement and execution may be delayed or fail due to market volatility and volume, quote delays, system and software errors, Internet traffic, outages and other factors.
Securities and futures trading is offered to self-directed customers by TradeStation Securities, Inc., a broker-dealer registered with the Securities and Exchange Commission and a futures commission merchant licensed with the Commodity Futures Trading Commission). TradeStation Securities is a member of the Financial Industry Regulatory Authority, the National Futures Association, and a number of exchanges.
TradeStation Securities, Inc. and TradeStation Technologies, Inc. are each wholly owned subsidiaries of TradeStation Group, Inc., both operating, and providing products and services, under the TradeStation brand and trademark. When applying for, or purchasing, accounts, subscriptions, products and services, it is important that you know which company you will be dealing with. Visit www.TradeStation.com for further important information explaining what this means.

Use RSI Like a GoldmanYou might be wondering, do the traders at Goldman Sachs use the Relative Strength Index (RSI)? The answer is, perhaps they do, and perhaps they don’t. However, based on my experience, I can confidently say that even the most seasoned and professional traders rely on RSI from time to time.
While it may not be their sole tool for decision-making, it’s often included in their broader strategy due to its effectiveness in identifying overbought or oversold conditions in the market. RSI is one of many technical indicators that can serve as a helpful signal in navigating market trends, and even the best traders find it useful on occasion.
When trading with technical indicators like the Relative Strength Index (RSI), having a clear and structured approach is crucial to maximizing its effectiveness. While RSI can be a powerful tool for identifying potential trend reversals, it’s essential to understand the right conditions and context in which to use it.
Below are some key principles and guidelines that can help you apply RSI more effectively in your trading strategy. Whether you’re a swing trader or a day trader, these tips can help you avoid common pitfalls and make more informed decisions in the market.
⚙️ Keep Settings Simple
Keep the RSI settings minimal to avoid confusion. Stick to the standard 14-period lookback, which is widely used and reliable for most market conditions.
📉📈 Ensure Divergence Occurs Outside of Key Levels
Divergence should only be considered when the RSI reaches extreme levels, typically above 70 (overbought) or below 30 (oversold). This helps to identify potential trend reversals. Divergence at neutral levels (like between 40–60) may not be as effective.
🔥 Base Divergence on Candle Closes, Not Wicks
Always look for divergence based on the closing price of candles. Divergence created by wick movements is unreliable and can lead to false signals. Stick to the body of the candle to ensure accuracy.
⏳ Watch the Lookback Period
The RSI’s default lookback period is 14, and divergence with a gap of more than 14 candles is generally less reliable. Wider gaps often signal weak price momentum and a higher chance of failure, so focus on shorter, more recent divergences for better results.
💧 Liquidity Must Be Taken Before Entering Trades
Liquidity is essential when confirming trade setups:
The first high or low should take out liquidity from higher time frames (such as range highs and lows).
The subsequent highs or lows should take out local liquidity, which can be identified by overbought or oversold RSI conditions. Ensure there’s a clear market structure shift before entering trades.
⏰ Timeframe Considerations for Different Trade Types
For swing trades, focus on longer timeframes like the 4-hour chart to capture larger market moves and trends.
For day trades, the 15-minute timeframe is ideal for capturing short-term price action and finer market details.
🔄 Use Divergences for Trend Reversals, in Confluence with Other Analysis
RSI divergence is best used to identify potential trend reversals. However, it should not be used in isolation. Always look for confluence with other technical analysis methods (such as support/resistance levels, moving averages, or candlestick patterns) to increase the reliability of the signal. Combining multiple tools enhances the accuracy of your trade setups.
Stay sharp, stay ahead, and let’s make those moves. Until next time, happy trading!

EURJPY BULLISH SHARKHarmonic Pattern Trading Strategy:
1. Combine patterns with 2-3 confirmations (e.g., MA, BB, RSI, Stoch) for increased accuracy.
2. Implement proper risk management.
3. Limit exposure to 3% of capital per trade.
4. Exercise caution: Not every Harmonic Pattern presents a good trading opportunity.
5. Conduct thorough diligence and analysis before trading.
Disciplined approach = Enhanced edge.

ADAUSDT - Looks like ADA is forming a beautiful bullish div.Hello to all of you.
This is my first chart post ever. So go easy on me ;-)
I don't want anything from you. I have nothing to sell. I just love ADA.
To me this charts indicates that ADA is forming a bullish divergence. If this is true we could be in for a nice ride. Personally I do as I have always done: I hodl my ADA and prepare to sell a bit every time price evolves positively. That gives me the opportunity to buy the many dips that occurs in every cycle. Remember: No one knows if markeds goes up or down. Nothing can be predicted. But sometimes patterns occur that "normally" leds to a positive outcome. Maybe this setup is one of them.
Thanks to you if you made it this far.
Best regards from public-service.

ASX 200 SPI Futures Test Key Support as RBA Decision LoomsWith disappointing earnings from major names like Westpac and BHP in recent days, and with more than three rate cuts priced for this year, ASX 200 SPI futures look vulnerable to downside heading into today’s RBA policy decision.
They’re now testing major uptrend support—a level that has attracted buyers in recent months. While it’s holding for now, the technical picture is far less convincing for bulls than on previous occasions.
Friday’s false break above the former record highs formed a shooting star daily candle, a clear reversal signal. While the price bounced off the uptrend again on Monday, unlike past instances, this one didn’t last with the price quickly gravitating back towards it.
RSI (14) has diverged from price, flashing a bearish signal, while MACD is curling up and looks close to confirming with a crossover from above.
Everything comes across as heavy.
A break of the uptrend would put the 50DMA in focus as an initial target for bears, with further downside levels at 8280, 8135, and the key 200DMA. A stop above the uptrend would help manage reversal risk.
If support holds, an alternative approach would be to set longs ahead of it with a stop beneath for protection. Potential upside targets include 8546 and 8581.
Good luck!
DS

Retesting Low of Lows on Cameco. CCJThe technical signal has been shown for the bearish side. And it may drop further. There is a tendency for markets to retest an important price level 2 or three times, after which the whole dynamic pivots and we go the other way. There is no way to tell if and when this is going to happen and that is why trading is hard and awesome.

EURUSD Technical Forecast on NFP 07.02.2025Overall Trend & Context:
The EURUSD pair is in an overall downtrend on the higher time frames and has recently been consolidating on the lower times.
Fundamental Considerations for the NFP:
Consensus Forecast (High Probability) - Most analysts forecast a gain in the 169K–170K range, which lines up with recent trends. A neutral result would suggest that the labor market is still solid.
Stronger-than-Expected Outcome (Medium Probability) - If the report comes in well above consensus (eg: above 190K jobs), it could reinforce expectations for a more hawkish stance by the Federal Reserve.
Weaker-than-Expected Outcome (Low Probability) - A result below expectations (eg: fewer than 135K jobs) might trigger a reassessment of the US economic outlook, we will need to watch the markets and prepare for dynamic shifts.
Technical Findings:
Weekly - Bearish and trading well below EMA's.
Daily - Bearish & showing signs of 25 EMA rejection. Previous distribution is holding price at bay.
4 Hour - Strong supply levels holding and trading below the 200 EMA.
1 Hour - Close to overbought levels and LTF distribution is holding.
Important Notes:
DXY is at a previous demand which proved to be a challenge to break through in the past.
GBPUSD & EURUSD can have variations in the short term correlation but the technicals both align, which reinforces our EURUSD narrative.
USDJPY technicals remain bullish on the long term however, the short term is in a downtrend and has reached a daily demand - we could potentially see a bullish reaction from here (based on DXY strength and the negative correlation with EURUSD)
Potential Scenarios & Probabilities:
If the lows at 1.03800 fail we may need to adjust our entry zones based on where liquidity and supply are found.
If price reaches the weaker supply level closer to the release of the NFP we can enter, however there is a chance we could get stuck in some drawdown if supply isn't strong enough to push through.
HIGH PROFILE NEWS RELEASES ARE DOUBLE EDGED IF YOU'RE NOT CAREFUL. YOU DO NOT NEED TO BASE YOUR ENTIRE TRADING CAREER ON IT. STAY OUT IF YOU'RE NOT COMFORTABLE TRADING NEWS.
AS TRADERS, YOUR PRIMARY JOB IS TO PROTECT YOUR CAPITAL - WITHOUT CAPITAL YOU CAN'T MAKE ANY MOVES.
Trade smart.
Hope you all make money if you're trading today!
Apex out!
OANDA:EURUSD FX:EURUSD FOREXCOM:EURUSD OANDA:USDJPY TVC:DXY OANDA:GBPUSD PEPPERSTONE:GBPUSD FX:USDJPY
