NATGATE - Attractive RISK REWARD RATIO ?NATGATE - CURRENT PRICE : RM1.57
On 08 MAY 2025, the stock made a small gap up and closed higher at RM1.58 - with high trading volume. From there the share price rises few days and touched intraday high at RM1.81 on 15 MAY 2025.
Then the stock retrace and now it bounced from the small gap zone. The small gap zone may acts as strong support level. At the same time, there is also EMA-50 support. STOCHASTIC OSCILLATOR shows an oversold situation (which indicates rebound may happens in near term) while RSI is still above 50 (BULLISH).
At current moment this trade gives an attractive RISK REWARD RATIO. My entry price will be RM1.55 - RM1.58.
For target price, there are two strong resistance.
1. EMA 200
2. The high of LONG BLACK CANDLESTICK (03 MARCH 2025 candle)
One of my trading technique is I would take profit one or two bids below the actual RESISTANCE LEVEL. As such, my 1st target for NATGATE will be RM1.73 (below EMA 200) and 2nd target is RM1.85 (below actual RESISTANCE RM1.87 - The high of 30 MARCH 2025 long black candlestick).
ENTRY PRICE : RM1.55 - RM1.58
TARGET PRICE : RM1.73 and RM1.85
SUPPORT : RM1.50
Notes : Please be aware also that the company is going to announce its QUARTER EARNINGS approximately end of month.
M-oscillator

Monero Wave Analysis – 30 May 2025- Monero reversed from round resistance level 400.00
- Likely to fall to support level 300.00
Monero recently reversed down from the powerful round resistance level 400.00, standing far above the upper daily Bollinger Band.
The price will form the weekly Japanese candlesticks reversal pattern Bearish Engulfing if it closes this week near the current levels – strong sell signal for Monero.
Given overbought reading on both weekly RSI and Stochastic, Monero can be expected to fall to the next round support level 300.00.

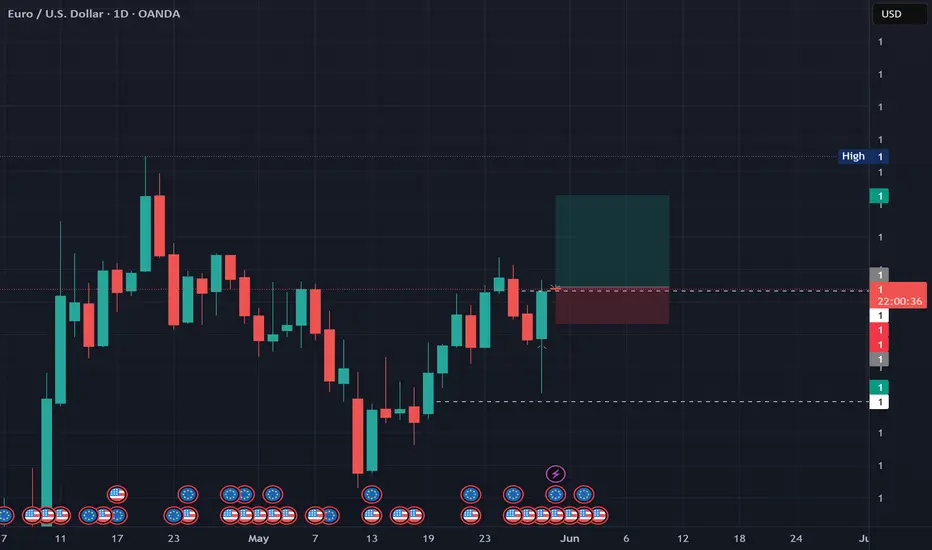
EU Bull runJust some simple bullish movement. Nothing much to really say about it other then looks like a good opportunity.
Microsoft Wave Analysis – 29 May 2025
- Microsoft reversed from resistance zone
- Likely to fall to support level 447.00
Microsoft recently reversed down from the resistance zone located between the resistance levels 465.00 (which stopped the weekly uptrend in 2024) and 455.00 (top of wave (B) from the end of 2024).
This resistance zone was further strengthened by the upper weekly and daily Bollinger Bands.
Given the strength of the aforementioned resistance zone and the overbought daily Stochastic, Microsoft can be expected to fall to the next support level 447.00.

Against All OddsThis highlights the importance of the Daily time frame as if we did not notice it's movements along side the 4h greed zone we would not have been on top like many others who have fallen today.

Buying the greed indicationAfter the fear fall catch it hit a greed area where price is rallies often so this is a favorable price to get in at as everyone seems to think it cheap.

FTSE 100 Wave Analysis – 28 May 2025
- FTSE 100 index reversed from key resistance level 8800.00
- Likely to fall to support level 8650,00
The FTSE 100 index recently reversed from the key resistance level 8800.00 (which has been steadily reversing the index from the start of February).
The resistance area near the resistance level 8800.00 was strengthened by the upper daily Bollinger Band.
Given the overbought daily Stochastic, FTSE 100 index can be expected to fall to the next support level 8650,00 (former top of wave (1) from the start of May).

I had already taken this trade, just documenting itNothing significant to mention, just that it is a good opportunity of a bounce

WATCH OUT FOR VERITASKAPFrom around 0.83, VERITASKAP created an all-time high of around 1.81. This happened between August 2024 and September 2024. Then, price dropped into the discount level where is currently. The current price action shows that price is in a discount level, at a demand zone and within a falling wedge.
From a chart pattern perspective, falling wedge can be seen on the chart and a break out of the downtrend and resistance level around 1.06 with a bullish candle closing above these levels will serve as a strong indication that the stock is ready to rally up as much as the all-time high.
From a technical indicator perspective, awesome oscillator is below 0, showing that the stock is oversold. In addition, there is a bullish indication on the awesome oscillator as shown by its colour and upward movement. This is pointing to the fact that the value of the awesome oscillator is moving towards 0 and can cross over it which can be a good indication for a rise in price as well.
From a smart money concept perspective, a break of the last high (around 1.27) that led to the last bearish internal break of structure will as serve as indication of a bullish trend. Hence, the target will the all-time high.
Either way, the stock has a good potential. An aggressive trader or investor may buy at the current market price. While a conservative trader or investor may wait for a breakout.
Watch out for the confluences indicating potential rise in price so as to not miss out on the benefit.

IBM: Sneaking Toward a Breakout?International Business Machines is the top-performing member of the Dow Jones Industrial Average this year, and some traders may think it will keep climbing.
The first pattern on today’s chart is the push above $269 last week. The IT company pulled back after hitting that record peak, but found support at its rising 21-day exponential moving average (EMA).
It also closed above its 8-day exponential moving average (EMA), which is additionally above the 21-day EMA. Those signals may be consistent with a short-term uptrend.
Next, IBM is above $261.64, the previous weekly closing high from early March. That may suggest a breakout is being attempted.
Third, MACD is rising.
Fourth, you have some longer-term patterns. The 50-, 100- and 200-day simple moving averages (SMAs) are in a potentially bullish sequence, with faster SMAs above the slower. IBM also held its January low in April, avoiding the deeper declines experienced by the broader market.
Those patterns may be consistent with long-term strength.
Check out TradingView's The Leap competition sponsored by TradeStation.
TradeStation has, for decades, advanced the trading industry, providing access to stocks, options and futures. If you're born to trade, we could be for you. See our Overview for more.
Past performance, whether actual or indicated by historical tests of strategies, is no guarantee of future performance or success. There is a possibility that you may sustain a loss equal to or greater than your entire investment regardless of which asset class you trade (equities, options or futures); therefore, you should not invest or risk money that you cannot afford to lose. Online trading is not suitable for all investors. View the document titled Characteristics and Risks of Standardized Options at www.TradeStation.com . Before trading any asset class, customers must read the relevant risk disclosure statements on www.TradeStation.com . System access and trade placement and execution may be delayed or fail due to market volatility and volume, quote delays, system and software errors, Internet traffic, outages and other factors.
Securities and futures trading is offered to self-directed customers by TradeStation Securities, Inc., a broker-dealer registered with the Securities and Exchange Commission and a futures commission merchant licensed with the Commodity Futures Trading Commission). TradeStation Securities is a member of the Financial Industry Regulatory Authority, the National Futures Association, and a number of exchanges.
TradeStation Securities, Inc. and TradeStation Technologies, Inc. are each wholly owned subsidiaries of TradeStation Group, Inc., both operating, and providing products and services, under the TradeStation brand and trademark. When applying for, or purchasing, accounts, subscriptions, products and services, it is important that you know which company you will be dealing with. Visit www.TradeStation.com for further important information explaining what this means.

Why I Think Gold May Buy This Week...Technical AnalysisHey Rich Friends,
I think Gold will continue to buy today and potentially for the rest of the week. This is only my technical analysis, so please check the news and cross-reference the indicators on your chart. Here is what I am looking at:
- The market has been pushing up since it hit a swing low at 3285
- Bullish candles are picking up momentum with Bullish engulfing on H1. This is a bullish confirmation for me
- The STOCHASTIC is facing up, the orange line (slow) is below the blue line (fast), both have crossed above 50%.
These are all bullish confirmations for me. I will setting buy stops as marked on my chart. I will set my SL at the previous low and use previous highs as my TPs. Good luck if you decide to take this trade. Let me know how it goes in the comments below.
Peace and Profits,
Cha

This Hidden Altcoin Could Explode—But Only If THIS Level Holds!Yello Paradisers, have you seen what’s quietly brewing on REZUSDT? A high-probability bullish reversal setup is forming, and if this level holds, it could lead to one of the cleanest altcoin plays we’ve seen recently. This isn’t just about one signal—REZUSDT is showing a rare confluence of bullish indicators that deserve your full attention.
💎Currently, REZUSDT is moving within a descending channel while printing a bullish divergence on momentum indicators. At the same time, a textbook W-pattern has just formed, and what makes this even more significant is that it’s happening right at a support zone. This triple confluence—descending channel, bullish divergence, and W-pattern at support—is increasing the probability of a bullish breakout in the coming sessions.
💎From an entry perspective, those looking for more favorable risk-to-reward (RR) could benefit from a deeper pullback. That would offer a higher probability setup and tighter risk management. However, for aggressive or short-term traders, the current level still offers a 1:1 RR, which, while not optimal, is acceptable under strict trade management and position sizing.
💎That said, there’s a critical invalidation point that must be respected. If the price breaks down and closes a full candle below the support zone, it would invalidate the entire bullish structure. In such a case, the only professional move is to stay out and wait for cleaner confirmation or a better-developed setup. There is no room for hope in trading—only strategy and discipline.
🎖Strive for consistency, not quick profits. Trade smart, Paradisers. This setup could be a gift for the patient and a trap for the impulsive. The key is always the same—discipline, patience, and strategic execution. Stay sharp, stay focused, and keep protecting your capital.
MyCryptoParadise
iFeel the success🌴

BTCUSDTPrice action anlysis
The initial phase, likely Phase A, marked the stopping of the previous downtrend. The low reached around the 24th could be identified as a Selling Climax (SC) or a significant low. The subsequent rally to near the 25th then established an Automatic Rally (AR), defining the upper boundary of the initial trading range. A following decline that tested the SC zone, around the 25th, would constitute a Secondary Test (ST). Following this, the price entered Phase B, the "building of the cause," where the "Composite Man" is presumed to be accumulating. From the ST on the 25th until near the 26th, the price moved laterally, repeatedly testing the support and resistance levels established by the SC and AR, with supports around $107K-$107K and resistance evolving from $109K towards $109-$110K The low on the 26th, reaching near $107K, is particularly noteworthy and could be interpreted as a Spring or an ST in Phase C, effectively a shakeout below prior support.
If this low on the 26th is indeed a Spring, then Phase C, the test, is confirmed by the immediate subsequent rally that did not retest this low with any significant force, indicating a lack of supply. This leads us into Phase D, characterized by a developing uptrend within the range and the potential for a breakout. The ascent starting late on the 26th and continuing to the current moment displays clear Signs of Strength (SOS). The price has broken through internal resistance levels within the range and is now challenging the upper boundary of the broader trading range, near $110K. Currently, the price at $109K is situated at a critical resistance zone, which notably coincides with the Point of Control (POC) indicated by the volume profile.
Volume Behavior Analysis:
The behavior of volume provides further context. During Phase A, volume at the SC, while not climactic, was significant compared to its immediate surroundings, and the volume on the AR was moderate. Crucially, volume during the ST on the 25th was markedly lower than at the SC, a positive sign for accumulation, suggesting diminishing selling pressure. Throughout Phase B, volume was somewhat erratic but generally decreased on successful tests of support. Some volume spikes were observed on upward movements testing resistance, indicating absorption of supply. The volume on the potential Spring on the 26th was moderate, which is acceptable if followed by a swift recovery on low-volume retests. In Phase D, the rally from late on the 26th has been accompanied by an increase in volume on bullish candles, especially during the breakout of internal resistance levels, supporting the SOS and indicating demand taking control. Current volume, as the price consolidates at the highs, is moderate.
RSI Behavior Analysis:
The Relative Strength Index (RSI) offers additional insights. A clear bullish divergence is evident when comparing the price low of the 25th with the low of the 26th; while the price made an equal or slightly lower low, the RSI formed a distinctly higher low. This classic signal supports the interpretation of a Spring or a final test of supply. During the accumulation phase, the RSI mostly oscillated below the 50-60 levels. With the onset of Phase D and the SOS, the RSI has crossed above and is maintaining itself above 50 (currently at 58.27), indicating a shift towards bullish momentum. It is not yet in overbought territory (above 70), suggesting potential for further upside if demand persists. The volume profile on the right shows the POC, the area of highest traded volume, situated precisely where the price is currently, around $109,7K - $109,8K. This area acts as a strong magnet and a significant potential resistance or support. Below this, a High Volume Node (HVN) around $108K could serve as strong support on pullbacks. Above the current POC, a Low Volume Node (LVN) exists before another minor HVN near $111K; LVNs are often traversed quickly if the price can overcome the current HVN.
Relevant Points to Consider for the Next 24 Hours:
Looking ahead for the next 24 hours, several key elements will be crucial. The immediate focus is on the price's ability to break and sustain above the current resistance and POC zone of $109,7K - $110K USDT. A confirmed breakout above $110K USDT, ideally accompanied by increasing volume, would validate the SOS and signal entry into Phase E, a markup phase, with potential targets around $110,5K and then the HVN near $111K. A pullback to this breakout zone that holds as support, forming a Last Point of Support (LPS), would be a strong bullish indication. Conversely, a failure to overcome this zone, especially with increasing selling volume, could lead to a retracement to test lower supports, initially around $109K-$109,2K, and then potentially the HVN at $108K. Volume during any breakout or rejection will be paramount; a low-volume breakout would be suspect (a potential Upthrust), while increased volume on a breakout would be confirmatory. For the RSI, if new price highs above $110K are achieved, it will be important to see if the RSI confirms with new highs or forms a bearish divergence, which could warn of short-term bullish exhaustion. Sustaining above RSI 50 is positive. From a Wyckoff perspective, if this is indeed Phase D, "Backups" or LPS testing the breakout area are normal. However, a failure of the structure, such as a decisive break below the Spring level (e.g., below 106,800), would invalidate the accumulation scenario and suggest either redistribution or a continuation of the prior downtrend.

GBPUSD SHORT IDEAGBPUSD has been rally up for a while. Currently, there's a divergence signal from the awesome oscillator on the daily timeframe. Switching to 4 hours timeframe, there's a clearer view of what's going on. Based on the 4 hours chart, rising wedge has been formed and there's also a bearish divergence signal from the awesome oscillator. In addition to these, price has mitigated a daily supply zone after taking out a significant high as a liquidity. Then, a bearish engulfing candlestick was formed, signifying potential reversal. On 1 hour timeframe, price has broken out of a rising wedge and retested it.
As a retail trader, one can enter a short position after the bearish engulfing candlestick confirmation. This aligns with the 1 hour breakout and retest. While one can wait for price to break out of the 4 hours rising wedge.
As a smart money trader, one can wait for a change of character and break of structure on the 4 hours timeframe to confirm that price has really changed its trend ready for a reversal.
Either way, one can take advantage of the potential short opportunity on GBPUSD.
Confluences for the short signal:
1. Bearish divergence signal from awesome oscillator on daily and 4 hours timeframe.
2. Rising wedge on 4 hours timeframe.
3. Price mitigating daily supply zone.
4. Price has taken out a significant high as a liquidity.
5. Bearish engulfing candlestick formation on 4 hours timeframe.
Disclaimer: This is not a financial advice. The outcome maybe different from the projection. If you can't accept the risk, don't take the signal.

NVDA - 140 Quasimodo?Well NVDA has exceeded the 120 PoC from the last year, and other than the head and shoulders developing it looks rather bullish above that 120. But I would sell 140, or at least not buy.
And if I'm buying I'd probably wait for 112. Think I will wait forever? 😂
Will update after we get some more data.

Nine Failures at $33.50—Will Silver Bulls Finally Step Aside?How many more failures above $33.50 will silver bulls need to see before they step aside and let the market correct? Nine times since mid-April we’ve seen the level breached, only for price to reverse lower—providing a decent short setup if and when the bulls give up.
Positions could be established around the level with a stop above $33.69 for protection, targeting the 50DMA initially with $32.00 and $31.67 options after that. If the price is unable to break uptrend support, considering squaring the position. It’s found around $33.20 today.
Momentum indicators remain bullish, although there are signs upward momentum is waning.
If the bulls manage to break and hold above $33.69, the setup could be flipped, with longs established on the break and a stop beneath for protection. The March high of $34.59 screens as an obvious target.
Good luck!
DS

NEM SHORT IDEANEM Insurance stock is ready to have a drop. There's a bearish divergence signal from the awesome oscillator showing that there's a high tendency for the price of the stock to drop as much as to 11.65 and below that value. Any value below 11.50 is the discount level where there can be a potential for the next long opportunity.
Looking at the past data, some patterns were revealed. In September 2016, there was a bearish divergence signal and the price dropped from around 3.71 to around around 1.51. Likewise, in September 2022, there was a bearish divergence and the price dropped from around 5.65 to around 3.71. Similar pattern is what is repeating itself showing that there's a higher probability that the price dropped into the discount level. For an investor holding this stock, this maybe a signal to sell and wait for another long opportunity. For a trader, it's an opportunity to short the stock, targeting the discount price around 11.65.
Confluences for the short signal:
1. Price is showing higher high while awesome oscillator is showing lower high indicating bearish divergence.
2. When similar patterns occured in the past, price dropped into the discount level.
3. A bearish engulfing candlestick had been formed showing that price is likely going to drop further.
Disclaimer: This is not a financial advice. The outcome maybe different from the projection. If you can't accept the risk, don't take the signal.

Platinum Wave Analysis – 26 May 2025
- Platinum reversed from long-term resistance level 1095,00
- Likely to fall to support level 1075.00
Platinum recently reversed down from the major long-term resistance level 1095,00 (former yearly high from 2024), which stopped the previous weekly impulse wave A.
The resistance level 1095,00 was strengthened by the upper daily and the weekly Bollinger Bands.
Given the strength of the resistance level 1095,00 and the overbought weekly Stochastic, Platinum can be expected to fall to the next support level 1075.00.

NASCON LONG IDEA CONTINUATIONNASCON stock reached its all time high value of around 77 in January 2024. This happened after a bearish divergence signal from the awesome oscillator. Then, it dropped into the discount level. After which a bullish divergence signal was given, followed by a breakout. Since that breakout, price has been going up and rally for the all-time-high value. The first long opportunity could have been in November 2024 when the price was around 30. The next opportunity was when the price was around 44. Then the next opportunity was when price was around 54. Joining the rally now is not too late since the stock has a potential to hit 77.
Confluences for the long idea
1. Price was coming from the discount level.
2. Price broke out of a down trend line.
3. Price has been rally after a bullish divergence signal given by the awesome oscillator.
4. Bullish engulfing candlestick was formed recently after breaking a key level.
Disclaimer: this is not a financial advice. The outcome maybe different from the projection. If you can't accept the risk, don't take the signal.

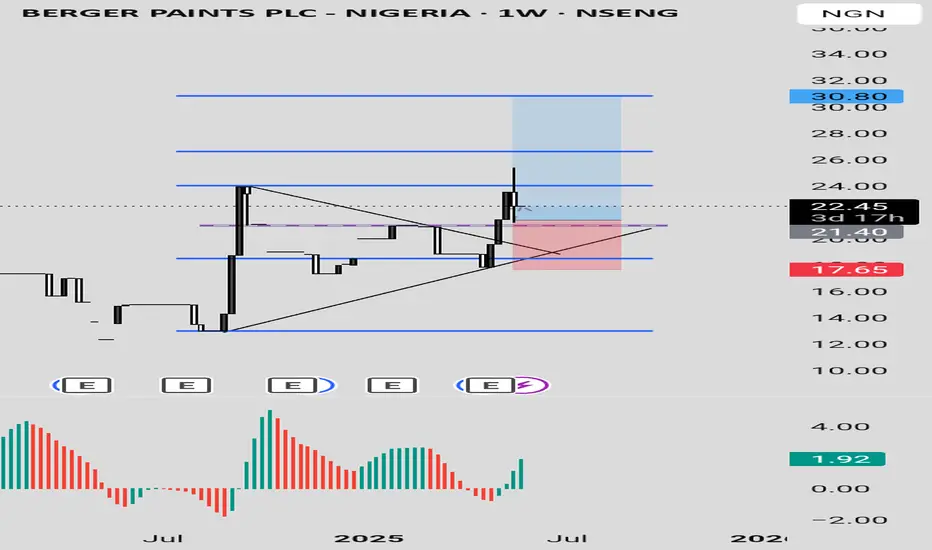
Berger Paints PLC Berger Paints PLC stock is showing a bullish signal for appreciating in value. The price dropped into a discount level and broke a down trend line with a strong bullish candle, closing above the trendline. This happened when the price was also in an oversold region as indicated by Awesome Oscillator.
Currently, there has been a pull back with a rejection, showing more confidence in the bullish move. The stock can be bought at the current price while targeting 24, 26.60 and 30.80 as the final target based on the Fibonacci level.
Confluences for the long signal:
1. Price is coming from a discount level
2. Price was in oversold level before and it is showing more bullish signal
3. Price had broken out of a down trend line with a strong bullish candle
4. There was a strong rejection from last week candle.
Disclaimer: this is not a financial advice. The outcome maybe different from the projection. Don't take the signal if you don't accept the risk.
RT BRISCOE PLC LONG IDEART BRISCOE PLC stock, after reaching its all time high, dropped to discount level. Currently, it has broken out of down trend line with a strong weekly bullish candle closing above a the down trend line and resistance level. The awesome oscillator is also in the oversold region with a bullish signal. An aggressive trader or investor can buy at the current price while a conservative trader or investor may wait for a drop to around 2.20 and 2.30 to place a buy. While you can also so spread your risk by buying at the current market price and add more positions when price drop towards the resistance turned support.
The entry is at the current market price or buy at 2.20 while the stop can be at 1.73 and the target can be around 2.90 and 4.30.
Confluences for the long signal:
1. Price is in discount level
2. Price broke out of a down trend line and resistance level with a strong bullish candle.
3. Awesome oscillator is in oversold region and showing bullish signal.
Disclaimer: this is not a financial advice. The outcome maybe different from the projection. If you can't accept the risk, don't take the signal.

BTCUSDT 26/05/2025: Overall Price Structure and Wyckoff PhasesPrice Action Analysis:
Observing the price action from May 23rd to May 26th, the chart suggests the development of a Wyckoff accumulation schematic. The initial phase, Phase A, marked the stopping of the previous downtrend. This began with a Selling Climax (SC), where price bottomed near the $107,3K level due to panic selling being absorbed by larger interests. This was followed by an Automatic Rally (AR) to approximately $110K, which established the upper boundary of the subsequent trading range. Subsequent declines, like those served as Secondary Tests (STs) of the SC area.
Phase B represented the "building of the cause," where the "Composite Operator" accumulated positions. This phase extended from the AR, with price trading largely sideways between roughly $107K and $109,8K. The Volume Profile Visible Range (VPVR) highlights a significant Point of Control (POC) near $107,3K during this period, indicating substantial trading activity and value acceptance in the lower part of this range.
Phase C involved a critical test of supply. The dip observed around towards the $106,8K level, testing the SC/ST lows, can be interpreted as a Spring. This maneuver is designed to mislead uninformed traders and assess remaining supply, with price quickly recovering above the range's support.
Following the test, Phase D began, signifying the trend emerging out of the range and its confirmation. A clear Sign of Strength (SOS) occurred with the strong rally. This move decisively broke above the Phase B trading range resistance ($109,8K) and reached approximately $110,4K, indicating that demand had overcome supply. Currently, the price action on May 26th, consolidating above the broken resistance (now support) around the $109,6K-$109,9K area, is characteristic of a Last Point of Support (LPS) or a Back-Up (BU) to the "creek." This area also aligns with a new prominent POC on the VPVR, suggesting it's a new level of value acceptance.
Volume Behavior Analysis:
Volume patterns have closely supported the Wyckoff schematic. The Selling Climax on May 23rd was accompanied by a distinct volume spike, indicative of a significant transfer of shares. Volume during the subsequent Automatic Rally and Secondary Tests was generally lower, signaling diminishing selling pressure. The Spring on May 25th showed notable volume, suggesting a final cleanout of supply, but the ensuing rally demonstrated demand's ability to absorb this. Critically, the Sign of Strength breakout rally on May 25th occurred with a significant increase in volume, validating the upward thrust. During the current LPS/BU consolidation, volume has generally decreased, which is a constructive sign, suggesting light selling pressure as the new support level is tested.
RSI Behavior Analysis:
The Relative Strength Index (RSI) has also provided confirming signals. During the Selling Climax, the RSI likely dipped into oversold territory (below 30). Throughout Phase B, it oscillated primarily in the neutral zone, reflecting the range-bound price action, and may have formed bullish divergences. The Spring might have seen the RSI briefly dip or form another bullish divergence. Importantly, during the Sign of Strength, the RSI surged upwards with the price, likely approaching or entering overbought territory (above 70), confirming strong bullish momentum. In the current LPS/BU phase, the RSI has pulled back from its highs and is now around 46.58, a neutral reading. This cooldown is typical after an impulsive move and provides room for a potential next leg up.
Primary Trend, Signs of Strength, and Weakness:
The trend prior to May 23rd was likely bearish. However, the successful development of the Wyckoff accumulation structure and the subsequent SOS indicate that the emerging primary trend is now considered bullish for the short to medium term.
Signs of strength for this new bullish trend include the completed accumulation schematic, the decisive SOS breakout with increased volume, the price holding above the broken resistance (now support) during the LPS/BU phase (around $109,6K-$109,8K), diminishing volume on the pullback, and the RSI cooling off to neutral. The new POC forming at the LPS/BU level further reinforces this area as a value zone.
Signs of weakness to watch for would include the price failing to hold the current LPS/BU support, a significant increase in selling volume on rally attempts, the price falling back into the previous trading range, or the RSI breaking down or forming significant bearish divergences.
Relevant Points to Consider for the Next 24 Hours:
Over the next 24 hours, the price action around the key support zone of $109,5K to $109,9K (LPS/BU) will be critical. Holding above this, especially with low volume on any dips, would signal continued strength. Volume confirmation is essential: any attempt to rally from the current consolidation and break the recent high around $110,4K should be accompanied by an increase in volume. The RSI should ideally confirm new price highs or hold above 40-50 on tests of support. The immediate resistance is the recent high around $110,4K. A sustained break above this with good volume would signal the continuation of the markup phase. Should the current LPS/BU fail, the next significant support to watch would be the $107K - $107,3K zone. The market is in a post-SOS consolidation, and the immediate future will determine if the markup resumes or if further testing is needed.

USDJPY – Targeting Structure Break for ABC Sell Setup 📉 USDJPY – Targeting Structure Break for ABC Sell Setup 📉
🔹 Timeframe: 30M
🔹 Methodology: Elliott Wave + AO + Structure Break + BBMA
⸻
🔍 Current Market Outlook:
I’m currently observing Wave 4 playing out as a complex correction. Price is pushing toward the key level 142.796, which I expect to break structure (BOS) to the upside.
Once that level is cleared, I’ll be watching closely for signs of an ABC corrective move to form — setting up a high-probability sell opportunity aligned with the final Wave 5 leg.
⸻
🧠 Key Technical Highlights:
✅ Wave Count:
• Wave 3 is confirmed by the strongest momentum on the AO
• Wave 4 is unfolding and approaching structure at 142.796
• AO shows decreasing bullish momentum, hinting at possible exhaustion
✅ Plan:
• Wait for break above 142.796
• Monitor for completion of ABC correction
• Enter short after C-leg confirmation
• TP at 1.618–1.786 Fib extension zone (141.818–141.614)
• Anticipating bullish divergence on AO by the end of Wave 5
⸻
📌 Confluence Checklist:
✔️ Wave theory
✔️ BOS expected
✔️ Fibonacci targets
✔️ AO divergence setting up
✔️ BBMA structure alignment
⸻
🎯 Strategy Summary:
Break 142.796 ➝ Spot ABC ➝ Enter short on C ➝ Ride Wave 5 ➝ TP @ extension zone
⸻
💬 Share your thoughts—Are you seeing the same potential Wave 5 setup? Let’s discuss.
👉 Follow me for clean structure-based analysis, BBMA setups, and advanced wave insights.
#USDJPY #ElliottWave #ForexSetup #WaveAnalysis #BBMA #AOindicator #MarketStructure #BreakOfStructure #SmartMoney #SellTheRally #Wave5 #ForexStrategy
