An Extended In-Depth BTC/USDT Technical ExaminationThis comprehensive technical analysis offers a granular look into the recent trading activity of BTC/USDT. By dissecting the established market structure, various indicator signals, and crucial volume patterns, we aim to build a detailed picture of the forces at play and the evolving sentiment within this market.
1. The Bedrock: Established Bullish Structure and a History of Ascending Peaks
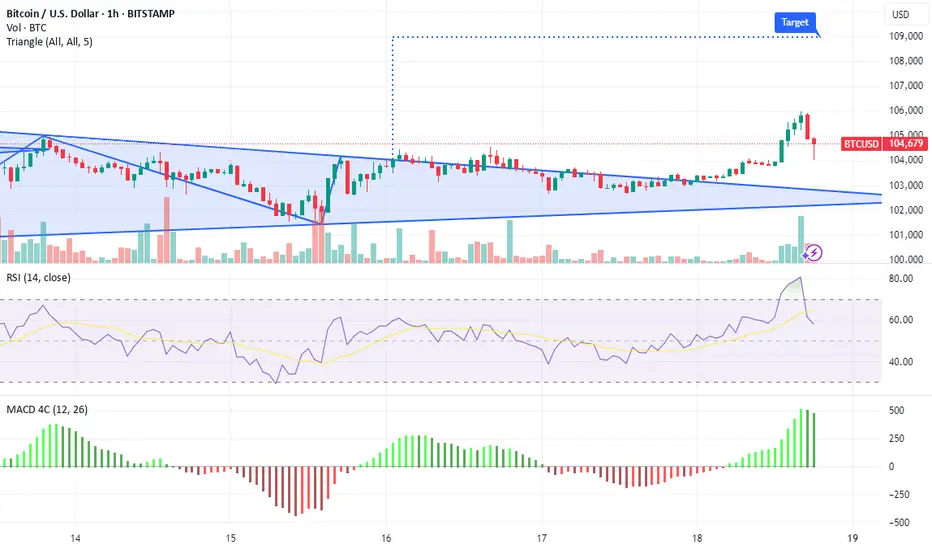
Observing the price action from the designated "STRUCTURE START" point, it's evident that Bitcoin has, for a considerable span, carved out a path indicative of bullish market dominance. This was not a haphazard series of movements but rather a more methodical construction of a positive trend, characterized by the consistent achievement of higher highs. Each successive peak surpassed its predecessor, and often, the subsequent troughs also formed at higher levels than those before them. This pattern of ascending highs and higher lows is a cornerstone of classical technical analysis, widely interpreted as a sign of robust underlying demand and a prevailing optimistic sentiment among market participants. Buyers have demonstrated a recurring willingness to absorb selling pressure and to pay incrementally more for the asset, leading to this stair-step upward progression. This established bullish framework provides the critical context against which more recent, potentially contrasting, signals must be evaluated. It forms the baseline expectation of continued upward momentum that has been challenged by more recent developments.
2. An Early Warning: The Initial Bearish Divergence and Its Eventual Neutralization
Well before the most recent price turbulence, an interesting cautionary signal emerged in the form of a "WEAK BEARISH DIVERGENCE," as demarcated by the yellow dashed line connecting price peaks with corresponding RSI peaks. This specific instance occurred when the price chart successfully printed a new, higher high, yet the Relative Strength Index (RSI), a momentum oscillator, failed to confirm this strength, instead registering a lower high. Such a discrepancy between price and momentum is a classic bearish divergence. It often suggests that while the price is still being pushed upwards, the underlying buying power or enthusiasm is beginning to wane. It can be an early indicator that the bullish thrust is losing conviction and that the trend might be vulnerable to a pullback or reversal.
However, this particular early warning signal did not immediately usher in a significant downturn. As the chart highlights with the red "!" exclamation mark on the RSI, this divergence was subsequently "mitigated." Divergence mitigation can occur in several ways, such as a sharp price correction that pulls the RSI down significantly, effectively "resetting" the oscillator, or a period of sideways consolidation where the RSI drifts lower, resolving the overbought conditions without a major price drop. In this case, the mitigation implied that the bearish undertones indicated by the divergence were either absorbed by renewed buying interest or were not potent enough to derail the overarching uptrend at that juncture. The market seemingly managed to overcome this initial hiccup in momentum, allowing the bullish structure to persist for a while longer.
3. The Volume Narrative: A Tale of Initial Strength Followed by Decisive Weakness at the Apex
The volume profile, particularly over the most recent trading days leading up to and including the latest peak, provides crucial insights into market conviction. As BTC/USDT embarked on its ascent towards the recent significant highs, there was a conspicuous and encouraging surge in trading volume. This is visually represented by the taller volume bars, and the green upward arrow on the volume indicator emphasizes this period of high participation. Generally, strong volume accompanying a price rally or a breakout above key resistance levels is considered a bullish confirmation. It suggests broad market participation, institutional interest, and a strong consensus behind the upward move, lending credibility to its sustainability.
However, a very different and far more concerning volume pattern emerged during the attempt to retest or potentially exceed this recently established high. As indicated by the red downward-sloping arrow and the prominent red question mark above the volume bars, the trading volume experienced a dramatic and notable decline during this critical retest. This sharp fall-off in volume as the price approached or nominally touched the prior peak is a significant bearish tell. It signals a profound lack of buying conviction at these elevated price levels. Potential interpretations include buyer exhaustion (those willing to buy have already done so), profit-taking by earlier entrants, or an absence of new capital willing to chase the price higher. The failure to decisively break the previous high, especially when accompanied by such diminished volume, often acts as a strong precursor to price rejection, suggesting that the bullish impetus witnessed earlier had significantly dissipated, leaving the market vulnerable.
4. An Unresolved Condition: The Persistent Bearish Divergence Deepens its Roots
More recently, and perhaps more alarmingly for bullish prospects, a distinct and more pronounced bearish divergence has taken shape, as explicitly marked in red ("DIV") on the RSI indicator. This divergence materialized as the price action, particularly looking at candle closes, managed to etch out highs that were comparable to, or in some instances slightly above, the peak established just before the sharp subsequent decline. In stark contrast, the RSI painted a very different picture, charting a series of clearly lower highs. This disjuncture, where price holds or inches higher while momentum (as measured by the RSI) visibly weakens, is a classic and often more reliable bearish signal. It implies that the upward price movements are occurring on fumes, with diminishing underlying strength and buying support.
What makes this particular divergence especially noteworthy is its resilience. Despite the "relatively violent attack on the lows" observed – a sharp and rapid downward price movement that might typically be expected to "reset" indicators and alleviate overbought conditions or divergences – this bearish divergence was not mitigated. One might anticipate such a forceful sell-off to drive the RSI down substantially, thereby resolving the discrepancy with price.
However, in this instance, while the RSI did decline in response to the price drop, it did not fall to a level that would invalidate the pre-existing bearish divergence. Instead, this sequence of events seems to have reaffirmed and potentially extended the divergence. The RSI’s failure to achieve a deep reset during the sell-off, coupled with any subsequent weak price recovery attempts that still keep the RSI relatively subdued compared to its earlier peaks, reinforces the notion that the selling pressure encountered was substantial and that the bulls currently lack the momentum to decisively overcome this prevailing underlying weakness. This persistent, unmitigated divergence, especially when viewed in conjunction with the aforementioned volume weakness at the highs, strongly suggests a more entrenched struggle for the bulls.
Conclusion:
While it's true that in the very short term, the persistence and extension of the bearish RSI divergence, coupled with volume weakness during the latest attempt to surpass highs, presents a scenario with slightly bearish undertones and warns of a potential corrective or consolidation phase, it is crucial not to lose sight of the broader perspective. The primary price structure, observed since the "STRUCTURE START," continues to exhibit a sequence of higher highs. This is a fundamental pillar that maintains the bullish scenario as the principal and most probable one in the medium term.
Therefore, even if the price were to experience a correction and seek lower support levels or even recent lows (such as a potential test of the POC zone or lower marked levels), the priority mindset should remain geared towards identifying buying opportunities. This is because the underlying expectation is that, following a potential corrective or consolidation phase, the price will resume its path to make future attacks on key resistance levels. Seeking long trades, with an eye on surpassing recent highs and continuing the upward trend, remains the predominant strategy.
Additionally, it is vital to consider the confluence with the prevailing bullish trend on higher timeframes (daily, weekly). What we are currently observing on this lower timeframe chart could be interpreted as a phase of fractal re-accumulation within the inertia of this larger uptrend. That is, a pattern of consolidation and subsequent continuation that replicates on a smaller scale within a broader bullish movement. Pullbacks, in this context, often serve as opportunities for longer-term traders to add to positions or for new participants to enter in the direction of the main trend.
Consequently, while the formation of a short-term bearish setup cannot be entirely dismissed, especially if weakness persists and key supports are broken with conviction and volume, this bearish scenario still lacks the necessary confirmations to consider it dominant or to invalidate the underlying bullish structure. For now, the structure of higher highs and higher lows, supported by the trend on higher timeframes, suggests that any current weakness might be temporary before a new bullish impulse. The underlying bullish structure remains the primary guide until proven otherwise with compelling technical evidence, such as a break and consolidation below significant prior structural lows.
M-oscillator

BTC ShortLooking for confirmation of Top Failure Swing on RSI... once it breaks previous bottom we go short

eBay May Be Breaking OuteBay has quietly snuck to multiyear highs, and some traders may look for further upside.
The first pattern on today’s chart is the February 26 peak of $71.61. At the time, it was the highest level since November 2021. However, EBAY broke it on Friday and continued upward on Monday. That could suggest it’s breaking out.
Second is the April 1 high just below $69. The e-commerce stock struggled to get above it in early May but soon turned the old resistance into new support. That’s potentially consistent with an uptrend.
Next, the 50-day simple moving average (SMA) is above the 100-day SMA. Both are above the 200-day SMA. That sequence, with faster SMAs above slower ones, may reflect a long-term uptrend.
Short-term signals may be similarly positive. For example, the 8-day exponential moving average (EMA) is above the 21-day EMA and MACD is rising.
Check out TradingView's The Leap competition sponsored by TradeStation.
TradeStation has, for decades, advanced the trading industry, providing access to stocks, options and futures. If you're born to trade, we could be for you. See our Overview for more.
Past performance, whether actual or indicated by historical tests of strategies, is no guarantee of future performance or success. There is a possibility that you may sustain a loss equal to or greater than your entire investment regardless of which asset class you trade (equities, options or futures); therefore, you should not invest or risk money that you cannot afford to lose. Online trading is not suitable for all investors. View the document titled Characteristics and Risks of Standardized Options at www.TradeStation.com . Before trading any asset class, customers must read the relevant risk disclosure statements on www.TradeStation.com . System access and trade placement and execution may be delayed or fail due to market volatility and volume, quote delays, system and software errors, Internet traffic, outages and other factors.
Securities and futures trading is offered to self-directed customers by TradeStation Securities, Inc., a broker-dealer registered with the Securities and Exchange Commission and a futures commission merchant licensed with the Commodity Futures Trading Commission). TradeStation Securities is a member of the Financial Industry Regulatory Authority, the National Futures Association, and a number of exchanges.
TradeStation Securities, Inc. and TradeStation Technologies, Inc. are each wholly owned subsidiaries of TradeStation Group, Inc., both operating, and providing products and services, under the TradeStation brand and trademark. When applying for, or purchasing, accounts, subscriptions, products and services, it is important that you know which company you will be dealing with. Visit www.TradeStation.com for further important information explaining what this means.

MACD indicatorMACD is a useful tool used in trending markets to gauge momentum and shifts in trend direction

DOGE monthly grows is hereIf we check Dogecoin on monthly timeframe and compare that to the previous cycle:
1) 20 & 50 MA on monthly held the price
2) The RSI level is too low and has a lot of room to growth to about 80 level
3) The support held
4) Six months growth gives October 2025
5) June & July most be pretty bullish

GOLD (XAU/USD) - Bullish Wave 4 Retracement in Progress📈 GOLD (XAU/USD) - Bullish Wave 4 Retracement in Progress 💥
15-Minute Chart | Elliott Wave | AO Convergence | Bullish Reversal
🔍 Market Context:
Gold has completed a clear 5-wave impulsive move down from the 3228.75 resistance zone. Based on Elliott Wave Theory, we are now seeing the beginning of Wave 4, a corrective retracement before a potential Wave 5 continuation lower.
🧠 Technical Breakdown:
✅ Wave Count:
Wave 3 completed with strong bearish momentum, ending in a classic 5-subwave structure.
We're now seeing a bullish engulfing candle at the termination of Wave 3, signaling a potential Wave 4 correction.
Price is currently showing strength to the upside, likely retracing to test the previous supply zone near 3,228.75.
✅ Awesome Oscillator (AO):
Notice the bullish divergence (or convergence) forming between Wave 1 and Wave 3 lows.
Momentum is waning, suggesting the sell-off is losing steam—an ideal condition for a Wave 4 bounce.
Histogram bars are beginning to flip green, indicating short-term bullish strength.
✅ Price Action Confirmation:
The bullish engulfing candle marks a potential reversal zone.
Wave (5) of 3 appears to be completed in the green box region, aligning with historical demand.
A breakout above the small pullback could accelerate the move toward the 3220–3228 area.
🎯 Trade Idea (Short-Term):
Bias: Bullish retracement (Wave 4)
Entry: On break of bullish engulfing high
Target: 3220 – 3228 zone (Fib or prior structure resistance)
Invalidation: Close below 3190 or break of bullish engulfing low
📢 What to Watch Next:
Monitor for bearish signals around 3228 to prepare for a potential Wave 5 drop.
If price stalls or forms bearish divergence near resistance, it may offer a high-probability short setup.
💬 Let me know in the comments if you're riding this retrace or waiting for Wave 5! Drop a 👍 if you like clean wave structure analysis!
#XAUUSD #GoldAnalysis #ElliottWave #Wave4 #AO #BullishEngulfing #TradingView #PriceAction #TechnicalAnalysis

8752 Break Could Open Path to Retest Record HighsA clean break above the March 20 high of 8752 would generate a bullish setup, allowing for longs to be established with a stop beneath for protection, targeting a retest of the record high at 8898.
Price action has been bullish in recent days, with a break of minor downtrend resistance on Thursday triggering another wave of buying, backed by solid volumes. Combined with momentum signals that reinforce the trend, the bias remains to buy dips and breakouts.
If the price fails to sustain a break above 8752, the setup is invalidated.
Good luck!
DS

Merck Wave Analysis – 19 May 2025
- Merck reversed from support area
- Likely to rise to resistance level 80.00
Merck recently reversed up from the support area between the long-term support level 73.35 (which has been reversing the price from the middle of 2020) and the lower weekly Bollinger Band.
The upward reversal from this support area created the weekly Japanese candlesticks reversal pattern Long-legged Doji.
Given the strength of the support level 73.35 and the oversold weekly Stochastic, Merck can be expected to rise to the next round resistance level 80.00.

SOLANA 14Months AccumulationSOLANA had a rally from $20 to $190 , and now for 14 Months is accumulating above the strong support at $100.
As the RSI ON Monthly is playing inside a falling channel, upside movement for SOL in the coming months to about $600 is very likely IMO.

EURJPY - Wave 5 Final Push? Time to Watch for Reversal🌀 EURJPY - Wave 5 Final Push? Time to Watch for Reversal 🚨 (Elliott Wave + AO Divergence + Fib Confluence)
📆 Date: May 19, 2025
📊 Pair: EUR/JPY
⏱️ Timeframe: 1H
🔍 Tools: Elliott Wave, Fibonacci Extension, Awesome Oscillator (AO)
🧠 Technical Breakdown
We are currently tracking a textbook Elliott Wave impulsive decline, with price forming a clean 5-wave structure to the downside. The pair now seems to be completing Wave (5) — and several strong signals suggest that a bullish reversal might be imminent.
🔢 Elliott Wave Count
✅ Wave (1) to (4) are already completed.
🔻 Wave (5) has broken below the 2.618 fib extension — which confirms an extended fifth wave.
📉 Current downside target zone lies between the 4.236 – 4.786 extensions:
4.236: ~161.796
4.786: ~161.275
This blue box zone (161.80 – 161.27) is now a high-probability completion area for Wave (5).
📈 Awesome Oscillator (AO) – Bullish Divergence Detected
AO shows a clear bullish divergence between Waves (3) and (5).
Momentum is fading on the bearish side while price makes a new low — classic signal of potential trend reversal.
🎯 Trade Plan: Wait for Confirmation
We’re not jumping in yet — but we’re close.
✅ What to Watch For:
Let price reach the 4.236–4.786 fib zone (at minimum 161.796).
Wait for a Break of Structure (BoS) — a clear break above a recent lower high (likely Wave 4).
On the retest or pullback, look for long entry setups such as:
Bullish engulfing candles
Pin bar rejection
MACD/AO flip
Trendline breakout retest
🎯 Targets
TP1: 162.80 – 163.50 (previous Wave 4 zone)
TP2: 50% – 61.8% retracement of Wave (5)
TP3: 164.40 – 165.20 (supply zone and structure confluence)
🛑 Stop Loss Idea
Place SL below the 4.786 extension (~161.27) or beneath the new low formed, depending on your entry type (aggressive vs conservative).
⚡ Summary
This setup brings multiple confluences together:
✅ Elliott Wave (5-wave completion)
✅ Fibonacci extension target zone
✅ AO bullish divergence
✅ Waiting for structure break for smart entry
💬 Let’s Talk
Are you watching this setup too? Drop a 👍 or your analysis below — let’s grow together!
✅ Follow me for more clean setups using Elliott Wave, Divergence, and Price Action.
🔔 Hit the alert — EURJPY is cooking something!
#EURJPY #ElliottWave #Forex #AO #BullishDivergence #FibExtension #PriceAction #WaveAnalysis #TradingSetup #ForexSignals

SGX Iron Ore: Evening Star Reversal Skews Risks LowerHaving completed a bearish reversal pattern and with bullish momentum starting to fade, traders should stay alert to the risk of renewed downside in SGX iron ore futures.
A three-candle evening star has knocked the price back below $100 per tonne, putting the spotlight on the 50-day moving average for those eyeing potential bearish setups. A clean break below could invite fresh shorts, allowing for a stop to be placed above for protection.
Former downtrend resistance from March 27 may now act as support, offering a potential target around $98 today. Beyond, $96 and $94.75 are levels of interest for those seeking greater risk-reward.
While momentum indicators had swung bullish over the past week, that’s now starting to reverse. RSI (14) has broken its short-term uptrend, and MACD looks toppy. With modest volumes accompanying the reversal, patience is warranted.
Good luck!
DS

Bitcoin Stalls, But Chart Watchers Eye $300,000 Peak: Here's Whe
Bitcoin, the world's leading cryptocurrency, has experienced a period of consolidation, leaving investors and analysts alike pondering its next move. While the price has stalled below the $105,000 mark, a confluence of factors, including popular predictive models and bullish sentiment from prominent crypto analysts, suggests that a significant surge could be on the horizon. The potential for Bitcoin to reach new all-time highs, possibly soaring to between $275,000 and $300,000 by October of this year, is fueling excitement and speculation within the crypto community.
This article delves into the factors driving the bullish outlook for Bitcoin, examining the predictive models, analyst forecasts, and underlying fundamentals that support the possibility of a substantial price increase. We will explore the potential catalysts that could propel Bitcoin to new heights and analyze the technical indicators that chart watchers are monitoring closely.
Predictive Models Point to a Massive Surge
One of the primary drivers of the bullish sentiment surrounding Bitcoin is the existence of popular predictive models that suggest a massive price surge in the coming months. These models, often based on historical data, supply and demand dynamics, and other relevant factors, attempt to forecast the future price of Bitcoin with varying degrees of accuracy.
One such model, which has gained considerable attention in the crypto community, points to a potential surge to between $275,000 and $300,000 by October of this year. While the specifics of this model are not explicitly detailed in the prompt, it is likely based on factors such as Bitcoin's scarcity, its increasing adoption as a store of value, and the potential for institutional investment to drive demand.
It is important to note that predictive models are not foolproof and should not be taken as definitive guarantees of future price movements. However, they can provide valuable insights into potential scenarios and help investors make informed decisions.
Analyst Forecasts: $159,000 This Cycle
In addition to predictive models, bullish forecasts from prominent crypto analysts are also contributing to the optimistic outlook for Bitcoin. One analyst, in particular, has predicted that Bitcoin's price could reach $159,000 this cycle.
While the specific methodology used by this analyst is not detailed in the prompt, it is likely based on a combination of technical analysis, fundamental analysis, and market sentiment. Technical analysis involves studying price charts and other technical indicators to identify potential trends and patterns. Fundamental analysis involves evaluating the underlying value of Bitcoin based on factors such as its adoption rate, network security, and regulatory environment. Market sentiment involves gauging the overall mood and expectations of investors in the crypto market.
The analyst's forecast of $159,000 this cycle suggests a belief that Bitcoin is currently undervalued and that its price will eventually catch up to its intrinsic value.
Bitcoin IS The Opt Out
The phrase "Bitcoin IS The Opt Out" encapsulates a growing sentiment within the crypto community that Bitcoin represents a viable alternative to traditional financial systems. This sentiment is based on the belief that Bitcoin offers several advantages over traditional currencies and financial institutions:
• Decentralization: Bitcoin is not controlled by any single entity, such as a government or central bank. This decentralization makes it resistant to censorship and manipulation.
• Scarcity: Bitcoin has a limited supply of 21 million coins, which makes it a scarce asset. This scarcity is expected to drive its price higher over time as demand increases.
• Transparency: All Bitcoin transactions are recorded on a public ledger called the blockchain. This transparency makes it difficult to engage in illicit activities using Bitcoin.
• Security: The Bitcoin network is secured by cryptography, making it difficult to hack or tamper with.
The belief that Bitcoin offers a viable "opt out" from traditional financial systems is driving increased adoption and investment in the cryptocurrency.
BTC Price to $116K Next? 'Early Week' All-Time High
The prospect of Bitcoin reaching $116,000 in the near future, potentially even achieving an all-time high early in the week, is further fueling bullish sentiment. This forecast, attributed to a Bitcoin trader, suggests that the cryptocurrency is poised to break out of its current consolidation phase and enter a new period of price discovery.
The trader's forecast is likely based on technical analysis, identifying potential breakout patterns and momentum indicators that suggest an imminent surge in price. The expectation of an "early week" all-time high suggests a belief that the market is primed for a rapid and decisive move to the upside.
Leaving the Tight Range Behind
The statement that "Bitcoin is in line to leave its tight range behind in the coming days" suggests that the period of consolidation is nearing its end. A tight trading range typically indicates a period of indecision in the market, where buyers and sellers are evenly matched. However, such periods often precede significant price movements, as pent-up energy is released in one direction or another.
The expectation that Bitcoin will leave its tight range behind suggests a belief that the balance of power is shifting in favor of buyers, setting the stage for a potential breakout to the upside.
Retaking All-Time Highs and Pushing into Price Discovery
The ultimate goal for Bitcoin bulls is to see the cryptocurrency retake its all-time highs and push into price discovery. Price discovery refers to the process of establishing a new price level for an asset when it breaks out of its previous range.
When Bitcoin reaches a new all-time high, it enters a period of price discovery, where there are no historical resistance levels to impede its upward movement. This can lead to rapid and substantial price increases, as buyers are willing to pay higher and higher prices to acquire the asset.
Potential Catalysts for a Bitcoin Surge
Several potential catalysts could propel Bitcoin to new all-time highs and trigger a period of price discovery:
• Increased Institutional Investment: As more and more institutional investors, such as hedge funds, pension funds, and corporations, allocate capital to Bitcoin, demand for the cryptocurrency is likely to increase, driving its price higher.
• Regulatory Clarity: Greater regulatory clarity surrounding Bitcoin and other cryptocurrencies could remove a major source of uncertainty and encourage more investors to enter the market.
• Mainstream Adoption: As Bitcoin becomes more widely accepted as a form of payment and a store of value, its adoption rate is likely to increase, driving demand and price appreciation.
• Macroeconomic Factors: Macroeconomic factors, such as inflation, currency devaluation, and geopolitical instability, could drive investors to seek refuge in Bitcoin as a safe haven asset.
Technical Indicators to Watch
Chart watchers are closely monitoring several technical indicators to gauge the potential for a Bitcoin surge:
• Breakout Patterns: Identifying potential breakout patterns, such as ascending triangles, cup and handle formations, and flag patterns, can provide clues about when Bitcoin is likely to break out of its current range.
• Volume: Monitoring trading volume can help to confirm the validity of a breakout. A breakout accompanied by high volume is generally considered more reliable than a breakout accompanied by low volume.
• Momentum Indicators: Momentum indicators, such as the Relative Strength Index (RSI) and the Moving Average Convergence Divergence (MACD), can help to gauge the strength of a trend and identify potential overbought or oversold conditions.
• Support and Resistance Levels: Identifying key support and resistance levels can help to anticipate potential price movements and set appropriate entry and exit points.
Conclusion: Awaiting the Next Chapter in Bitcoin's Story
Bitcoin's recent period of consolidation has left investors and analysts eager to see what the future holds. While the price has stalled below $105,000, a confluence of factors, including predictive models, analyst forecasts, and bullish market sentiment, suggests that a significant surge could be on the horizon.
The potential for Bitcoin to reach new all-time highs, possibly soaring to between $275,000 and $300,000 by October of this year, is fueling excitement and speculation within the crypto community. Whether Bitcoin achieves these lofty targets remains to be seen, but the stage is set for what could be another exciting chapter in the cryptocurrency's story. As always, investors should conduct their own research, assess their risk tolerance, and make informed decisions before investing in Bitcoin or any other cryptocurrency. The journey ahead promises to be volatile, but the potential rewards could be substantial for those who are willing to navigate the risks.
Is XRP About to Rebound? Bullish Signals EmergeXRP Flashes Bullish Signal: Technical Indicator Hints at Imminent Rebound – 100x Gains Coming? The Future Is Closer Than You Think—Analyst
The cryptocurrency market is a volatile and often unpredictable space, where fortunes can be made and lost in the blink of an eye. Among the myriad of digital assets vying for attention, XRP, the cryptocurrency associated with Ripple Labs, has consistently been a topic of intense debate and speculation. While it has faced its fair share of challenges, including regulatory scrutiny and market fluctuations, XRP continues to hold the interest of investors and analysts alike.
Recently, XRP has been displaying what some experts are interpreting as bullish signals, suggesting a potential rebound in its price. These signals are primarily derived from technical analysis, a method of evaluating assets by analyzing statistical trends gathered from trading activity, such as price movement and volume. One particular technical indicator is hinting at an imminent upswing, leading some analysts to predict significant gains for XRP in the near future.
This article delves into the technical indicators flashing bullish signals for XRP, examines the factors that could contribute to a potential rebound, and explores the possibility of a 100x gain, a prospect that has captured the imagination of many XRP enthusiasts.
Technical Indicators Pointing Towards a Rebound
Technical analysis plays a crucial role in understanding potential price movements in the cryptocurrency market. Several indicators are currently suggesting a bullish outlook for XRP:
1. Moving Averages: Moving averages are commonly used to smooth out price data over a specific period, helping to identify trends. When a shorter-term moving average crosses above a longer-term moving average, it is often seen as a bullish signal, indicating that the price is likely to rise. XRP has recently exhibited this "golden cross" pattern on certain timeframes, suggesting a potential upward trend.
2. Relative Strength Index (RSI): The RSI is a momentum indicator that measures the magnitude of recent price changes to evaluate overbought or oversold conditions in the price of an asset. An RSI value below 30 typically indicates that an asset is oversold and may be due for a rebound. XRP's RSI has been hovering in oversold territory, suggesting that buying pressure could soon increase.
3. Fibonacci Retracement Levels: Fibonacci retracement levels are horizontal lines that indicate potential support and resistance levels based on the Fibonacci sequence. These levels are often used to predict where the price of an asset might find support during a downtrend or resistance during an uptrend. XRP has been testing key Fibonacci retracement levels, and a successful breakout above these levels could signal a significant price increase.
4. Chart Patterns: Technical analysts also look for specific chart patterns that can provide clues about future price movements. Some patterns, such as the "inverse head and shoulders" or the "double bottom," are considered bullish formations, suggesting that the price is likely to rise. XRP has been forming patterns that resemble these bullish formations, further supporting the possibility of a rebound.
Factors Contributing to a Potential XRP Rebound
While technical indicators can provide valuable insights, it is essential to consider the fundamental factors that could influence XRP's price. Several factors could contribute to a potential rebound:
1. Ripple's Ongoing Legal Battle with the SEC: The most significant factor weighing on XRP's price has been Ripple's legal battle with the U.S. Securities and Exchange Commission (SEC). The SEC alleges that Ripple sold XRP as an unregistered security, a claim that Ripple vehemently denies. A favorable outcome in this case could significantly boost XRP's price, as it would remove a major source of uncertainty and regulatory risk.
2. Growing Adoption of XRP for Cross-Border Payments: Ripple has been actively promoting XRP as a solution for cross-border payments, touting its speed, efficiency, and low cost compared to traditional methods. Increased adoption of XRP by financial institutions and payment providers could drive demand for the cryptocurrency, leading to a price increase.
3. Expansion of Ripple's Ecosystem: Ripple has been expanding its ecosystem by developing new products and services that utilize XRP. These include RippleNet, a network of financial institutions that use Ripple's technology for cross-border payments, and On-Demand Liquidity (ODL), a service that allows businesses to use XRP to source liquidity for cross-border transactions. A thriving ecosystem could attract more users and investors to XRP, further supporting its price.
4. Overall Cryptocurrency Market Sentiment: XRP's price is also influenced by the overall sentiment in the cryptocurrency market. A positive market sentiment, characterized by rising prices and increased investor confidence, could lift XRP along with other cryptocurrencies. Conversely, a negative market sentiment could put downward pressure on XRP's price.
The Possibility of a 100x Gain: A Realistic Scenario?
The prospect of a 100x gain in XRP's price has captured the imagination of many investors. While such a gain is certainly possible, it is essential to approach this scenario with a healthy dose of skepticism and realism.
To achieve a 100x gain, XRP's price would need to increase by a factor of 100 from its current level. This would require a massive influx of capital into XRP, driven by a combination of factors, such as a favorable outcome in the SEC case, widespread adoption of XRP for cross-border payments, and a significant increase in overall cryptocurrency market capitalization.
While these factors are not entirely out of the realm of possibility, they are by no means guaranteed. The cryptocurrency market is inherently unpredictable, and unforeseen events could derail any potential rally in XRP's price.
Analyst Perspective: The Future Is Closer Than You Think
Despite the inherent risks and uncertainties, some analysts remain optimistic about XRP's future. These analysts point to the potential for XRP to disrupt the traditional cross-border payments industry, the growing adoption of Ripple's technology, and the possibility of a favorable outcome in the SEC case as reasons for their bullish outlook.
One analyst, in particular, has stated that "the future is closer than you think" for XRP, suggesting that significant gains could be realized in the near future. This analyst believes that XRP is currently undervalued and that its price could surge once the regulatory uncertainty surrounding Ripple is resolved.
Conclusion: Navigating the XRP Landscape
XRP presents a complex and often contradictory picture. Technical indicators are flashing bullish signals, suggesting a potential rebound in its price. Factors such as Ripple's ongoing legal battle with the SEC, growing adoption of XRP for cross-border payments, and the overall cryptocurrency market sentiment could all play a role in determining XRP's future.
While the possibility of a 100x gain is enticing, it is essential to approach this scenario with caution and realism. The cryptocurrency market is inherently volatile, and unforeseen events could impact XRP's price.
Ultimately, whether XRP achieves its full potential remains to be seen. However, the recent bullish signals and the ongoing developments surrounding Ripple suggest that the future of XRP is closer than many might think. As always, investors should conduct their own research, assess their risk tolerance, and make informed decisions before investing in any cryptocurrency, including XRP.

XRP/USD – Bullish Reversal in Progress After Wave 5 Completion📊 XRP/USD – Bullish Reversal in Progress After Wave 5 Completion
Timeframe: 1H
Structure: Elliott Wave + Divergence + Break of Structure
Indicators Used: Awesome Oscillator (AO), Fibonacci Retracement, Market Structure
⸻
🧠 Wave Count & Structure Analysis
We’ve just completed a clean 5-wave Elliott impulsive structure to the downside:
• ✅ Wave 1–5 clearly marked with strong bearish momentum
• ✅ Wave (3) and Wave (5) show bullish divergence on the Awesome Oscillator (AO) – a classic sign of weakening bearish momentum and potential reversal
• ✅ Wave (5) completed at the bottom with confluence from price action and AO divergence
⸻
🔁 Break of Structure & Confirmation
• ✅ Break of structure (BoS) occurred at 2.35064, confirming the end of the bearish impulsive wave and the start of a potential ABC corrective phase
• ✅ The BoS also coincides with a dominant structure break, giving higher confidence in the trend shift
⸻
🟦 Current Price Action: ABC Corrective Wave Forming
We’re now in the early stages of a bullish corrective wave (ABC):
• 🔹 Wave A has likely completed
• 🔹 Currently expecting a retracement to form Wave B
• 🔹 Wave C target is projected based on Fibonacci extensions between 1.618 to 1.88, offering a high-probability take-profit zone (TP1)
⸻
🎯 Trade Setup
Pending Buy Entry:
• 📍 Entry Zone: Fibonacci retracement between 0.382 – 0.618 of Wave A
• 🎯 TP1: Fibonacci extension of Wave C between 1.618 – 1.88
• ❗ SL: Just below Wave (5) low or below 0.618 zone, depending on risk tolerance
⸻
🧩 Confluences for Bullish Setup
• ✅ Elliott Wave completion (Wave 5)
• ✅ Bullish Divergence on AO
• ✅ Break of Market Structure (BoS + Dominant BoS)
• ✅ Retracement into Fibonacci golden zone (0.382–0.618)
• ✅ Measured C wave extension to 1.618–1.88
⸻
📝 Summary
The market has shown strong technical signals for a bullish corrective move after a clean Elliott 5-wave completion. With a confirmed divergence, break of structure, and upcoming ABC retracement, this setup offers a solid risk-to-reward opportunity. Watching the buy zone closely for a pending long trigger.
⸻
🔔 Disclaimer:
This is not financial advice. Always conduct your own analysis and manage your risk accordingly.

Is the bottom in for Centrifuge?CFG broke out of what may have been its bottom, and it now looks like it is aiming for liquidity at $0.37.

OMI - go long with Coliseum Capital Management LLCOwens and Minor
we have some technical reasons here.
1. RSI divergence on the weekly chart: 2025 Februar and April made a doubla bottom formation, with higher RSI in April
2. $6.88 is a year S1 pivot level
3. At $14.1 is a gap wacthing us, promising a 100% upside potential
Fundamental reasons:
1. The whole healthcare sector is down because US government, can be a good contrarian play for 2025 or 2026
2. This spring, Coliseum Capital management bought around 4M Shares, and now holding 31% of the company.
The share price can decline further, breaking the $6.0 level for a short period of time. But it didn't happened in the April panic. $ 5.89 can be a good stop-loss level alltough if you can handle -18% loss.
But i'm waiting for upside momentum in OMI.

Understanding Williams %R In TradingThe Williams %R is a fast, sensitive momentum oscillator ideal for short-term trading strategies. It provides early signals of overbought and oversold conditions by comparing the current close to the high-low range over a defined lookback period (typically 14 bars).
By understanding where Williams %R fits among other oscillators, traders can better utilize it within a well-rounded, context-aware strategy.
✅ 1. What Are Momentum Indicators?
Momentum indicators are technical analysis tools used to measure the speed and strength of a price movement over time. Rather than focusing on absolute price direction, momentum indicators assess how quickly prices are changing and help traders identify potential turning points, continuation patterns, or overbought/oversold conditions.
They are particularly useful in sideways or ranging markets, where momentum shifts often precede breakouts or reversals.
Key characteristics of momentum indicators:
Often bounded within fixed ranges (e.g., 0–100 or -100 to 0)
Typically leading indicators, aiming to provide early entry/exit signals
Help spot divergence between price and momentum — a common sign of weakening trends
✅ 2. Understanding the Williams %R Indicator
≫ The Origin: Developed by Larry Williams
The Williams %R indicator was developed by Larry Williams, a renowned trader and author, in the late 1970s. Williams introduced this tool to identify potential market turning points by measuring a security’s momentum relative to its recent high-low range.
Originally intended for short-term futures trading, the indicator has since become a staple for both day traders and swing traders across various markets, including stocks, forex, and crypto.
Larry Williams famously used this indicator in his trading system when he won the 1987 World Cup Trading Championship, turning $10,000 into over $1 million in a single year—demonstrating its real-world impact when used effectively.
≫ Formula Breakdown
The Williams %R formula is as follows:
Williams %R= = (HighestHigh − Close) / (HighestHigh - LowerLow) × −100
Highest High = The highest price over the lookback period (typically 14 periods)
Lowest Low = The lowest price over the same lookback period
Close = The current closing price
This formula normalizes the current price within its recent trading range and expresses it as a negative percentage between 0 and -100.
Example:
If price is at the highest point in the range → %R = 0 (overbought)
If price is at the lowest point in the range → %R = -100 (oversold)
This inverted scale (compared to RSI) helps traders see how close the current price is to the top or bottom of the recent range, providing clues about potential reversal zones.
Williams %R in Pinescript:
//@version=5
indicator("Custom Williams %R", overlay=false)
length = input.int(14, title="Period")
highestHigh = ta.highest(high, length)
lowestLow = ta.lowest(low, length)
williamsR = (highestHigh - close) / (highestHigh - lowestLow) \* -100
plot(williamsR, title="%R", color=color.purple)
hline(-20, "Overbought", color=color.red)
hline(-80, "Oversold", color=color.green)
≫ Key Settings: 14-Period Default and Customizations
The default setting for Williams %R is 14 periods, which Larry Williams originally recommended. However, this lookback period can be customized based on your trading style and timeframe.
Here’s how different settings can be applied:
❖ Intraday Trading (5-minute to 15-minute charts):
Use a 9 to 14-period setting for faster, more responsive signals.
Ideal for scalpers or short-term traders seeking quick entries and exits.
❖ Swing Trading (1-hour to Daily charts):
Stick with the standard 14 to 21-period range.
Balances sensitivity and reliability; helps capture short- to mid-term reversals.
❖ Position/Long-Term Trading (Weekly charts or higher):
Use 21-period or longer to smooth out signals and reduce noise.
Best for spotting high-conviction turning points with less frequent trades.
🔁 Customization Tip:
You can also use multiple %R settings (e.g., 14 and 50) together to analyze short-term momentum inside longer-term trend cycles, adding depth and context to your strategy.
≫ Interpretation: Overbought and Oversold Conditions
The Williams %R scale ranges from 0 to -100 and is interpreted as follows:
❖ Overbought: %R above -20
Indicates that price is near the top of its recent range
Suggests potential for a pullback or reversal downward
❖ Oversold: %R below -80
Indicates price is near the bottom of its recent range
Suggests potential for a bounce or reversal upward
⚠️ Important: Overbought does not mean “time to sell” and oversold does not mean “time to buy.” These are conditions, not signals. Use them with confirmation tools like support/resistance zones, candlestick patterns, volume analysis, divergences and more.
✅ 3. Using Williams %R Effectively
≫ Entry Signals
Williams %R can be used to time entries based on shifts in momentum, especially around key overbought and oversold zones.
❖ Overbought/Oversold Reversals
This is the most common use of Williams %R - identifying turning points when price reaches extreme levels in its recent range:
Overbought Zone (above -20):
Signals potential bearish reversal
Look for confluence with resistance levels or bearish candlestick patterns
Confirmation often comes as %R drops back below -20
Oversold Zone (below -80):
Indicates a possible bullish reversal
Stronger when aligned with support or demand zones
Confirmation often comes when %R climbs back above -80
⚠️ Note: These are signals of potential exhaustion, not guaranteed reversals. Always pair with price action context or volume.
❖ Pullback Continuations
Williams %R can also support trend-following strategies by identifying momentum retracements within an ongoing trend:
In an uptrend, wait for Williams %R to dip below -80 (short-term oversold) and then re-enter above -80 as the trend resumes
In a downtrend, look for a rally where %R rises above -20 (short-term overbought), then re-enters below -20 to confirm trend continuation
This technique helps you buy the dip or sell the rally with better timing and risk control.
≫ Exit Signals
Williams %R can also guide exit timing by showing when momentum is weakening, especially as price moves away from extremes.
❖ Returning to Neutral Zones
When Williams %R moves back toward the -50 midpoint, it can signal that the current move is losing steam.
In a long position, if %R returns from oversold to above -50 but then flattens or dips again, it may be time to take profit
In a short position, if %R rises from overbought back below -50, it suggests selling pressure is decreasing
Exiting before full reversals can help you lock in gains while reducing risk exposure.
❖ Crossovers at Extremes
Some traders look for quick crossovers back through key thresholds (-80 and -20) as exit or reversal alerts:
If %R drops from above -20 back below it, the overbought condition may be ending
If %R rises from below -80 back above it, the oversold condition may be ending
These sharp shifts often precede momentum flips, making them useful for both exit timing and new trade setups in the opposite direction.
❖ False Signal Filtering Techniques
Williams %R can produce false signals, especially in trending or volatile markets. To improve signal quality, consider these filters:
Use with Trend Filters:
Apply moving averages (e.g., 50- or 200-period MA) to define trend direction and avoid counter-trend trades
Only trade overbought signals in a downtrend and oversold signals in an uptrend
Add Price Action Confirmation: Look for candlestick patterns (e.g., engulfing, pin bars) or support/resistance reactions before acting on %R signals
Volume Analysis: Confirm signals with volume spikes or divergences to validate strength or weakness in a move
Multiple Timeframe Confluence: Use Williams %R on a higher timeframe (e.g., 4H or daily) to establish the broader context, then align trades on a lower timeframe
Avoid during High Volatility Events: News releases and earnings reports can create erratic spikes that cause misleading %R readings
❖ Best Market Conditions: Ranging vs Trending Markets
Williams %R performs best under specific market conditions. Understanding when to use it—and when to avoid it—is key to success.
Ranging Markets: Ideal Conditions
Williams %R excels in sideways or consolidating markets
In ranges, price frequently oscillates between support and resistance, making overbought/oversold signals highly effective
Reversals from the -20 or -80 zones often align with the top and bottom of a trading range
Trending Markets: Use With Caution
During strong trends, Williams %R can stay in the overbought or oversold zone for extended periods
This makes reversal signals less reliable and more prone to false exits
In trending conditions, it’s better to:
Use Williams %R for pullback entries
Combine it with a trend filter to stay on the dominant side of momentum
✅ 4. Optimizing the Period Setting (5, 9, 14, 21, etc.)
The length of the lookback period in Williams %R significantly affects signal behavior:
Shorter periods (5, 9):
Produce faster, more frequent signals
Best for scalping and intraday trading
More sensitive but can result in higher noise and false signals
Default period (14):
Balanced responsiveness
Suitable for swing trading and multi-hour charting
Longer periods (21+):
Generate fewer but more stable signals
Best for position trading or slower-moving markets
Reduced noise but may lag in volatile conditions
🔍 To optimize:
Test various period values under consistent rules (e.g., entry/exit and risk management stay the same)
Compare outcomes across different market environments (trending, ranging, volatile)
✅ 4. Key Takeaways
Williams %R is a momentum oscillator that measures the close relative to the recent high-low range on a scale from 0 to -100.
It was developed by Larry Williams to help identify short-term overbought and oversold market conditions.
A reading above -20 suggests overbought conditions, while a reading below -80 indicates oversold conditions.
The default 14-period setting balances signal responsiveness and stability for most traders.
Shorter periods generate faster signals with more noise, while longer periods produce smoother signals with more lag.
Williams %R works best in ranging or sideways markets rather than strongly trending environments.
Traders can use %R for reversal signals or to confirm pullbacks within a broader trend.
Filtering signals with price action, support/resistance, or volume improves accuracy.
The indicator is not meant to be used in isolation and requires confirmation before acting on signals.
Backtesting across different timeframes and period settings is essential for identifying optimal usage.
Performance metrics such as win rate, R:R ratio, and drawdown help evaluate the indicator’s reliability.
Williams %R is easy to code and automate in platforms like TradingView using Pine Script.
The indicator adds value when used as part of a broader, disciplined trading system.
Williams %R is a simple yet deeply insightful momentum oscillator. While often overlooked in favor of more complex indicators, it provides a unique lens into market sentiment and price extremes. Its greatest strength lies in its clarity — helping traders time entries and exits with greater confidence when paired with context.

XAUUSD M15 Analysis – Wave 3 in Progress with Momentum Sell Conf🔍 Technical Breakdown:
The M15 chart has completed a 5-wave impulsive decline, followed by a clear ABC corrective structure.
Price has now broken below the (B) wave low, suggesting the beginning of Wave 3 to the downside.
A bearish sell zone is identified between 3208 – 3215, which aligns with previous structure and Fibonacci retracement levels.
The Awesome Oscillator (AO) has printed a fresh red histogram bar, confirming a momentum sell signal—perfect timing for Wave 3 initiation.
🎯 Trade Setup:
Sell Limit Zone: 3208 – 3215 (shaded red area)
Stop Loss: Just above Wave (C) high or around 3218
Take Profit Zone: Targeting the 1.618 Fibonacci extension (~3180 area)
📌 Confluence Factors:
Elliott Wave structure supports the Wave 3 sell.
AO confirms bearish momentum returning after correction.
Strong rejection expected from previous structure zone (supply area).
⚠️ Risk Note:
Wave 3 often brings strong movement—stay disciplined with stop placement and position sizing.
💬 This setup is clean and supported by momentum tools—wait for a pullback into the zone and let price action confirm before entering.

BITCOIN MIGHT SEE $160KWe have a vey similar movement for bitcoin compare to few months ago
1) Pass the 20MA on weekly
2) Bullish cross on MACD
3) Cross and stay above the weekly resistance ( yellow trendline )
4) +60% upside movement
Im not saying 60% raise is coming to bitcoin ( may be come ), but at least $134k - $140k is very likely IMO

GBP/USD: Bull Flag Watch as Momentum Builds for Topside BreakGBP/USD traders should be on alert for a potential topside break, with price action resembling a bull flag formation.
Downtrend resistance comes in near 1.3340 today—a key level to watch for those considering bullish setups.
A break above that trendline would shift focus to the April 29 high at 1.3444. If cleared, there's not much standing in the way until 1.3644.
Momentum signals are also starting to turn more constructive, with the 14-day RSI breaking its recent downtrend and MACD curling back towards the signal line above zero. Taken together, the setup favours buying dips and trading in line with any upside break.
Good luck!
DS

EURJPY H1 Analysis – Wave 4 Retracement in Play🕐 Timeframe: 1H
📅 Updated: 17 May 2025
📌 Pair: EURJPY
⸻
🔍 Technical Outlook:
• Price is in a clear bearish trend, respecting lower highs and lower lows.
• Awesome Oscillator (AO) shows bearish convergence — momentum is weakening but still bearish overall.
• Price retraced to the 2.618–2.786 extension zone (162.902–162.982), a common wave 4 reaction level.
• This zone may act as a rejection area, setting up for the start of wave 5.
⸻
🔧 Elliott Wave Structure:
• ✅ Wave 1–3: Completed with strong bearish momentum.
• 🟡 Wave 4: Likely completed at 162.982 or may slightly extend, but momentum is fading.
• 🔴 Wave 5: Expected next move — continuation to the downside.
⸻
📍 Key Levels:
• 🔺 Wave 4 Resistance Zone: 162.902–162.982
• 🔻 Potential Wave 5 Target:
• 🎯 TP1: 162.000
• 🎯 TP2: 161.835 (Fib 4.236 extension)
• 🎯 TP3 (Extension): 161.50 or lower if selling accelerates
⸻
🧠 Strategy:
1. Monitor price action at 162.982 — if rejected, likely wave 4 completed.
2. Look for bearish engulfing / momentum candles for entry signal.
3. Short Setup Idea:
• Entry: Below 162.88–162.90 after confirmation
• SL: Above wave 4 high (163.12 or tighter at 163.00)
• TP: 100+ pip potential — trailing to lock profit
⸻
✅ Summary:
• AO confirms bearish convergence → weak momentum
• Price hit Fib confluence zone → wave 4 likely done
• Wave 5 could give 100+ pips to the downside
• Wait for confirmation, then short the breakdown

USDJPY to continue uptrendUSDJPY is forming has broken out of the downward channel and formed a new upward channel/trend. Expect a break of the trendline around 145.850 and continue upward from area
of support to resistance zone/are of interest at 150.734. This resistance area extends all the way back to 10/2023 and appears quite strong. The 1h chart is also showing a potential crossover of the RSI/RSI EMA. The ADX is falling, the DMI is divergent. The MACD is divergent and downward momentum is slowing.
15/5/2025 0226 PDT

EUR/USD – Bullish Wave 3 in Play | AO Convergence + Fib Target PPair: EUR/USD
Timeframe: 15-Minute
Date: May 15, 2025
🧠 Technical Breakdown:
This analysis focuses on a clean impulsive Elliott Wave structure, Fibonacci projections, and Awesome Oscillator (AO) confirmation to support a bullish continuation.
🔍 Wave Count:
Wave 1: Clear impulsive push upwards, breaking previous market structure.
Wave 2: Completed corrective pullback into the key support zone, respecting the golden ratio levels.
Wave 3: Initiated after a dominant break above the minor structure and trendline resistance, confirming bullish momentum.
⚙️ AO (Awesome Oscillator) Confirmation:
Strong AO divergence between the Wave 1 and Wave 2 low confirms the bullish structure.
Within the early stage of Wave 3, the AO shows a convergence pattern forming between subwaves 1, 2, and 3 — indicating strengthening bullish momentum.
AO flipped green again after a minor pullback, signaling bullish continuation potential.
🎯 Fibonacci Extensions:
TP1 Zone: 1.618 – 1.88 Fibonacci extension range → 1.1216 – 1.1226
(High probability for Wave 3 termination)
TP2 Zone: 2.618 – 2.88 Fibonacci extension range → 1.1241 – 1.1258
(Extended target if bullish momentum accelerates)
Further projections (Wave 5 estimate):
4.236 – 4.618 → 1.1276 – 1.1288
🧱 Key Structural Zone:
1.11813 is the most critical support-turned-resistance (SNR) level — price broke above this level, retested, and bounced.
The green highlighted box marks the ideal buy zone, aligned with:
Dominant break confirmation
Fibonacci confluence
Bullish AO setup
✅ Trade Plan:
Entry: On retest or bounce from the green zone
Stop Loss: Below 1.11800 or below Wave 2 low (to protect structure)
Take Profit 1: 1.1216 – 1.1226
Take Profit 2: 1.1241 – 1.1258
Optional TP3 (extended): 1.1276 – 1.1288 (Wave 5 projection)
🧭 Summary:
This setup combines Elliott Wave theory, Fibonacci projections, and AO convergence to provide a highly probable bullish continuation scenario. Ideal for breakout traders and structure-based wave analysts.
📌 “Confluence is key. Let structure, momentum, and fibs guide the trade.”
#EURUSD #ElliottWave #Wave3 #AOIndicator #ForexAnalysis #Fibonacci #PriceAction #FXTrading #StructureBreak #TechnicalAnalysis
