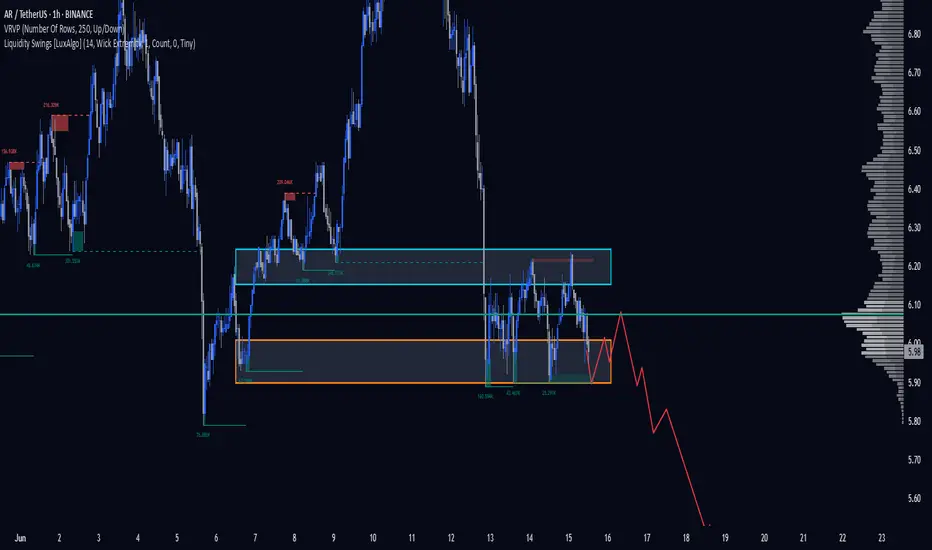
AR 1H. $5.90 Is the Last Line of Defense. 06/15/25BINANCE:ARUSDT If we fail to hold the $5.90 level, this asset could crash hard — potentially entering a deeper downtrend.
DYOR.
M-signal
PTON Peloton Potential Buyout Interest from Amazon or NikeIf you haven`t bought the dip on PTON, before the rally:
Now Peloton Interactive PTON remains a compelling bullish candidate in 2025, supported not only by strategic buyout interest from major players like Amazon and Nike but also by significant unusual options activity signaling strong investor conviction in a near-term upside move. These factors combined create a powerful catalyst for a potential stock rally.
1. Confirmed Buyout Interest from Amazon and Nike
Since 2022, credible reports have indicated that Amazon and Nike are exploring acquisition opportunities for Peloton, recognizing its value as a leading connected fitness platform with over 2 million subscribers.
Amazon’s interest fits its broader health and smart home ambitions, while Nike sees Peloton as a strategic extension of its digital fitness ecosystem.
Such buyout interest implies a potential premium valuation, which could trigger a sharp upward re-rating of Peloton’s shares if a deal materializes or even if speculation intensifies.
2. Massive Unusual Call Option Activity for July 18, 2025 Expiry
A mystery trader recently purchased over 80,000 call options on Peloton with a $7 strike price expiring July 18, 2025, representing a $3.1 million bet on a price rise within the next few months.
On May 20, 2025, over 90,000 contracts of the $7 strike call expiring July 18, 2025 traded, equating to roughly 9 million underlying shares—well above Peloton’s average daily volume.
This unusually high call volume signals strong bullish sentiment and possible insider or institutional anticipation of a positive event, such as a buyout announcement or operational turnaround.
3. Strategic Fit and Synergies for Acquirers
Peloton’s subscription-based connected fitness platform offers Amazon and Nike a valuable recurring revenue stream and engaged user base.
Amazon could integrate Peloton’s offerings into its ecosystem of devices, health services, and e-commerce, while Nike could leverage Peloton’s content and hardware to deepen its digital fitness presence.
The potential for cross-selling, brand synergy, and data monetization enhances Peloton’s attractiveness as an acquisition target.
4. Attractive Valuation and Growth Potential
Peloton’s market cap has contracted significantly, making it an affordable target for large corporations with strategic interests in health and fitness.
Recent product launches, cost-cutting measures, and renewed marketing efforts aim to stabilize and grow Peloton’s subscriber base and revenue.
The connected fitness market continues to expand, driven by consumer demand for at-home and hybrid workout solutions.
5. Technical and Sentiment Indicators
The stock has shown signs of stabilizing after recent volatility, with support forming near $6–$6.50.
The surge in call options activity, especially at strikes above current prices, suggests growing investor confidence in a near-term breakout.
Historical patterns show Peloton’s stock reacts strongly to buyout rumors and unusual options volume, often resulting in rapid price appreciation.
Disclosure: I am part of Trade Nation's Influencer program and receive a monthly fee for using their TradingView charts in my analysis.

APPLE: Long Signal with Entry/SL/TP
APPLE
- Classic bullish pattern
- Our team expects retracement
SUGGESTED TRADE:
Swing Trade
Buy APPLE
Entry - 196.46
Stop - 192.63
Take - 203.97
Our Risk - 1%
Start protection of your profits from lower levels
Disclosure: I am part of Trade Nation's Influencer program and receive a monthly fee for using their TradingView charts in my analysis.
❤️ Please, support our work with like & comment! ❤️

USDCHF: Bullish Continuation & Long Signal
USDCHF
- Classic bullish setup
- Our team expects bullish continuation
SUGGESTED TRADE:
Swing Trade
Long USDCHF
Entry Point - 0.8113
Stop Loss - 0.8074
Take Profit - 0.8182
Our Risk - 1%
Start protection of your profits from lower levels
Disclosure: I am part of Trade Nation's Influencer program and receive a monthly fee for using their TradingView charts in my analysis.
❤️ Please, support our work with like & comment! ❤️

SILVER Buyers In Panic! SELL!
My dear friends,
My technical analysis for SILVER is below:
The market is trading on 36.320 pivot level.
Bias - Bearish
Technical Indicators: Both Super Trend & Pivot HL indicate a highly probable Bearish continuation.
Target - 35.168
Recommended Stop Loss - 36.830
About Used Indicators:
A pivot point is a technical analysis indicator, or calculations, used to determine the overall trend of the market over different time frames.
Disclosure: I am part of Trade Nation's Influencer program and receive a monthly fee for using their TradingView charts in my analysis.
———————————
WISH YOU ALL LUCK

Bullish Thesis: Why Oscar Health OSCR Could Rally Strong in 2025Oscar Health, OSCR, a technology-driven health insurance company, is positioned for a significant stock price appreciation in 2025. Despite some mixed short-term sentiment, the long-term outlook and recent analyst forecasts suggest a potential rally that could more than double the current share price. Here’s why OSCR could be a compelling bullish opportunity this year:
1. Strong Analyst Price Targets Indicate Upside of Over 125%
According to recent forecasts, OSCR is expected to reach an average price of $31.40 in 2025, with some analysts projecting highs as much as $41.31—a potential upside exceeding 125% from the current price near $13.95.
Monthly forecasts show a steady upward trajectory, with July 2025 targets around $37.24 and December 2025 targets near $34.67, highlighting sustained bullish momentum throughout the year.
The average 12-month price target is around $34.40, representing a 146% upside, signaling strong confidence in OSCR’s growth prospects.
2. Innovative Business Model and Growth Potential
Oscar Health leverages technology and data analytics to offer user-friendly, transparent health insurance plans, differentiating itself in a traditionally complex industry.
Its focus on member engagement, telemedicine, and cost-effective care management positions it well to capture market share as healthcare consumers increasingly demand digital-first solutions.
The company’s expanding footprint in both individual and Medicare Advantage markets provides multiple growth avenues.
3. Long-Term Vision and Market Opportunity
Beyond 2025, forecasts remain highly bullish, with OSCR projected to reach $53.77 by 2027 and nearly $100 by 2030, reflecting strong secular growth potential in the health insurance and digital health sectors.
Analysts see Oscar as a disruptive force with the potential to reshape healthcare delivery, driving substantial long-term shareholder value.
4. Improving Financial Metrics and Operational Execution
Oscar has been improving its loss ratios and operating efficiencies, which are critical for sustainable profitability.
The company’s investments in technology infrastructure and data-driven care management are expected to translate into better margins and revenue growth over time.
5. Market Sentiment and Analyst Ratings
While some platforms show mixed short-term sentiment, the dominant analyst consensus is a "Buy" or "Moderate Buy," supported by strong price targets and growth forecasts.
The stock’s current undervaluation relative to its growth potential creates a favorable risk-reward profile for investors.

EURUSD: Bearish Continuation is Highly Probable! Here is Why:
Remember that we can not, and should not impose our will on the market but rather listen to its whims and make profit by following it. And thus shall be done today on the EURUSD pair which is likely to be pushed down by the bears so we will sell!
Disclosure: I am part of Trade Nation's Influencer program and receive a monthly fee for using their TradingView charts in my analysis.
❤️ Please, support our work with like & comment! ❤️

Every breakdown is just a setup — if you know where the reaccumuPrice collapsed. But I didn’t flinch. Because beneath that move sits something most won’t look for: High-Volume Rebalancing (H RB), paired with a clean FVG structure that tells me exactly where Smart Money wants to reload.
The structure:
The breakdown into ~2483 wasn’t just a move — it was intentional. That candle didn’t just fall, it delivered into the H RB zone and paused. Below that? Nothing but inefficient space and a tightly engineered low.
Above? Three clear target zones:
TP1: 2528
TP2 : 2582
TP3: 2656
Final objective: 2762 — the origin of the final collapse
Every leg above is engineered to grab liquidity, rebalance inefficiency, and then clear out the next range. It’s a chain of fulfillment.
The trade:
Entry: 2483–2500 zone
SL: Below the H RB zone (~2470)
TP1: 2528
TP2: 2582
TP3: 2656
Optional extension: 2762
We aren’t buying because it’s “down.” We’re executing because it’s deliberate.
Final thought:
“Collapse isn’t the end. It’s the invitation.”

EURUSD Buyers In Panic! SELL!
My dear subscribers,
EURUSD looks like it will make a good move, and here are the details:
The market is trading on 1.1441 pivot level.
Bias - Bearish
Technical Indicators: Both Super Trend & Pivot HL indicate a highly probable Bearish continuation.
Target - 1.1424
About Used Indicators:
The average true range (ATR) plays an important role in 'Supertrend' as the indicator uses ATR to calculate its value. The ATR indicator signals the degree of price volatility.
Disclosure: I am part of Trade Nation's Influencer program and receive a monthly fee for using their TradingView charts in my analysis.
———————————
WISH YOU ALL LUCK

GOLD Trading Opportunity! SELL!
My dear followers,
I analysed this chart on GOLD and concluded the following:
The market is trading on 3440.7 pivot level.
Bias - Bearish
Technical Indicators: Both Super Trend & Pivot HL indicate a highly probable Bearish continuation.
Target - 3424.3
Safe Stop Loss - 3450.7
About Used Indicators:
A super-trend indicator is plotted on either above or below the closing price to signal a buy or sell. The indicator changes color, based on whether or not you should be buying. If the super-trend indicator moves below the closing price, the indicator turns green, and it signals an entry point or points to buy.
Disclosure: I am part of Trade Nation's Influencer program and receive a monthly fee for using their TradingView charts in my analysis.
———————————
WISH YOU ALL LUCK

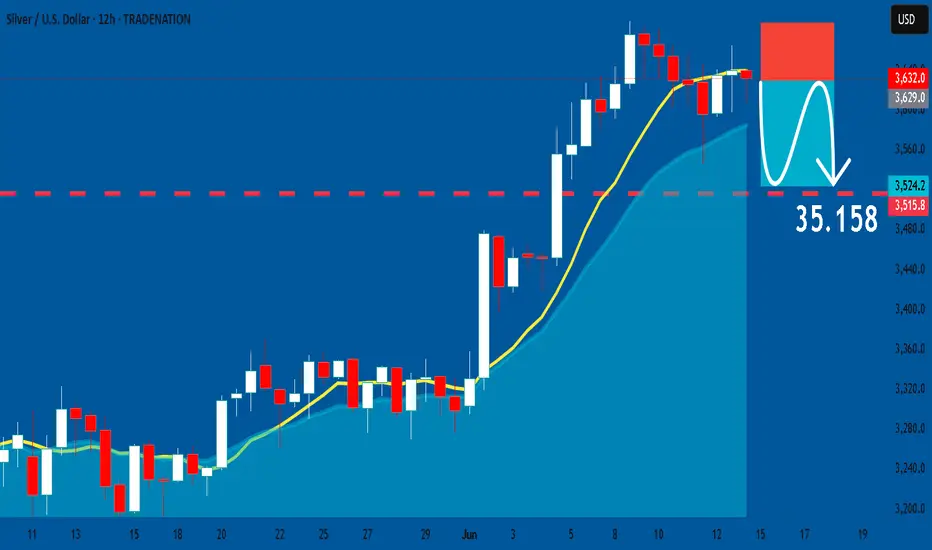
SILVER: Short Trade Explained
SILVER
- Classic bearish setup
- Our team expects bearish continuation
SUGGESTED TRADE:
Swing Trade
Short SILVER
Entry Point - 36.320
Stop Loss - 36.874
Take Profit - 35.158
Our Risk - 1%
Start protection of your profits from lower levels
Disclosure: I am part of Trade Nation's Influencer program and receive a monthly fee for using their TradingView charts in my analysis.
❤️ Please, support our work with like & comment! ❤️
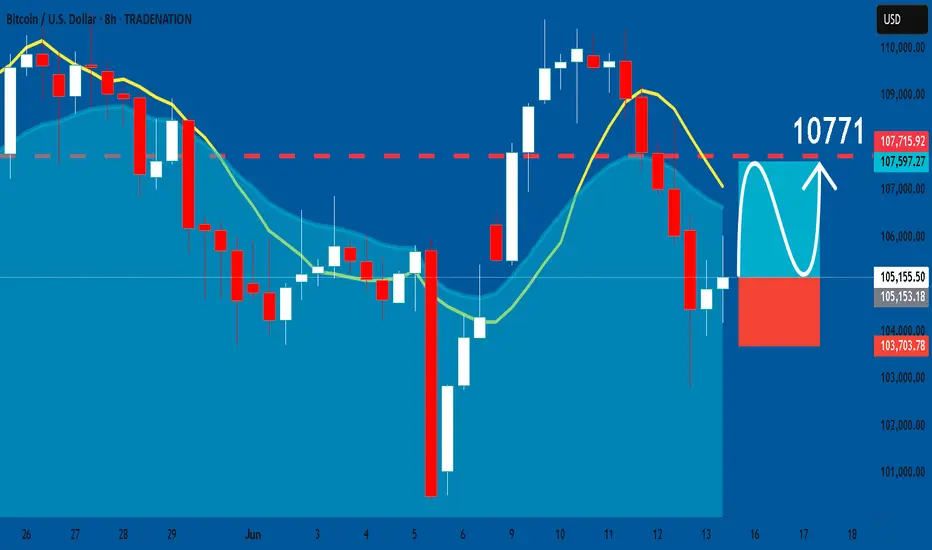
BTCUSD: Long Trading Opportunity
BTCUSD
- Classic bullish formation
- Our team expects growth
SUGGESTED TRADE:
Swing Trade
Buy BTCUSD
Entry Level - 10515
Sl - 10370
Tp - 10771
Our Risk - 1%
Start protection of your profits from lower levels
Disclosure: I am part of Trade Nation's Influencer program and receive a monthly fee for using their TradingView charts in my analysis.
❤️ Please, support our work with like & comment! ❤️
GBPCAD What Next? BUY!
My dear subscribers,
GBPCAD looks like it will make a good move, and here are the details:
The market is trading on 1.8440 pivot level.
Bias - Bullish
Technical Indicators: Both Super Trend & Pivot HL indicate a highly probable Bullish continuation.
Target - 1.8496
About Used Indicators:
The average true range (ATR) plays an important role in 'Supertrend' as the indicator uses ATR to calculate its value. The ATR indicator signals the degree of price volatility.
Disclosure: I am part of Trade Nation's Influencer program and receive a monthly fee for using their TradingView charts in my analysis.
———————————
WISH YOU ALL LUCK

NATGAS Technical Analysis! SELL!
My dear followers,
This is my opinion on the NATGAS next move:
The asset is approaching an important pivot point 3.610
Bias - Bearish
Technical Indicators: Supper Trend generates a clear short signal while Pivot Point HL is currently determining the overall Bearish trend of the market.
Goal - 3.558
About Used Indicators:
For more efficient signals, super-trend is used in combination with other indicators like Pivot Points.
Disclosure: I am part of Trade Nation's Influencer program and receive a monthly fee for using their TradingView charts in my analysis.
———————————
WISH YOU ALL LUCK

GOLD Sellers In Panic! BUY!
My dear friends,
My technical analysis for GOLD is below:
The market is trading on 3330.6 pivot level.
Bias - Bullish
Technical Indicators: Both Super Trend & Pivot HL indicate a highly probable Bullish continuation.
Target - 3338.3
Recommended Stop Loss - 3326.5
About Used Indicators:
A pivot point is a technical analysis indicator, or calculations, used to determine the overall trend of the market over different time frames.
Disclosure: I am part of Trade Nation's Influencer program and receive a monthly fee for using their TradingView charts in my analysis.
———————————
WISH YOU ALL LUCK

EURUSD Set To Fall! SELL!
My dear friends,
EURUSD looks like it will make a good move, and here are the details:
The market is trading on 1.1596 pivot level.
Bias - Bearish
Technical Indicators: Supper Trend generates a clear short signal while Pivot Point HL is currently determining the overall Bearish trend of the market.
Goal - 1.1533
About Used Indicators:
Pivot points are a great way to identify areas of support and resistance, but they work best when combined with other kinds of technical analysis
Disclosure: I am part of Trade Nation's Influencer program and receive a monthly fee for using their TradingView charts in my analysis.
———————————
WISH YOU ALL LUCK

Price collapsed. I didn’t flinch. Here’s whyThat wick didn’t scare me — it confirmed the setup. Volume spiked, price swept an equal low, and printed the reaction I was waiting for.
The logic:
Clean FVG formed on the drop
Price returned to rebalance
Reaction from that FVG confirms Smart Money intent
It’s not about chasing the reversal — it’s about understanding the anatomy of one. And that’s exactly what just unfolded here.
Below price? An untouched EQ level. Above? A full inefficiency gap into 0.99. That’s the delivery map.
Trade framework:
Re-entry: Into the FVG zone (~0.825–0.807)
SL: Below EQ (~0.79)
TP1: 0.91 POC sweep
Final objective: Full push into 0.99
This isn't hype. This is precision. You don't need magic indicators when price gives you the story in volume and imbalance.
Final words:
“I don’t chase the move. I identify where it started — and wait for it to return.”

You were warned. Now it’s runningThis was the second test into the FVG + 4H OB confluence. High volume candle. Wicking liquidity. And structure still intact.
Why I stayed calm:
Price didn't just drop — it delivered into a known rebalance zone. That 0.176–0.178 box was a magnet, not a mystery.
The reaction came right on cue:
Volume confirmed interest
Structure stayed intact
And the engine kicked in right after the sweep
Now? The play isn’t about guessing the top. It’s about knowing where price is drawn — and why.
Play-by-play logic:
4H OB provided the base
FVG gave the imbalance
Reaction zone created a clean entry
TP target? +18% mapped to 0.21
I didn’t enter on emotion. I positioned based on structure. That’s why it’s already moving while others still think it needs “confirmation.”
Final words:
“You don’t need hindsight when your foresight is built on logic.”

Price returned. I was already waitingThis wasn’t a pullback — it was a reset. And Smart Money doesn’t chase price. It sets traps. This is one of them.
Breakdown:
SOL delivered into a confluence zone where multiple models align:
Daily FVG overlaps perfectly with a 4H Order Block
0.5 fib retracement (141.82) tagging the midpoint of the prior expansion leg
Volatility spike? Engineered. Not reactive.
Retail is shaken. I’m composed. This is the zone you mark before price even gets there — because when it does, you don’t hesitate.
Trade logic:
Entry: 141.8–146.0 (inside D FVG + 4H OB)
SL: Below the 0.618 fib / 130.8 invalidation
TP1: 152.8 (0.382)
TP2: 166.4 (0.236)
Final draw: 188.4 — full inefficiency fill and premium rebalance
This isn’t about hitting every level. It’s about understanding why these levels matter. Structure tells the story. The fib just refines the sentence.
Final words:
“Smart Money doesn’t trade the reaction. It trades the setup that creates it.”

GBPCHF: Long Trade Explained
GBPCHF
- Classic bullish formation
- Our team expects pullback
SUGGESTED TRADE:
Swing Trade
Long GBPCHF
Entry - 1.1005
Sl - 1.0971
Tp - 1.1064
Our Risk - 1%
Start protection of your profits from lower levels
Disclosure: I am part of Trade Nation's Influencer program and receive a monthly fee for using their TradingView charts in my analysis.
❤️ Please, support our work with like & comment! ❤️

Dollar Week Review and thoughtsMy General thoughts on dollar and keeping my bearish bias going forward into next week.
Still bullish silver gold cable fibre and looking to see what happens with aussie to get in again
Have a good weekend!!

NZDJPY Set To Grow! BUY!
My dear friends,
Please, find my technical outlook for NZDJPY below:
The instrument tests an important psychological level 86.740
Bias - Bullish
Technical Indicators: Supper Trend gives a precise Bullish signal, while Pivot Point HL predicts price changes and potential reversals in the market.
Target - 87.156
About Used Indicators:
Super-trend indicator is more useful in trending markets where there are clear uptrends and downtrends in price.
Disclosure: I am part of Trade Nation's Influencer program and receive a monthly fee for using their TradingView charts in my analysis.
———————————
WISH YOU ALL LUCK

CADJPY A Fall Expected! SELL!
My dear subscribers,
My technical analysis for CADJPY is below:
The price is coiling around a solid key level - 105.97
Bias - Bearish
Technical Indicators: Pivot Points Low anticipates a potential price reversal.
Super trend shows a clear sell, giving a perfect indicators' convergence.
Goal - 105.56
About Used Indicators:
By the very nature of the supertrend indicator, it offers firm support and resistance levels for traders to enter and exit trades. Additionally, it also provides signals for setting stop losses
Disclosure: I am part of Trade Nation's Influencer program and receive a monthly fee for using their TradingView charts in my analysis.
———————————
WISH YOU ALL LUCK
