GOLD to 3255Based on my medium-term analysis and accurate signals from my personalized indicator, I expect gold to continue its downtrend this week.
M-signal

MOONPIG Is Taking Off — Thanks to James Wynn’s Viral CloutThe James Wynn Phenomenon:
James Wynn, a crypto trader who turned $4 million into $100 million before losing nearly all of it in leveraged Bitcoin futures, has become a polarizing figure in the crypto space. His massive trades, including a $1.2 billion Bitcoin long position that ended in a $17.5 million loss and a subsequent $1 billion short position with 40x leverage, have made him a viral sensation. Despite these setbacks, Wynn’s resilience and bold moves keep him in the spotlight, with thousands of traders and investors following his every step.
Wynn’s fame stems not just from his trading but from his ability to move markets. His posts on X, where he boasts a significant following, often trigger rapid price movements in the assets he mentions. This influence is now centered on $MOONPIG, a Solana-based meme coin that’s gaining traction thanks to his vocal support.
$MOONPIG: A Meme Coin with Momentum:
$MOONPIG, a meme coin built on the Solana blockchain, has seen its price surge by as much as 80% following Wynn’s endorsements, though it’s also faced volatility with a 30% drop in 24 hours and a 60% decline from its all-time high. Despite these fluctuations, the coin’s community-driven narrative and Wynn’s backing make it a compelling speculative play.
Wynn’s posts on X reveal his belief in $MOONPIG’s potential to be the “next SafeMoon” of this cycle, predicting a run to a billion-dollar market cap. He’s emphasized its appeal to retail investors, calling it “normie-friendly” and highlighting its strong community as a key driver. This narrative aligns with the meme coin mania that often propels tokens like CRYPTOCAP:DOGE or CRYPTOCAP:SHIB to explosive gains during bullish market phases.
Why I’m Bullish:
Wynn’s Influence as a Catalyst: Wynn’s fame amplifies $MOONPIG’s visibility. His posts on X, such as one claiming he transferred profits to the $MOONPIG reserves wallet, signal commitment and attract attention. When Wynn speaks, traders listen, and his endorsements have already driven significant price action, with one instance sparking an 80% surge.
Community Strength: Wynn has emphasized $MOONPIG’s community-driven ethos, stating it “doesn’t need KOLs or BS” and thrives on organic support. In the meme coin space, strong communities can sustain momentum, as seen with tokens like CRYPTOCAP:PEPE , which Wynn also supports.
Market Timing: With Bitcoin hitting new highs and retail interest flooding back into crypto, $MOONPIG is well-positioned to ride the wave. Wynn’s thesis that retail investors will soon pour into altcoins aligns with current market sentiment, making $MOONPIG a potential beneficiary.
Speculative Upside: Meme coins thrive on hype, and $MOONPIG’s low market cap relative to its potential—analysts like @KookCapitalLLC
speculate a $1 billion valuation—offers significant upside for early investors. Even after recent pullbacks, the coin’s volatility suggests opportunities for traders who can stomach the risk.

BTCUSD: Bullish Continuation & Long Trade
BTCUSD
- Classic bullish setup
- Our team expects bullish continuation
SUGGESTED TRADE:
Swing Trade
Long BTCUSD
Entry Point - 10465
Stop Loss - 10321
Take Profit - 10794
Our Risk - 1%
Start protection of your profits from lower levels
Disclosure: I am part of Trade Nation's Influencer program and receive a monthly fee for using their TradingView charts in my analysis.
❤️ Please, support our work with like & comment! ❤️

USDCAD: Long Signal Explained
USDCAD
- Classic bullish formation
- Our team expects growth
SUGGESTED TRADE:
Swing Trade
Buy USDCAD
Entry Level - 1.3742
Sl - 1.3706
Tp - 1.3809
Our Risk - 1%
Start protection of your profits from lower levels
Disclosure: I am part of Trade Nation's Influencer program and receive a monthly fee for using their TradingView charts in my analysis.
❤️ Please, support our work with like & comment! ❤️

USOIL Expected Growth! BUY!
My dear subscribers,
My technical analysis for USOIL is below:
The price is coiling around a solid key level - 60.68
Bias - Bullish
Technical Indicators: Pivot Points Low anticipates a potential price reversal.
Super trend shows a clear buy, giving a perfect indicators' convergence.
Goal - 61.41
My Stop Loss - 60.25
About Used Indicators:
By the very nature of the supertrend indicator, it offers firm support and resistance levels for traders to enter and exit trades. Additionally, it also provides signals for setting stop losses
Disclosure: I am part of Trade Nation's Influencer program and receive a monthly fee for using their TradingView charts in my analysis.
———————————
WISH YOU ALL LUCK

EURUSD Under Pressure! SELL!
My dear friends,
Please, find my technical outlook for EURUSD below:
The instrument tests an important psychological level 1.1348
Bias - Bearish
Technical Indicators: Supper Trend gives a precise Bearish signal, while Pivot Point HL predicts price changes and potential reversals in the market.
Target - 1.1313
About Used Indicators:
Super-trend indicator is more useful in trending markets where there are clear uptrends and downtrends in price.
Disclosure: I am part of Trade Nation's Influencer program and receive a monthly fee for using their TradingView charts in my analysis.
———————————
WISH YOU ALL LUCK

AUDJPY Trading Opportunity! SELL!
My dear subscribers,
This is my opinion on the AUDJPY next move:
The instrument tests an important psychological level 93.501
Bias - Bearish
Technical Indicators: Supper Trend gives a precise Bearish signal, while Pivot Point HL predicts price changes and potential reversals in the market.
Target - 92.966
About Used Indicators:
On the subsequent day, trading above the pivot point is thought to indicate ongoing bullish sentiment, while trading below the pivot point indicates bearish sentiment.
Disclosure: I am part of Trade Nation's Influencer program and receive a monthly fee for using their TradingView charts in my analysis.
———————————
WISH YOU ALL LUCK

GBPJPY Technical Analysis! SELL!
My dear subscribers,
This is my opinion on the GBPJPY next move:
The instrument tests an important psychological level 195.61
Bias - Bearish
Technical Indicators: Supper Trend gives a precise Bearish signal, while Pivot Point HL predicts price changes and potential reversals in the market.
Target - 193.94
My Stop Loss - 196.32
About Used Indicators:
On the subsequent day, trading above the pivot point is thought to indicate ongoing bullish sentiment, while trading below the pivot point indicates bearish sentiment.
Disclosure: I am part of Trade Nation's Influencer program and receive a monthly fee for using their TradingView charts in my analysis.
———————————
WISH YOU ALL LUCK

NZDJPY A Fall Expected! SELL!
My dear friends,
Please, find my technical outlook for NZDJPY below:
The price is coiling around a solid key level - 86.642
Bias - Bearish
Technical Indicators: Pivot Points Low anticipates a potential price reversal.
Super trend shows a clear sell, giving a perfect indicators' convergence.
Goal - 85.925
Safe Stop Loss - 87.013
About Used Indicators:
The pivot point itself is simply the average of the high, low and closing prices from the previous trading day.
Disclosure: I am part of Trade Nation's Influencer program and receive a monthly fee for using their TradingView charts in my analysis.
———————————
WISH YOU ALL LUCK

GBPAUD: Short Trading Opportunity
GBPAUD
- Classic bearish pattern
- Our team expects retracement
SUGGESTED TRADE:
Swing Trade
Sell GBPAUD
Entry - 2.1007
Stop - 2.1088
Take - 2.0850
Our Risk - 1%
Start protection of your profits from lower levels
Disclosure: I am part of Trade Nation's Influencer program and receive a monthly fee for using their TradingView charts in my analysis.
❤️ Please, support our work with like & comment! ❤️

AUDCAD On The Rise! BUY!
My dear followers,
I analysed this chart on AUDCAD and concluded the following:
The market is trading on 0.8864 pivot level.
Bias - Bullish
Technical Indicators: Both Super Trend & Pivot HL indicate a highly probable Bullish continuation.
Target - 0.8903
Safe Stop Loss - 0.8843
About Used Indicators:
A super-trend indicator is plotted on either above or below the closing price to signal a buy or sell. The indicator changes color, based on whether or not you should be buying. If the super-trend indicator moves below the closing price, the indicator turns green, and it signals an entry point or points to buy.
Disclosure: I am part of Trade Nation's Influencer program and receive a monthly fee for using their TradingView charts in my analysis.
———————————
WISH YOU ALL LUCK

AUDNZD: Long Signal with Entry/SL/TP
AUDNZD
- Classic bullish formation
- Our team expects pullback
SUGGESTED TRADE:
Swing Trade
Long AUDNZD
Entry - 1.0769
Sl - 1.0744
Tp - 1.0819
Our Risk - 1%
Start protection of your profits from lower levels
Disclosure: I am part of Trade Nation's Influencer program and receive a monthly fee for using their TradingView charts in my analysis.
❤️ Please, support our work with like & comment! ❤️

AUDUSD Will Explode! BUY!
My dear followers,
I analysed this chart on AUDUSD and concluded the following:
The market is trading on 0.6420 pivot level.
Bias - Bullish
Technical Indicators: Both Super Trend & Pivot HL indicate a highly probable Bullish continuation.
Target - 0.6455
About Used Indicators:
A super-trend indicator is plotted on either above or below the closing price to signal a buy or sell. The indicator changes color, based on whether or not you should be buying. If the super-trend indicator moves below the closing price, the indicator turns green, and it signals an entry point or points to buy.
Disclosure: I am part of Trade Nation's Influencer program and receive a monthly fee for using their TradingView charts in my analysis.
———————————
WISH YOU ALL LUCK

NZDUSD Trading Opportunity! BUY!
My dear friends,
NZDUSD looks like it will make a good move, and here are the details:
The market is trading on 0.5954 pivot level.
Bias - Bullish
Technical Indicators: Supper Trend generates a clear long signal while Pivot Point HL is currently determining the overall Bullish trend of the market.
Goal - 0.5969
About Used Indicators:
Pivot points are a great way to identify areas of support and resistance, but they work best when combined with other kinds of technical analysis
Disclosure: I am part of Trade Nation's Influencer program and receive a monthly fee for using their TradingView charts in my analysis.
———————————
WISH YOU ALL LUCK

GOLD What Next? BUY!
My dear friends,
GOLD looks like it will make a good move, and here are the details:
The market is trading on 3293.8 pivot level.
Bias - Bullish
Technical Indicators: Supper Trend generates a clear long signal while Pivot Point HL is currently determining the overall Bullish trend of the market.
Goal - 3307.5
Recommended Stop Loss - 3287.2
About Used Indicators:
Pivot points are a great way to identify areas of support and resistance, but they work best when combined with other kinds of technical analysis
Disclosure: I am part of Trade Nation's Influencer program and receive a monthly fee for using their TradingView charts in my analysis.
———————————
WISH YOU ALL LUCK

Lingrid | GOLD potential LONG trade From the SWAP zoneOANDA:XAUUSD is testing the SWAP zone, aligning closely with the rising trendline support near 3244. If bulls defend this level again, a move toward 3400 remains in play, with the downtrend line offering resistance on the way up. A higher low formation here would signal renewed bullish interest. We should watch for a breakout or rejection to confirm next direction.
📈 Key Levels
Buy zone: 3244–3255
Buy trigger: break and retest above 3287
Target: 3400
Sell trigger: drop below 3244
💡 Risks
Rejection from descending trendline
Failure to form a higher low structure
Breakdown of channel support near 3240 would invalidate the bullish thesis
Traders, if you liked this idea or if you have your own opinion about it, write in the comments. I will be glad 👩💻

Lingrid | GBPJPY Support Zone Bounce - High Probability SetupFX:GBPJPY is currently retracing after printing a strong higher high just above 196, with the price now approaching the 193.6 support level. A bounce is likely from this minor support or slightly lower, where an upward trendline intersects with the pullback zone. The chart hints at a potential bullish continuation toward the 195.0 target if the structure holds. Momentum will need to reassert quickly to confirm a recovery scenario.
📈 Key Levels
Buy zone: 193.3–193.6
Buy trigger: confirmation bounce above 193.6
Target: 195.0
Sell trigger: breakdown below 193.3
💡 Risks
Failure to reclaim 193.6 support may extend the pullback to 191.9
Bearish momentum from the recent top could overpower rebound attempts
Resistance at 195 could stall further upside even if support holds
Traders, if you liked this idea or if you have your own opinion about it, write in the comments. I will be glad 👩💻

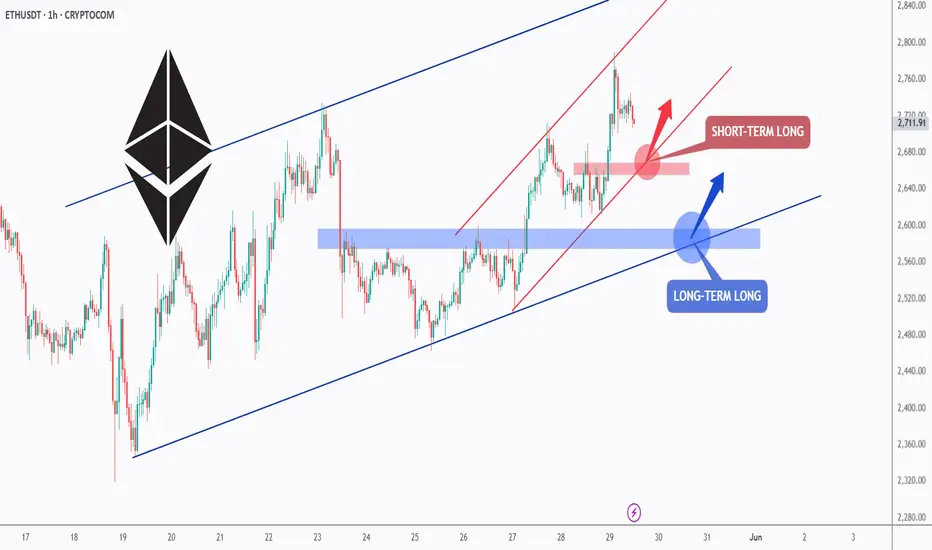
ETH - Long Anyway, Short-term and Long-term!Hello TradingView Family / Fellow Traders. This is Richard, also known as theSignalyst.
📈ETH has been overall bullish trading within the rising blue channel from a long-term perspective and within the rising red channel from a short-term perspective.
Moreover, the red and blue zones are strong support and structure!
🏹 Thus, the highlighted blue and red circles are strong areas to look for buy setups as it is the intersection of the lower zone(s) and trendline(s).
📚 As per my trading style:
As #ETH approaches one of the circles, I will be looking for bullish reversal setups (like a double bottom pattern, trendline break , and so on...)
📚 Always follow your trading plan regarding entry, risk management, and trade management.
Good luck!
All Strategies Are Good; If Managed Properly!
~Rich
GBPJPY - Bearish Control, Again!Hello TradingView Family / Fellow Traders. This is Richard, also known as theSignalyst.
📉As per our last GBPJPY analysis (attached on the chart), it rejected the upper red trendline and traded lower.
What's next?
GBPJPY is currently retesting the upper bound of the falling red channel again.
Moreover, the green zone is a strong structure and resistance.
🏹 Thus, the highlighted red circle is a strong area to look for sell setups as it is the intersection of structure and upper red trendline acting as a non-horizontal resistance.
📚 As per my trading style:
As #GBPJPY is around the red circle zone, I will be looking for bearish reversal setups (like a double top pattern, trendline break , and so on...)
📚 Always follow your trading plan regarding entry, risk management, and trade management.
Good luck!
All Strategies Are Good; If Managed Properly!
~Rich
Disclosure: I am part of Trade Nation's Influencer program and receive a monthly fee for using their TradingView charts in my analysis.

USDCHF Technical Analysis! BUY!
My dear subscribers,
My technical analysis for USDCHF is below:
The price is coiling around a solid key level - 0.8202
Bias - Bullish
Technical Indicators: Pivot Points Low anticipates a potential price reversal.
Super trend shows a clear buy, giving a perfect indicators' convergence.
Goal - 0.8285
My Stop Loss - 0.8166
About Used Indicators:
By the very nature of the supertrend indicator, it offers firm support and resistance levels for traders to enter and exit trades. Additionally, it also provides signals for setting stop losses
Disclosure: I am part of Trade Nation's Influencer program and receive a monthly fee for using their TradingView charts in my analysis.
———————————
WISH YOU ALL LUCK

GBPCHF My Opinion! SELL!
My dear friends,
My technical analysis for GBPCHF is below:
The market is trading on 1.1144 pivot level.
Bias - Bearish
Technical Indicators: Both Super Trend & Pivot HL indicate a highly probable Bearish continuation.
Target - 1.1126
About Used Indicators:
A pivot point is a technical analysis indicator, or calculations, used to determine the overall trend of the market over different time frames.
Disclosure: I am part of Trade Nation's Influencer program and receive a monthly fee for using their TradingView charts in my analysis.
———————————
WISH YOU ALL LUCK

Aptus Apt usdt Daily analysis
Time frame daily
Risk rewards ratio >2 👈👌
Target 7.4$
Pattern = two bottom

CHFJPY: Short Trade Explained
CHFJPY
- Classic bearish setup
- Our team expects bearish continuation
SUGGESTED TRADE:
Swing Trade
Short CHFJPY
Entry Point - 175.08
Stop Loss - 175.56
Take Profit - 174.16
Our Risk - 1%
Start protection of your profits from lower levels
Disclosure: I am part of Trade Nation's Influencer program and receive a monthly fee for using their TradingView charts in my analysis.
❤️ Please, support our work with like & comment! ❤️
