NATGAS: Short Trading Opportunity
NATGAS
- Classic bearish formation
- Our team expects pullback
SUGGESTED TRADE:
Swing Trade
Short NATGAS
Entry - 3.667
Sl - 3.862
Tp - 3.269
Our Risk - 1%
Start protection of your profits from lower levels
Disclosure: I am part of Trade Nation's Influencer program and receive a monthly fee for using their TradingView charts in my analysis.
❤️ Please, support our work with like & comment! ❤️
M-signal

USOIL What Next? BUY!
My dear followers,
I analysed this chart on USOIL and concluded the following:
The market is trading on 58.35 pivot level.
Bias - Bullish
Technical Indicators: Both Super Trend & Pivot HL indicate a highly probable Bullish continuation.
Target - 60.83
Safe Stop Loss - 57.06
About Used Indicators:
A super-trend indicator is plotted on either above or below the closing price to signal a buy or sell. The indicator changes color, based on whether or not you should be buying. If the super-trend indicator moves below the closing price, the indicator turns green, and it signals an entry point or points to buy.
Disclosure: I am part of Trade Nation's Influencer program and receive a monthly fee for using their TradingView charts in my analysis.
———————————
WISH YOU ALL LUCK

SPY A Fall Expected! SELL!
My dear friends,
SPY looks like it will make a good move, and here are the details:
The market is trading on 566.62 pivot level.
Bias - Bearish
Technical Indicators: Supper Trend generates a clear short signal while Pivot Point HL is currently determining the overall Bearish trend of the market.
Goal - 542.79
Recommended Stop Loss - 579.54
About Used Indicators:
Pivot points are a great way to identify areas of support and resistance, but they work best when combined with other kinds of technical analysis
Disclosure: I am part of Trade Nation's Influencer program and receive a monthly fee for using their TradingView charts in my analysis.
———————————
WISH YOU ALL LUCK

EURUSD My Opinion! BUY!
My dear subscribers,
EURUSD looks like it will make a good move, and here are the details:
The market is trading on 1.1298 pivot level.
Bias - Bullish
Technical Indicators: Both Super Trend & Pivot HL indicate a highly probable Bullish continuation.
Target - 1.1348
About Used Indicators:
The average true range (ATR) plays an important role in 'Supertrend' as the indicator uses ATR to calculate its value. The ATR indicator signals the degree of price volatility.
Disclosure: I am part of Trade Nation's Influencer program and receive a monthly fee for using their TradingView charts in my analysis.
———————————
WISH YOU ALL LUCK

TESLA Trading Opportunity! SELL!
My dear followers,
This is my opinion on the TESLA next move:
The asset is approaching an important pivot point 287.25
Bias - Bearish
Technical Indicators: Supper Trend generates a clear short signal while Pivot Point HL is currently determining the overall Bearish trend of the market.
Goal - 262.50
About Used Indicators:
For more efficient signals, super-trend is used in combination with other indicators like Pivot Points.
Disclosure: I am part of Trade Nation's Influencer program and receive a monthly fee for using their TradingView charts in my analysis.
———————————
WISH YOU ALL LUCK

ENSUSDT Analysis D1ENSUSDT Following Setup Breakout,Retest Confirm Bouncing Expecting Solid Recovery In Coming Days .

BANANAUSDT Analysis D1BANANAUSDT Descending Trendline Has Already Got Cleared, Banana Can Give Solid Bullish Rally In Coming Days .

ARBUSDT Analysis D1ARBUSDT Descending Channel & Other Multiple Hurdles Has Already Got Cleared Arb Can Give Solid Bullish Rally In Coming Days


HIGHUSDT Analysis D1HIGHUSDT Already Broken Descending Broadening and started Recovery in D1 Chart
Continuity of momentum can see 80-120% Bullish Rally in Short-term .

HOTUSDT Analysis D1HOTUSDT Horizontal Resistance Breakout & Retest Confirmed, Now Holochain Need To Break Descending Channel To Lead Solid Recovery, Expecting 150% Rally After Successful Breakout

FILUSDT Analysis D1FILUSDT Looks Bullish So Far Falling Wedge Breakout, Retest Done, Horizontal Resistance Breakout, Retest Done, Another Trendline Breakout, Retest Done So Whats Next? In My Point Of View Rally Towards 5$ .

ETCUSDT Analysis D1ETCUSDT Trendline Breakout & Retest Has Already Confirmed, Currently Consolidating Within Bullish Pennant Once Pennant Got Cleared, Etc Can Lead Solid Recovery Towards 30-35$ In Coming Days .

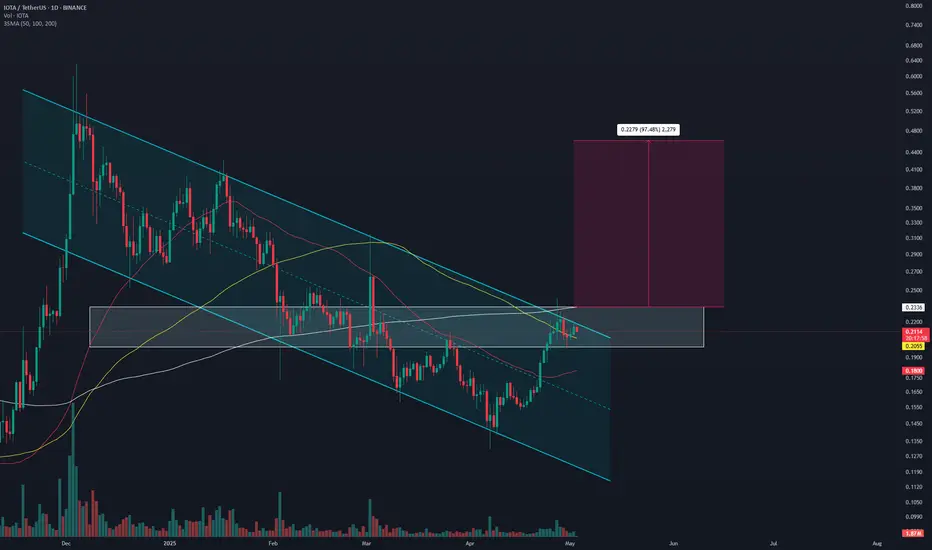
IOTAUSDT Analysis D1IOTAUSDT Seems Like Ready For Strong Bullish Rally, Breakout And Retest Has Already Confirmed, Expecting 2x In Coming Days .
GBPNZD Will Collapse! SELL!
My dear followers,
This is my opinion on the GBPNZD next move:
The asset is approaching an important pivot point 2.2536
Bias - Bearish
Safe Stop Loss - 2.2629
Technical Indicators: Supper Trend generates a clear short signal while Pivot Point HL is currently determining the overall Bearish trend of the market.
Goal - 2.2332
About Used Indicators:
For more efficient signals, super-trend is used in combination with other indicators like Pivot Points.
Disclosure: I am part of Trade Nation's Influencer program and receive a monthly fee for using their TradingView charts in my analysis.
———————————
WISH YOU ALL LUCK

EURCHF Set To Fall! SELL!
My dear subscribers,
This is my opinion on the EURCHF next move:
The instrument tests an important psychological level 0.9376
Bias - Bearish
Technical Indicators: Supper Trend gives a precise Bearish signal, while Pivot Point HL predicts price changes and potential reversals in the market.
Target - 0.9358
About Used Indicators:
On the subsequent day, trading above the pivot point is thought to indicate ongoing bullish sentiment, while trading below the pivot point indicates bearish sentiment.
Disclosure: I am part of Trade Nation's Influencer program and receive a monthly fee for using their TradingView charts in my analysis.
———————————
WISH YOU ALL LUCK

EURUSD Massive Long! BUY!
My dear subscribers,
EURUSD looks like it will make a good move, and here are the details:
The market is trading on 1.1317 pivot level.
Bias - Bullish
My Stop Loss - 1.1282
Technical Indicators: Both Super Trend & Pivot HL indicate a highly probable Bullish continuation.
Target - 1.1379
About Used Indicators:
The average true range (ATR) plays an important role in 'Supertrend' as the indicator uses ATR to calculate its value. The ATR indicator signals the degree of price volatility.
Disclosure: I am part of Trade Nation's Influencer program and receive a monthly fee for using their TradingView charts in my analysis.
———————————
WISH YOU ALL LUCK

EURJPY: Short Trade Explained
EURJPY
- Classic bearish setup
- Our team expects bearish continuation
SUGGESTED TRADE:
Swing Trade
Short EURJPY
Entry Point - 163.91
Stop Loss - 164.69
Take Profit - 162.42
Our Risk - 1%
Start protection of your profits from lower levels
Disclosure: I am part of Trade Nation's Influencer program and receive a monthly fee for using their TradingView charts in my analysis.
❤️ Please, support our work with like & comment! ❤️

EURAUD: Bullish Continuation & Long Signal
EURAUD
- Classic bullish formation
- Our team expects growth
SUGGESTED TRADE:
Swing Trade
Buy EURAUD
Entry Level - 1.7627
Sl - 1.7554
Tp - 1.7775
Our Risk - 1%
Start protection of your profits from lower levels
Disclosure: I am part of Trade Nation's Influencer program and receive a monthly fee for using their TradingView charts in my analysis.
❤️ Please, support our work with like & comment! ❤️

USDJPY Trading Opportunity! SELL!
My dear subscribers,
This is my opinion on the USDJPY next move:
The instrument tests an important psychological level 144.50
Bias - Bearish
Technical Indicators: Supper Trend gives a precise Bearish signal, while Pivot Point HL predicts price changes and potential reversals in the market.
Target - 142.26
My Stop Loss - 145.51
About Used Indicators:
On the subsequent day, trading above the pivot point is thought to indicate ongoing bullish sentiment, while trading below the pivot point indicates bearish sentiment.
Disclosure: I am part of Trade Nation's Influencer program and receive a monthly fee for using their TradingView charts in my analysis.
———————————
WISH YOU ALL LUCK

GBPCAD Will Explode! BUY!
My dear subscribers,
My technical analysis for GBPCAD is below:
The price is coiling around a solid key level - 1.8389
Bias -Bullish
Technical Indicators: Pivot Points Low anticipates a potential price reversal.
Super trend shows a clear buy, giving a perfect indicators' convergence.
Goal - 1.8459
About Used Indicators:
By the very nature of the supertrend indicator, it offers firm support and resistance levels for traders to enter and exit trades. Additionally, it also provides signals for setting stop losses
Disclosure: I am part of Trade Nation's Influencer program and receive a monthly fee for using their TradingView charts in my analysis.
———————————
WISH YOU ALL LUCK

Lingrid | ETHUSDT Trend Continuation Pattern. Potential LongBINANCE:ETHUSDT is consolidating inside an upward channel, holding just above the 1,757 support and the upward trend-line. After reaching a higher high near the channel top, price pulled back but remains within structure. If the trend-line holds, a rebound toward the 1,990 resistance looks likely. The bullish setup remains valid while price trades above the trend-line.
📈 Key Levels
Buy zone: 1,750 – 1,760
Buy trigger: bounce from trend-line
Target: 1,990
Sell trigger: break below 1,750
💡 Risks
If ETH loses trend-line support, momentum could flip to bearish.
Volatility from BTC or macro events may trigger false moves.
Watch for breakout above consolidation highs for early confirmation.
Traders, if you liked this idea or if you have your own opinion about it, write in the comments. I will be glad 👩💻

XRP is Back!Hello TradingView Family / Fellow Traders. This is Richard, also known as theSignalyst.
📈XRP has been overall bullish from a medium-term perspective trading within the rising channel marked in blue.
Moreover, the green zone is a strong structure!
🏹 Thus, the highlighted blue circle is a strong area to look for buy setups as it is the intersection of structure and lower blue trendline acting as a non-horizontal support.
📚 As per my trading style:
As #XRP approaches the blue circle zone, I will be looking for bullish reversal setups (like a double bottom pattern, trendline break , and so on...)
📚 Always follow your trading plan regarding entry, risk management, and trade management.
Good luck!
All Strategies Are Good; If Managed Properly!
~Rich
