AUDNZD Trading Opportunity! SELL!
My dear followers,
This is my opinion on the AUDNZD next move:
The asset is approaching an important pivot point 1.0786
Bias - Bearish
Technical Indicators: Supper Trend generates a clear short signal while Pivot Point HL is currently determining the overall Bearish trend of the market.
Goal - 1.0770
About Used Indicators:
For more efficient signals, super-trend is used in combination with other indicators like Pivot Points.
Disclosure: I am part of Trade Nation's Influencer program and receive a monthly fee for using their TradingView charts in my analysis.
———————————
WISH YOU ALL LUCK
M-signal

EURUSD The Target Is UP! BUY!
My dear friends,
Please, find my technical outlook for EURUSD below:
The instrument tests an important psychological level 1.1504
Bias - Bullish
Technical Indicators: Supper Trend gives a precise Bullish signal, while Pivot Point HL predicts price changes and potential reversals in the market.
Target - 1.1544
About Used Indicators:
Super-trend indicator is more useful in trending markets where there are clear uptrends and downtrends in price.
Disclosure: I am part of Trade Nation's Influencer program and receive a monthly fee for using their TradingView charts in my analysis.
———————————
WISH YOU ALL LUCK


Another RR1 Buy Setup on Gold
TimeFrame: m30
Position Type: BUY
Entry Price: 3395
Stop Loss: 3372
Take Profit: 3417
R/R: 1
Please Manage Your Risk...
Trading is a risk management game...

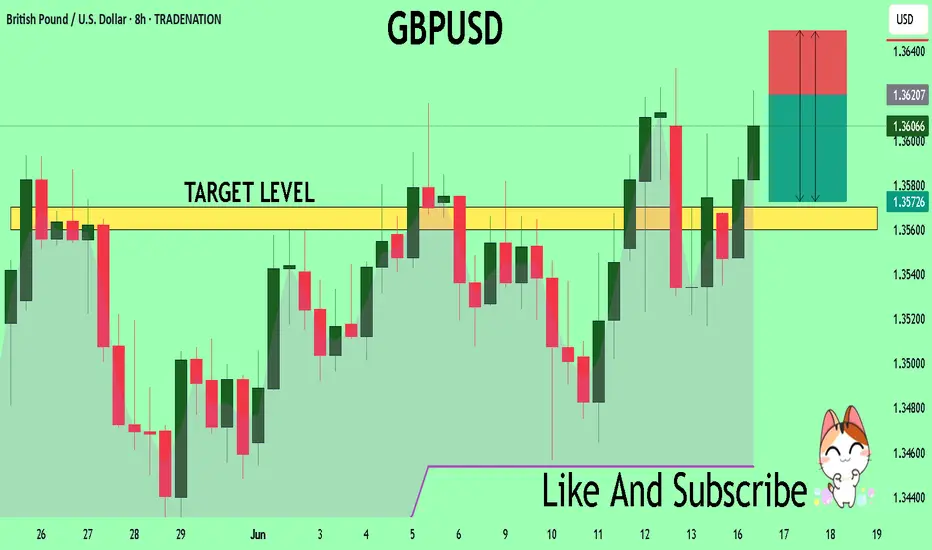
GBPUSD Will Collapse! SELL!
My dear friends,
Please, find my technical outlook for GBPUSD below:
The price is coiling around a solid key level - 1.3619
Bias - Bearish
Technical Indicators: Pivot Points Low anticipates a potential price reversal.
Super trend shows a clear sell, giving a perfect indicators' convergence.
Goal - 1.3570
Safe Stop Loss - 1.3649
About Used Indicators:
The pivot point itself is simply the average of the high, low and closing prices from the previous trading day.
Disclosure: I am part of Trade Nation's Influencer program and receive a monthly fee for using their TradingView charts in my analysis.
———————————
WISH YOU ALL LUCK
EURCAD Set To Fall! SELL!
My dear subscribers,
This is my opinion on the EURCAD next move:
The instrument tests an important psychological level 1.5718
Bias - Bearish
Technical Indicators: Supper Trend gives a precise Bearish signal, while Pivot Point HL predicts price changes and potential reversals in the market.
Target - 1.5674
My Stop Loss - 1.5743
About Used Indicators:
On the subsequent day, trading above the pivot point is thought to indicate ongoing bullish sentiment, while trading below the pivot point indicates bearish sentiment.
Disclosure: I am part of Trade Nation's Influencer program and receive a monthly fee for using their TradingView charts in my analysis.
———————————
WISH YOU ALL LUCK

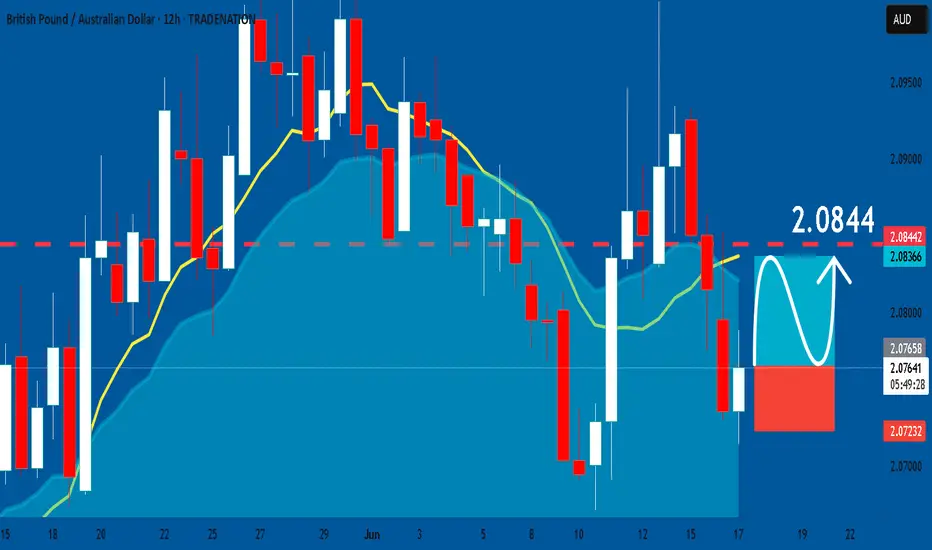
GBPAUD: Bullish Continuation & Long Trade
GBPAUD
- Classic bullish formation
- Our team expects growth
SUGGESTED TRADE:
Swing Trade
Buy GBPAUD
Entry Level - 2.0766
Sl - 2.0723
Tp - 2.0844
Our Risk - 1%
Start protection of your profits from lower levels
Disclosure: I am part of Trade Nation's Influencer program and receive a monthly fee for using their TradingView charts in my analysis.
❤️ Please, support our work with like & comment! ❤️
EURCHF: Bearish Continuation & Short Signal
EURCHF
- Classic bearish setup
- Our team expects bearish continuation
SUGGESTED TRADE:
Swing Trade
Short EURCHF
Entry Point - 0.9403
Stop Loss - 0.9417
Take Profit - 0.9380
Our Risk - 1%
Start protection of your profits from lower levels
Disclosure: I am part of Trade Nation's Influencer program and receive a monthly fee for using their TradingView charts in my analysis.
❤️ Please, support our work with like & comment! ❤️

USDJPY What Next? SELL!
My dear followers,
This is my opinion on the USDJPY next move:
The asset is approaching an important pivot point 145.13
Bias - Bearish
Safe Stop Loss - 145.55
Technical Indicators: Supper Trend generates a clearshort signal while Pivot Point HL is currently determining the overall Bearish trend of the market.
Goal - 144.31
About Used Indicators:
For more efficient signals, super-trend is used in combination with other indicators like Pivot Points.
Disclosure: I am part of Trade Nation's Influencer program and receive a monthly fee for using their TradingView charts in my analysis.
———————————
WISH YOU ALL LUCK

USDCHF My Opinion! SELL!
My dear followers,
I analysed this chart on USDCHF and concluded the following:
The market is trading on 0.8147 pivot level.
Bias - Bearish
Technical Indicators: Both Super Trend & Pivot HL indicate a highly probable Bearish continuation.
Target - 0.8131
About Used Indicators:
A super-trend indicator is plotted on either above or below the closing price to signal a buy or sell. The indicator changes color, based on whether or not you should be buying. If the super-trend indicator moves below the closing price, the indicator turns green, and it signals an entry point or points to buy.
Disclosure: I am part of Trade Nation's Influencer program and receive a monthly fee for using their TradingView charts in my analysis.
———————————
WISH YOU ALL LUCK

GOLD Massive Long! BUY!
My dear friends,
GOLD looks like it will make a good move, and here are the details:
The market is trading on 3389.4 pivot level.
Bias - Bullish
Technical Indicators: Supper Trend generates a clear long signal while Pivot Point HL is currently determining the overall Bullish trend of the market.
Goal -3396.3
Recommended Stop Loss - 3385.8
About Used Indicators:
Pivot points are a great way to identify areas of support and resistance, but they work best when combined with other kinds of technical analysis
Disclosure: I am part of Trade Nation's Influencer program and receive a monthly fee for using their TradingView charts in my analysis.
———————————
WISH YOU ALL LUCK

USDCHF - Now Bullish!Hello TradingView Family / Fellow Traders. This is Richard, also known as theSignalyst.
As per our last USDCHF analysis, attached on the chart, it rejected the upper bound of the orange channel and traded lower.
What's next?
📈USDCHF is now retesting the lower bound of the channel.
Moreover, the blue line is a strong weekly low.
🏹 Thus, the highlighted blue circle is a strong area to look for buy setups as it is the intersection of the lower orange trendline and weekly low.
📚 As per my trading style:
As #USDCHF is around the blue circle zone, I will be looking for bullish reversal setups (like a double bottom pattern, trendline break , and so on...)
📚 Always follow your trading plan regarding entry, risk management, and trade management.
Good luck!
All Strategies Are Good; If Managed Properly!
~Rich
Disclosure: I am part of Trade Nation's Influencer program and receive a monthly fee for using their TradingView charts in my analysis.

Sell Limit Setup above 2025 High📉 AUD/USD – 2H Chart Analysis
🕒 Published: June 16, 2025 | TF: 2H
🔔 Trade Idea: 2x Sell Limit at Key Resistance Zone
🔹 Market Context:
Price is trading within a rising broadening wedge pattern (marked by the white and blue trendlines).
Current rally retraced aggressively toward upper wedge resistance (2025 High), an area that has repeatedly capped bullish momentum.
Price approaching previous supply zone.
🔻 Sell Limit Setup 1
Entry: 0.65400
SL: 0.6584
TP: 0.6503
R:R ≈ 1
➕ Fades rally into resistance
➕ Aligns with EMA structure and intraday exhaustion
🔻 Sell Limit Setup 2
Entry: 0.6550
SL: 0.6584
TP: 0.6499
R:R ≈ 2
➕ Higher entry into wick zone (liquidity trap)
➕ Potential false breakout above structure
➕ SL above key swing high = cleaner invalidation
⚠️ Aggressive short: smaller SL, better RR

QQQ On The Rise! BUY!
My dear friends,
My technical analysis for QQQ is below:
The market is trading on 526.92 pivot level.
Bias - Bullish
Technical Indicators: Both Super Trend & Pivot HL indicate a highly probable Bullish continuation.
Target - 530.98
About Used Indicators:
A pivot point is a technical analysis indicator, or calculations, used to determine the overall trend of the market over different time frames.
Disclosure: I am part of Trade Nation's Influencer program and receive a monthly fee for using their TradingView charts in my analysis.
———————————
WISH YOU ALL LUCK

EURNZD Massive Short! SELL!
My dear subscribers,
EURNZD looks like it will make a good move, and here are the details:
The market is trading on 1.9194 pivot level.
Bias - Bearish
My Stop Loss - 1.9246
Technical Indicators: Both Super Trend & Pivot HL indicate a highly probable Bearish continuation.
Target - 1.9095
About Used Indicators:
The average true range (ATR) plays an important role in 'Supertrend' as the indicator uses ATR to calculate its value. The ATR indicator signals the degree of price volatility.
Disclosure: I am part of Trade Nation's Influencer program and receive a monthly fee for using their TradingView charts in my analysis.
———————————
WISH YOU ALL LUCK

EURNZD: Short Trading Opportunity
EURNZD
- Classic bearish setup
- Our team expects bearish continuation
SUGGESTED TRADE:
Swing Trade
Short EURNZD
Entry Point - 1.9088
Stop Loss - 1.9138
Take Profit - 1.8982
Our Risk - 1%
Start protection of your profits from lower levels
Disclosure: I am part of Trade Nation's Influencer program and receive a monthly fee for using their TradingView charts in my analysis.
❤️ Please, support our work with like & comment! ❤️

GOLD: Long Signal Explained
GOLD
- Classic bullish formation
- Our team expects pullback
SUGGESTED TRADE:
Swing Trade
Long GOLD
Entry - 3396.6
Sl - 3389.4
Tp - 3413.3
Our Risk - 1%
Start protection of your profits from lower levels
Disclosure: I am part of Trade Nation's Influencer program and receive a monthly fee for using their TradingView charts in my analysis.
❤️ Please, support our work with like & comment! ❤️

Try a R/R1 BuyThis signal is based on a 60% win rate backtested strategy...
1st order:
Buy @ 3418.3
SL: 3410
TP: 3426
2nd order:
Buy Limit @ 3414
SL: 3410
TP: 3426
Manage your Risk...

GBPCAD Technical Analysis! BUY!
My dear friends,
GBPCAD looks like it will make a good move, and here are the details:
The market is trading on 1.8449 pivot level.
Bias - Bullish
Technical Indicators: Supper Trend generates a clear long signal while Pivot Point HL is currently determining the overall Bullish trend of the market.
Goal - 1.8496
About Used Indicators:
Pivot points are a great way to identify areas of support and resistance, but they work best when combined with other kinds of technical analysis
Disclosure: I am part of Trade Nation's Influencer program and receive a monthly fee for using their TradingView charts in my analysis.
———————————
WISH YOU ALL LUCK

$MANA Trading SignalKey Zones: Clear supply zone above and demand zone below the current price.
Fair Value Gaps (FVGs):
3 FVGs on the 4H timeframe below the current price.
2 FVGs on the 1H timeframe above the current price.
Trend & Indicators:
Market structure remains bullish.
OBV is forming a rising wedge, indicating potential momentum exhaustion.
Anchored volume profile shows high volume concentration below the current price, suggesting strong support.
Trade Plan:
Scalp Setup: Based on the smaller Fibonacci retracement tool, with a target at the previous swing high. Risk-to-reward (R:R) is approximately 1:1.
Swing Setup: Entry between the two 4H FVGs around 0.2874, targeting the psychological levels above. Stop loss set below the most recent swing low.

This isn’t a breakout. It’s a return to senderPrice didn’t rally from randomness — it tapped directly into a daily OB, respected it, and is now marching toward unfulfilled inefficiency above. What looks like recovery is really just Smart Money closing the loop.
The logic:
Price swept sell-side liquidity into a deep daily OB and rebounded sharply — not passively. The response wasn’t a bounce. It was intention.
Above? Two clean destinations:
TP1: 110,950 — inefficiency fill and EQ of prior supply
TP2: 112,033 — full delivery into unmitigated structure
No overlapping zones, no chaos — just precise levels that haven’t yet been claimed.
Execution:
Entry: 104,200–105,000 range
SL: Below 103,800
TP1: 110,950
TP2: 112,033
The risk is defined. The reward is prewritten.
Final thought:
“This move wasn’t built to excite you. It was built to deliver.”

The OB is set. The move just hasn’t been claimed yetThis is structure, not speculation. XRP tapped the 1H Order Block, held its low, and began building compression. Price is coiling — not failing. That matters.
The logic:
After the initial drop, price swept local lows into an untouched OB, then printed higher lows into a tighter range. That’s not weakness — that’s staging. Smart Money builds quietly. This is the echo of their positioning.
Above us sits a single, untested draw:
TP: 2.2540 — inefficiency fill, paired with external liquidity resting above last week's mid-range
Expecting one more dip into the OB is not only possible — it’s ideal. That’s where they’ll trap the impatient.
Execution:
Entry: 2.11–2.13 retest (into OB)
SL: Below 2.08
TP: 2.2540
No noise. No chasing. This is a campaign move — the kind that rewards precision, not emotion.
Final thought:
“I don’t trade the bounce. I trade the buildup before it’s even visible.”

The FVG was the invitation. The OB was the entryBTC delivered exactly where it needed to. It didn’t break down. It rebalanced. The chart isn’t noisy — it’s speaking. And it’s pointing to 108.3k.
The logic:
Price printed clean displacement, returned to mitigate a 1H FVG stacked on top of a refined Order Block, then paused. That pause is structure — not indecision. Volume compression confirms it: absorption, not rejection.
A deeper OB sits below at 102.5k. If we tap it, it’s not invalidation — it’s refinement. But the primary play is already in motion.
The path:
Reclaim 105.7k range high
Break above intraday liquidity
Deliver to 108.3k inefficiency fill
Execution:
Entry: 104.8k–105.1k (current OB zone)
SL: Below 103.9k
TP: 108.3k
Don’t react to the candles. React to what they represent — engineered displacement followed by precision mitigation.
Final thought:
“This isn’t a trade setup. It’s a delivery route — and I’m already onboard.”
