AAPL - BULLISH SCENARIOKeyBanc raised its price target for Apple (NASDAQ:AAPL) to $200 from $180 and maintained an Overweight rating on the stock. However, analysts expressed neutrality in the near term despite their positive long-term outlook.
They reiterated their below-consensus revenue estimates for Apple's hardware in the third quarter of 2023. The analysts highlighted two concerns. First, Key first look data (Apple direct channel) showed strong spending in June compared to historical averages, but a quarter-on-quarter decline worse than historical averages. Second, KeyBanc expected softness in Apple's indirect channel (U.S. Carriers) due to historically low upgrade rates in the United States.
The analysts concluded by stating that for Apple to achieve favorable results, international sales must compensate for underperforming U.S. sales. Their price target is set at $200, based on a multiple of 20.8x their 2024 adjusted EBITDA estimates.
Risk Disclosure: Trading Foreign Exchange (Forex) and Contracts of Difference (CFD's) carries a high level of risk. By registering and signing up, any client affirms their understanding of their own personal accountability for all transactions performed within their account and recognizes the risks associated with trading on such markets and on such sites. Furthermore, one understands that the company carries zero influence over transactions, markets, and trading signals, therefore, cannot be held liable nor guarantee any profits or losses.
Macbook
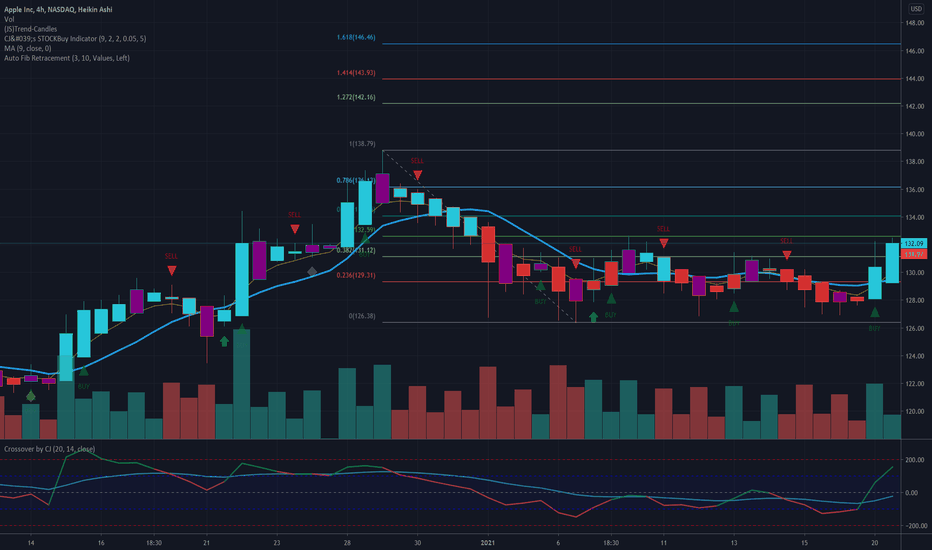
Apple is finally flashing BUY signal, 7 confirmsSome unknown company called by a fruit.
- everybody is jumping on the Apple cart.
- get on the bus towards earnings.
Happy Trading, from CJ -- aka the greatest FURU.
To find out more about The Ultimate Stock Indicator on Tradingview, please check my public profile.
Low Risk Trade on AAPL with 40% potential upsideAAPL has confirmed a bullish trend on 1 Dec 2020 through three signals:
1. Breaking the downard arch (in red) starting on 2 Sep 2020.
2. printing a green 2 above a green 1 on the TD sequential indicator.
3. Launching off of the bottom of the blue channel.
4. The two arches (red and green) act like a triangle which was also broken upwards.
To me, this is a very bullish entry with stoplosses at $112 and $106.
Some resitance is expected at the dotted blue lines before we make it to the top of the channel.
Tomorrow's (16 Dec 2020) hopeful green 2 above a green 1 will be the second and a stronger confirmation.
Intel 10-year trend reversal?I'm not a fan of the question mark in the title thing, but I really don't know much about Intel's fundamentals to judge such a long term move. What I see here is big RSI divergence between the tops of June 2018 and Jan 2020. And I see a descending 'arch' triangle, more visible on the weekly. It will only take one or two months to see if this triangle holds. Then, we can judge.
Also, with the recent tried success of the new revolutionary Apple M1 chip, some of Intel's market share will be cut. That would definitely be a factor in the disruption of Intel.
RECAP on $AAPL So as predicted again. WE got the consolidation under resistance on the daily and finished the day choppy and without a decision on where AAPL wants to go. That is represented in the Spinning Top Candle on the daily where buyers and sellers tried but no one won. We didnt get the usual AAPL pump but with so much overhead on the chart it couldn't be done without conviction. The probability of AAPL seeing downside relies heavily on the movements of SPY, but if we get a market wide pullback we could see outselfs at support quick. A break here would have us under the EMAs and my HULL indicator. We will see if anything yields from the bullish spinning top, Any upwards movments from SPY could send us over the daily resistance and up on a bullish trend! Happy trading!


