EUR/CAD: Sell pressure in the trend; explain it!!!In this analysis, we see that the day trading it's so bearish in Euro/Canadian Dollar or EUR/CAD.
Now, I'm enfocous more in H2 tmeframe becuase in this point, there's an interesting good short position in this par that we can to sell right now in the market. There's a short opportunity to find down 102 pips, that it's a good profit to take it. I'm in the market price approximately in the $1.5439 CAD with the SL at $1.5480 CAD (45 pips) and my target will be the $1.5332 CAD (102 pips)
This analysis in H8 timeframe it's the best to watch, becuase if you noticed it, we following this bearsih trend line that I also show them with red arrows these reaction that they make.
So, I entry right now in the market using the price action in H2 timeframe, H4 it's ok, but I'd reccomend this timeframe H2 becuase it's the better, and also, this par it's so volatile and so liquidated that make movement so fast!!!
And that, it's my Daily chart, we see that EUR/CAD it's into this cosnolidation and maybe in shott term, we could to leading down to these demand zone, in this yellow zone to bought, that it's a nice position ot put long position in these yellow zone in the down that formed this support!!!
Moving Average Convergence / Divergence (MACD)

Cardano setup ADA looking pretty for recapturing the 50 then using that momentum to break resistance. Go team!

Detailed technical analysis Detailed technical analysis on 1 hr chart.
Please comment with thoughts and ideas. Thank you.

Analysis off confirmed supportLooks like we have confirmed support at 90.050. This not only tells me DXY wants to retest top resistance but also tells me we may be entering longterm DXY bullish especially with continued support.
MACD and Signal have crossed and heading for zero line. RSI is slanting out of oversold and heading for overbought.
Attached is my previous (very accurate play) DXY idea. Please observe.
Please comment with thoughts and ideas. Thank you.


Buy analysis Please observe and study chart for sentiment.
Please comment with thoughts and ideas. Thank you.

Quick sell analysisObserve chart and please comment with thoughts and ideas. Thank you.
Previous ideas attached

Sell checks offI see a clear sell in play based off support and resistance. We can see clear rejections at 1.37000 followed by huge drops to supports as low as 1.34500 at this level.
To keep it safe I placed TPs at the next two key supports for retests.
Macd and Signal made a clear cross and heading for 0 line while RSI is looking to break support.
DXY is currently in fuel mode as we saw a second support retest at 90.00 followed by a pivot.
Please comment with thoughts and ideas. Thank you.

Huge top rejectionAfter a nice surge to top resistance we found rejection. Rejection at this level aims for bottom support.
Macd/Signal are making huge cross through zero line indicating the volume increase for sellers. RSI is set to make deep breach into oversold.
Please comment with thoughts and comments. Previous idea was buy from bottom support to top with huge success is attached. Thank you.

Technical sellQuick pips read chart and watch for pullback at TP 1.
Please comment with thoughts and ideas. Thank you.
MACD and RSI set for short sell off.

Technical scalpLooking for a retest of .70000 from the momentum with a MACD/SIGNAL 0 line cross.
Look for resistance at .69800 however I am hoping MACD play out will give a push through.
Choppy market right now with DXY overall strength. Please comment with thoughts and ideas. Thank you.

Continuation to TP 2 This is a continuation from my previous set up to TP 1 ( Idea attached)
A break through .89800 will confirm further momentum towards .89400. These supports are based off price action levels.
Please comment with thoughts and ideas. Thank you.

Long! MACD Crossing up out of overbought territoryCould see this pop more than 50% in the next few days, seems like it's building momentum.

RSI/SMA/Pitch Fork Support and Res. BTC BREAKING BEAR TREND.Historically a shift to a bear cycle in BTC is marked by a 50% drop within a 2 week period. If you actually look at this latest correction it really only measures about -27%. Thus I feel it does not warrant any closing of short term positions. I actually find this drop to be comparable to the April 2017, prior to the REAL FOMO coming in.
The chart shown here is BTC, derived from the Coinbase exchange. The beginning of the channel shown(also where the pitchfork begins) is where a parabolic shift up began(Representing an explosion of growth), this can be confirmed by an uptick in volume, as visualized by the volume SMA. The purple SMA is 100 length, which historically is also broken when a bear cycle begins. The blue SMA is 16 length. It is KEY that the 16 length SMA is broken for the Bull trend to continue.
The RSI is often said to be obsolete, clearly this isn't the case on 4hr charts. This makes sense since many day traders and swing traders use the RSI oscillator, but on the intra-day charts primarily.
Please like and share!!

Spot on price actionThese arrow levels were set to my previous XAUUSD idea that was spot on and can be seen in the attached idea.
As we can see there was a pivot around 1824.800 (which can be seen as a pivot point in attached idea). I expect a retest of 1900.
The trend in my previous idea followed the green arrows and pivoted as I mapped at top resistance to drop to this support. Based off my accuracy here I sentiment towards strong price action in play.
Technicals are set for upwards momentum with macd and signal heading towards 0 line and RSI heading further out of oversold zone.
NOTE: Arrows are set to my previous idea that is attached
Please comment with thoughts and ideas and make sure you view the previous idea attached. Thank you.

Triangle Breakout to the 30's?Anyone else seeing this triangle pattern? MACD is moving up so we'll see if this pops.

Long SNOW finally? MACD heading upStrong day for SNOW and other tech stocks today, could be the start of a good run, MACD heading up outside of oversold.


Previous Identical buy off supportLooking at an identical buy set up with support and pivot off .68900.
MACD and signal are set to cross with RSI shooting out of oversold zone. TP at first resistance with TP2 occurring only with a breach and close of .69300.
Attached is my previous idea on this pair which ended in great profit.

Next stop 26 K (Potential direction sentiment to target)Previously 24k was a clear strong support. Once breached the pair found resistance at 25000 with multiple rejections.
The trend I noticed once a key level breaks is a push to the next psychological whole number (22 k to 23 k, 23 k to 24 k, and 24 K to 25 k). I mapped out my trend pattern sentiment to visualize what I see.
We may see some volatility between 24 K and 25 K until a significant breach of 25 k occurs. When these levels are breached the volume of the trend trading increases significantly.
Please comment with thoughts and ideas. Thank you.

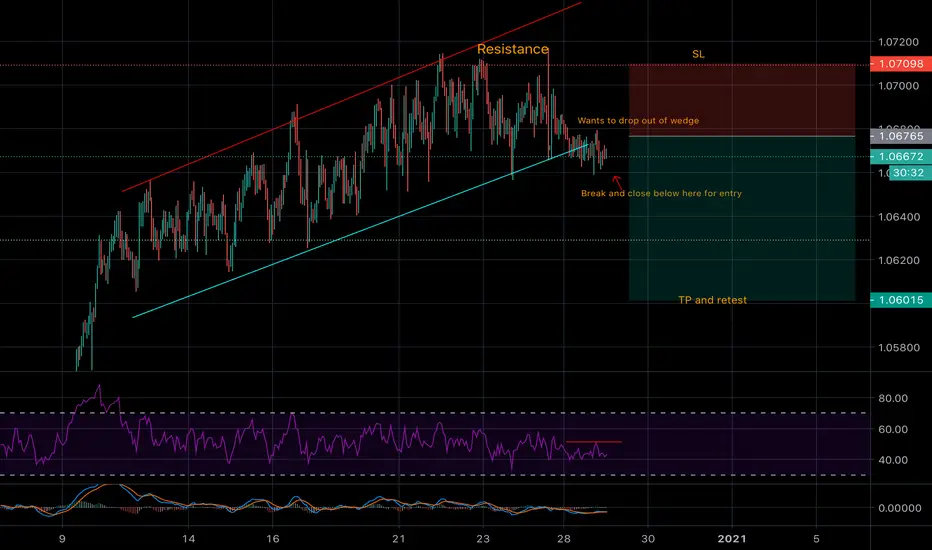
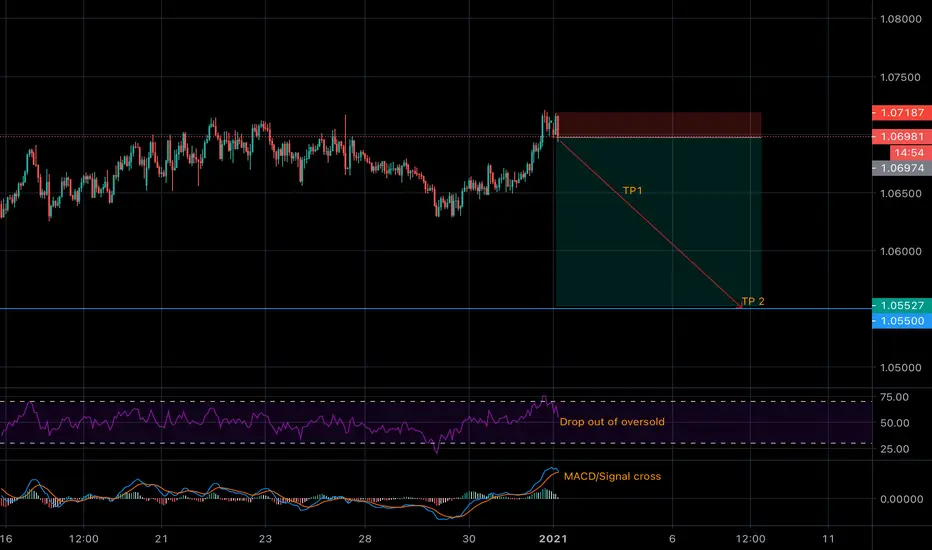
Potential falling out of wedgeThe pair has been in an ascending wedge and has hit some straight resistance following a drop below support. We have some consolidation so for better sentiment towards a drop wait for a breach and close below 1.06600.
RSI is finding resistance as presented in chart and MACD/Signal set to divert.
TP and SL as shown on chart and pay attention to entry.
Please comment with thoughts and ideas. Thank you.
Quick analysis Here is a quick sell analysis based of resistance rejection correlating with potential MACD/SIGNAL cross to push RSI further away from overbought.
Please comment with thoughts and ideas. Thank you.
Potential sellThis is a two entry sell analysis with an entry rule.
Although GBP as found some momentum as a whole, CAD has been looming right behind in its showdown with 4 weeks of strong positive economics which is expected to continue through the start of 2021.
The entry rule here is clearly shown on the chart. A break and close out below the support of 1.73500 for one who practice strict risk management rather than sell stopping at 1.74000 ( which I’ll do on my demo account 😂).
TP first sell at support shown and if the support breaks allow the second sell to continue to second TP. Close out second sell if there is clear support at 1.74000 and pivots look for SL.
RSI and MACD are currently correcting towards selling points for some technical sentiment.
Please comment with any thoughts and ideas. Thank you.
