BTC (14/06/2021)BTC trend in short term:
BTC is moving sideways in the area of $35k-$37k, the range is gradually narrowing to the innermost ring of the bolinger Band.
Still moving steadily in the linear regression line
The 14th candle is currently above the MA(10) line, creating a new support line for the price of BTC , however, the buying and selling force is still very weak and tends to decrease. If Volume continues to decline for the 15th day and the price stays above the overhead support at $37k, this could be a new support line.
Considering the trend of the RSI line, the price is very likely BTC will returnin the short term, come to the uptrend and combined with the signal of the MACD indicator, the value of BTC has recovered from June 8th.
However, there is still a high possibility that there will be a correction to the $30-$33k price range and then it will really come back. That's in a positive market situation.
At a time when MarketCap fell deeply and there was no sign of money coming back to the market, the entry of money for Altcoins was extremely limited and very dangerous.
Recommendation: Continue to monitor the market and wait for positive signs and clear signals from BTC
Signal: #MA(10), #MA(20), #RSI, #MACD, #BB
Moving Average Convergence / Divergence (MACD)

How to use RSI and MACD In trading?Hi every one
*Definition of RSI:
This indicator Is momentum base indicator.
The biggest difference with momentum is that there are two line which indicate that: Is the price in the oversold or overbought area or not?
We can easily compare the tops and bottoms of every instrument that we like!
There is not much difference between RSI and Stochastic oscillator only that there is one line in RSI!
Remember every Indicators shows the future of the market!
**Full explanation of MACD:
Moving average convergence divergence (MACD) is a trend-following momentum indicator that shows the relationship between two moving averages of a security’s price. The MACD is calculated by subtracting the 26-period exponential moving average (EMA) from the 12-period EMA.
The result of that calculation is the MACD line. A nine-day EMA of the MACD called the "signal line," is then plotted on top of the MACD line, which can function as a trigger for buy and sell signals. you may buy the security when the MACD crosses above its signal line and sell—or short—the security when the MACD crosses below the signal line. Moving average convergence divergence (MACD) indicators can be interpreted in several ways, but the more common methods are crossovers, divergences, and rapid rises/falls.
Moving average convergence divergence (MACD) is calculated by subtracting the 26-period exponential moving average (EMA) from the 12-period EMA.
MACD triggers technical signals when it crosses above (to buy) or below (to sell) its signal line.
The speed of crossovers is also taken as a signal of a market is overbought or oversold.
MACD helps investors understand whether the bullish or bearish movement in the price is strengthening or weakening.
The MACD has a positive value (shown as the blue line) whenever the 12-period EMA (indicated by the red line) is above the 26-period EMA (the blue line) and a negative value when the 12-period EMA is below the 26-period EMA. The more distant the MACD is above or below its baseline indicates that the distance between the two EMAs is growing.
The MACD has a positive value (shown as the blue line) whenever the 12-period EMA (indicated by the red line) is above the 26-period EMA (the blue line ) and a negative value when the 12-period EMA is below the 26-period EMA. The more distant the MACD is above or below its baseline indicates that the distance between the two EMAs is growing.
MACD is often displayed with a histogram which graphs the distance between the MACD and its signal line. If the MACD is above the signal line, the histogram will be above the MACD’s baseline. If the MACD is below its signal line, the histogram will be below the MACD’s baseline. Traders use the MACD’s histogram to identify when bullish or bearish momentum is high.
***RSI VS MACD:
The relative strength indicator (RSI) aims to signal whether a market is considered to be overbought or oversold in relation to recent price levels. The RSI is an oscillator that calculates average price gains and losses over a given period of time. The default time period is 14 periods with values bounded from 0 to 100. MACD measures the relationship between two EMAs, while the RSI measures price change in relation to recent price highs and lows. These two indicators are often used together to provide analysts a more complete technical picture of a market. These indicators both measure momentum in a market, but, because they measure different factors, they sometimes give contrary indications. For example, the RSI may show a reading above 70 for a sustained period of time, indicating a market is overextended to the buy side in relation to recent prices, while the MACD indicates the market is still increasing in buying momentum. Either indicator may signal an upcoming trend change by showing divergence from price (price continues higher while the indicator turns lower, or the other way around.
The DEFINITION of Divergences!
We hope that you've learn something with this post .
Have a nice day and Good luck.

My possible next trade for Bitcoin!!!Bitcoin form a simetric triangle in H8 timeframe, but at the moment, we can't to buy Bitcoin, I hope to buy Bitcoin contract above of $37,700 USD.
s3.tradingview.com
Now, if you look the Daily timeframe, there's 2 indicator that show that Bitcoin it's preparing to continue to bullish movement soon. MACD show us good zone to buy, but not confirmed in the price action, for that, I decide to hope until Bitcoin break up the resistance at $37,700 USD. Meanwhile, in the RSI Bitcoin form a bullish diverngece making lower higher in the indicator and the price action maybe a lower low. That could be an indication that bulls are preparing to make a movement volatile soon!!!
At the moment, my idea it's neutral, but the chances could be bullish!!!

Bitcoin back on the upswing?Over the last few days bitcoin has shown us a number of reasons to indicate that this short term down swing has reversed. The good news is that:
Bitcoin has broken out of the triangle to the upside
The MACD's histogram has been moving in a positive direction since the 19th of May
The RSI left oversold territory and has stayed above 30 - indicating upward momentum
The MACD has crossed the signal line - indicating upward momentum
However, the $40,000 line is not only a historic resistance level, but it is also a psychology significant number. It would be great news if we were to break that 40k level. And as we have learned about Bitcoin, the news can have a MAJOR affect on the price of bitcoin.
There is also the 200 day MA to contend with. There will still be bearish sentiment in the market as long as we are under that level. We are "In a bear market" according to many.
So if Bitcoin does not break 40k, and does not break the 200 day moving average, than we could see another retracement back down.
This is all in the short term though. Since the beginning of the year and continuing now, there has been huge institutional investment into Bitcoin.
I am not sure where bitcoin is headed in the next month or two but, I'd be shocked if it does not hit 100k by the end of the year.
Thank you for reading! Please check out my guides on how to read different indicators linked below. Be sure to Like, Comment, and Follow for more!

Update: Possible pattern in the overall marketThis is purely hypothetical. It appears a pattern has formed in terms of periods of heavy growth and periods of stalling growth. I was able to chart all 3 major indices in aggregate. This is another projection.
A possible catalyst that could cause June to be a turbulent month, while still squeaking out about a 1% gain, would be the June 10th CPI report coming in hot. The labor market and supply chains have seen the worst of inflation and have been passing on the price increases to consumers/customers successfully. If it comes in hot, it could cause the market to rethink the idea that inflation is transitory and cause fear that the Fed will slam on the breaks too soon with their asset purchases.
If and when this happens, the market should adjust and reprice accordingly and then continue its leg higher.
What do you think the markets will do? Will this year be a choppy grind higher or will we see another correction and have a smooth ride from then on? Possibilities are endless and there can always be a macroeconomic event or geopolitical event that could cause changes.

Using the Moving Average Convergence Divergence (MACD)MACD – What it is
The Moving Average Convergence Divergence (MACD) is the momentum indicator that shows the relationship between two different moving averages:
1. The 12 period exponential moving average – On Tradingview it is the Fast Length.
2. The 26 periods exponential moving average –On Tradingview it is the Slow Length.
The MACD line is calculated by subtracting the 26 period EMA from the 12 period EMA.
The Signal line is the 9 period exponential moving average.
These two lines are then plotted on top of each other. These are the two lines you see when you turn on the MACD indicator.
Additionally, there is a histogram that shows the distance between the two lines. Larger bars tell us that the MACD and Signal are further apart.
When it comes to candles, size matters. The larger the candle the more momentum the trend has.
The histogram will turn green when the MACD line is above 0 (bullish) and it will turn red when the MACD line is below 0 (bearish).
Very bearish momentum is shown above. Photo was taken May 23, 2021.
How to use the MACD
The most important thing to know about the MACD is how to read the relationship between the two lines.
I’ve found that the best timeframe to use the MACD with is daily. This is because the MACD is a lagging indicator and using daily data prevents a lot (not all) of false buy and sell signals.
These signals are:
• When the MACD line crosses above the signal line it is a buy signal
• When the MACD line crosses below the signal line it is a sell signal
Additionally, it is best to use the MACD in a trending market; a market with a clearly defined up or down trend.
Using the MACD with trend lines is a very powerful combination.
The reason for this is that if the market is moving sideways, you can see small fluctuations where the MACD and Signal Line cross but the price does not really go anywhere. These are false breakouts.
Therefore, these signals are not automatic buys and sells.
There are ways of confirming the indications from the MACD chart.
One way is a strategy that uses the RSI and MACD together (which is beyond the scope of this text, but I will discuss in my next article).
Another way is to use the MACD with the current trend. So, if you are in an uptrend and then you see a bullish cross, then this is confirmation that you are likely to go higher.
The same is true in reverse.
Also, please note that the cross over happens well after the price either stabilizes or rises. Again, this is because the MACD is a lagging indicator.
Leading Indicator?
Since the MACD and Signal lines are lagging indicators is there something that can be used in a predictive way?
Some traders use the histogram as a way to predict when a reversal will occur.
Since the MACD is a momentum indicator it can show us when sell pressure is alleviating. Meaning it might be a good time to buy.
This doesn’t always work of course, but with good risk management (stop losses) you can often get into a position well before its breakout.
Conversely, it can show you when your long position is running out of steam and can warn you when to get out.
MACD Divergence
Another useful way to use the MACD is to spot divergences.
A bullish divergence, very similar to the RSI, is when the short-term price trend is going down but, the MACD is going up.
Bearish divergence, also very similar to the RSI, is when the price trend is going up but, the MACD is going down.
Trading this way is sometimes not a good idea because you are trading against the trend. Please practice good risk management if you are trading reversals.
Also, notice the buy signal right before the sell signal that is circled. I really want to hammer home the point that the signals are not automatic buys and sells.
Price action is a great way to confirm the reversal (to the up or down side) of a trend. Because simply spotting a divergence does not guarantee the price will follow.
Final thoughts
As you can see there are different ways of successfully using the MACD. I hope I’ve made a few of these ways clear in this beginner guide.
Please let me know if you have any questions and if you like it, please hit the thumbs up and be sure to follow for more.
Links to my Fibonacci Retracement and RSI guides are below.
Thanks for reading!


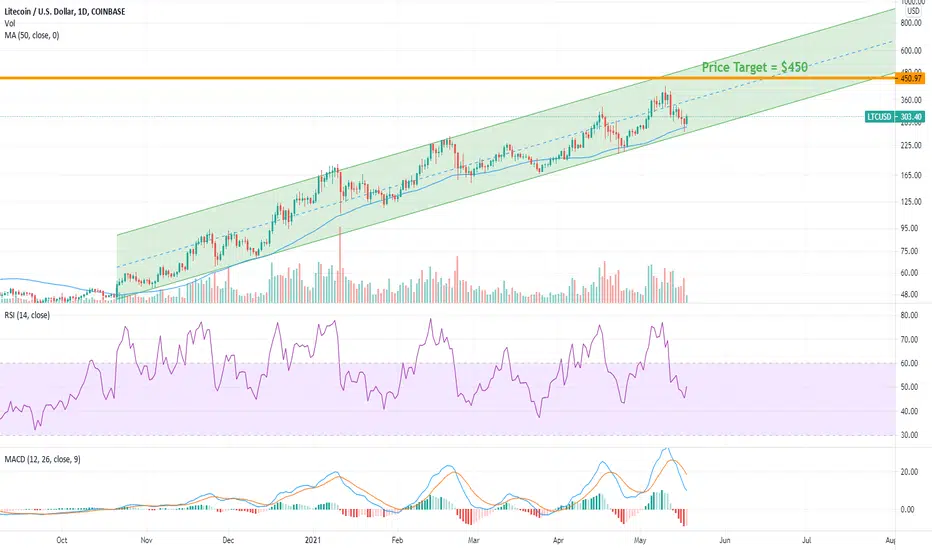
LTC back on the upswing to a new ATHIt has been a rocky week for LTC as it has moved down a good 30% from reaching its ATH. This is to be expected though in the crypto markets and nothing to really worry about considering we are still in a bull market.
LTC has been trading inside a nice upward moving channel since October of last year all while mostly staying above the 50 day MA. The RSI has been making higher lows and the volume has been, on average, a lot higher since the end of March. Barring some FUD Elon tweets that could cause a temporary price dip, or a major BTC move, I see don't see a lot of reasons that LTC will not continue to rise based on the cart.
I would like to see the MACD cross above the signal line on the daily chart. This is really the only bearish sign on this chart. Perhaps even this is going to change soon because, at the time of writing, the histogram seems to have turned towards increasing.
This might not be the fasted play ever, but I think it is reasonable to say that LTC will be above its old ATH and at $450 in the next couple of weeks.
_______________________________________________________
Thank you for reading, please like, follow, and comment! And don't forget to checkout my indicator guides below. More coming soon!
Trade at your own risk.
BTC AFTER BRAEK OUT OF CHANNELNow that Bitcoin has lost its support channel and completed the pullback, we expect more to fall, at least to the second range, but whales are still the main decision maker, which means that the first scenario can happen. What do you think?

EUR turns its directionAs you see, EUR has formed a rising wedge along with two divergences in MACD and RSI.
Also there is a contracting triangle in RSI.
So you can make a good profit!

EGLD up to $300EGLD has been trading in the same channel since February. Good new for us is that this is an ascending channel. Additionally we have testing the middle of the channel multiple times over the last three months and each time we have been rejected. This is not that big of a deal since a move back to the middle of the channel from our current price is a 60% increase in ELGD's price.
Other bullish signals include the MACD crossing the signal line, as well as the fact that the price has stayed over the 50 day MA for the last week. I would however like to see more volume.
A stop loss would be if EGLD closes the day under the channel
Have fun, trade at your own risk.

Sell scalpPresented is a 1 hr chart sell analysis
We currently see an immediate pivot at key resistance 0.70900. If this bar closes out with little retracement we have first confirmation of a reversal.
We can rely on indicators to detect pullbacks. We are seeing RSI trying to breach 50 while SRSI is making its reversal point. MACD and SIGNAL are setting up for a cross back down.
We can enter if this bar closes below 0.70600. Take profit at next key support of 0.70200.
Please comment with thoughts and ideas. Thank you.

Bitcoin MACD signalsPossible Bitcoin Movement based off MACD trend, this could be the massive reversal here. Option 2 it blows through to a new high...

BTC Weekly chart - 100k Bitcoin or 17.5k?Some thoughts on the BTC weekly chart and the 2 basic indicators RSI and MACD
Can fundamentals beat technicals?

CROSSING! 2-YEAR BEAR MACDWe have a MACD crossing on the monthly time frame. After two-years of bear we move into the bull. I'm looking to hold until 2022.
Looking to take profits over the $3.00 range.
Who know?
Good luck.
*Not financial advice*

HNT about to break its ATHHNT has been trading in the same upward channel for all of 2021. It bounced off its lower trend line a week ago and has recovered. It is currently meeting resistance at its previous ATH daily close at $18.50. I expect it to close well above this today and to continue its breakout. MACD is looking good and it seems that HNT is going to $30 in the next couple of weeks. If everything in the market stays bullish over May my price target is at $42; a price that is well within the channel after mid-May.
Stop loss should be set to a daily close under the trend line. 3:1 risk/reward if it goes to $30 or under $15 (in the very short term).
Have fun, trade at your own risk.

BTC Weekly RSI / MACD AnalysisAnalysis of BTC price using RSI and MACD indicators showing weakending strength since the start of the year. Bearish divergence has plauged BTC for several months how much will the influence BTC price in the coming week during the current pull back

BTC Weekly Analysis using RSI and MACDA K.I.S.S. (Keep It Simple Stupid) approach the Bitcoin weekly analysis using MACD and RSI indicators

BTC will rise up. it will be more than $ 55k in next few daysEach time Bitcoin had a sharp downtrend, it applied a tighter uptrend. Also, long bearish shadows indicate that the price trend will soon rise.
The shortening of the MACD oscillator also indicates a sharp uptrend.
The Ichimoku cloud will also turn red in the next day or two. In the red cloud there will be a rising trend.
I hope that in the next few days, the price of bitcoin will rise to 55 thousand dollars and even more.

IF YOU HAVE JUST SAVE ITIN LONG TERM IT WILL RISE.GOOD FUNDAMENTAL GOOD TECHNICAL SO WHAT ELSE DO YOU WANT?!

Beware: Bitcoin show weakness!!! The trend go to reversalAt the moment, looking in Daily timeframe, Bitcoin it's turn bearish in H12 timeframe, but if you look the smal timeframe like H4, it's turn bearish and we see an simetric triangle, but looking more in H12 timeframe, this candlestick it's a bearish signal. Right now, I will going to sell my altcoins and Bitcoin as I know htat if Bitcoin drop, Ethereum, Chainlink, Cardano, XRP, EOS, Tezos and Litecoin drop too.
s3.tradingview.com
In Daily timeframe it's still bearish sentiment as MACD show higher low in the indicator, as we see in H12 timeframe too. So, I have a forecast that Bitcoin can to go back to $45,000 USD. The $45,000 USD level it's very important to support by long term, as Bitcoin continue up. This week, this movement was surprise for us as Bitcoin doesn't have success to make support above of $60,000 USD, maybe I thinking that was that Bitcoin it's overbought, and correction it's neccesary for the health asset.
s3.tradingview.com
This it's the panoramic in 3 Daily timeframe
s3.tradingview.com
And looking the weekly timeframe, it's look bearish, maybe in these weeks, Bitcoin show a consolidation during the past weeks. And then, I hope this movement to $45,000 USD level.
Guys, altcoins and Bitcoin may to reversal the trend, be carefull to trade.


MACD fakeouts Ethereum and LINK for examples
The MACD can be seen to attempt a reversal but is overcome by bullish momentum
An observation
I am long ETH and LINK
