Deep Dive Into Moving Average Convergence Divergence (MACD)🗓 The Moving Average Convergence Divergence (MACD) is one of the most popular momentum indicators in technical analysis. Whether you're a beginner or an experienced trader, understanding how the MACD works can significantly enhance your trading decisions.
📚 Introduction: What Is MACD and Why It Matters
The MACD (Moving Average Convergence Divergence) is one of the most powerful and widely used momentum indicators in technical analysis. It was developed by Gerald Appel in the late 1970s and has since become a staple in the toolkit of traders and investors across markets — from stocks and forex to cryptocurrencies.
At its core, MACD helps traders understand the relationship between two moving averages of an asset’s price, providing insight into both trend direction and momentum strength. By analyzing how these averages converge and diverge, the indicator offers valuable signals for entries, exits, and trend reversals.
What makes MACD especially popular is its versatility — it works well in trending markets, can be used across all timeframes, and combines both leading and lagging components. Whether you're a day trader or a long-term investor, understanding how MACD works gives you an edge in making timely and informed trading decisions.
📚 How the MACD Is Calculated: The Components Explained
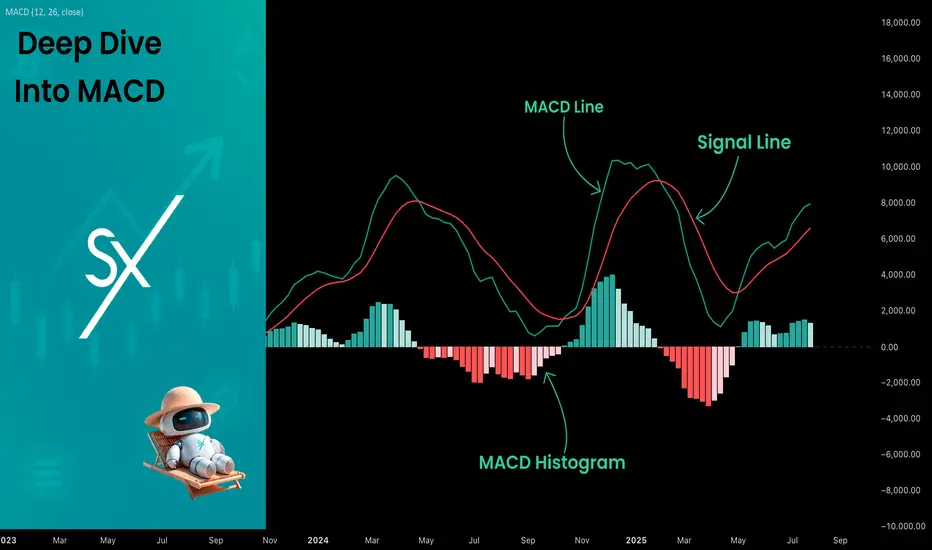
The MACD is built from three core components: MACD line, Signal line and MACD histogram.
🔹 Calculating the MACD Line:
The MACD line is the difference between two Exponential Moving Averages (EMAs), typically 12-period EMA (fast) and 26-period EMA (slow). The formula is:
MACD Line = EMA(12) − EMA(26)
This line captures momentum by tracking how the shorter-term average diverges from the longer-term average. When the MACD line rises, the short-term momentum is increasing faster than the longer-term trend — a sign of bullish acceleration. The reverse implies bearish momentum.
🔹 Calculating the Signal Line:
To reduce noise and provide clearer signals, a 9-period EMA of the MACD line is plotted on top. This is the Signal Line, and it acts as a trigger:
When the MACD line crosses above the signal line → bullish signal (buy)
When the MACD line crosses below the signal line → bearish signal (sell)
Signal Line = EMA(9)(MACD Line)
🔹 Calculating the MACD Histogram:
The Histogram shows the difference between the MACD Line and the Signal Line:
Histogram = MACD Line − Signal Line
It provides a visual representation of momentum strength. The histogram bars expand when momentum strengthens and contract as it fades. It helps you spot shifts in momentum earlier than a basic crossover.
📚 How to Use MACD in Trading Strategies
⚡️MACD Signal Line Crossover
Buy Signal:
MACD Line crosses above the Signal Line from below (bullish crossover)
Preferably when both lines are below the zero line (early in the trend)
Price closes above the long-term trend approximation, in our case we use 200-period EMA
Sell Signal:
MACD Line crosses below the Signal Line from above (bearish crossover)
Preferably when both lines are above the zero line (early in the trend)
Price closes below the long-term trend approximation, in our case we use 200-period EMA
📈Long Trading Strategy Example
1. Wait until MACD line crosses over the Signal line from down to up. In our example we use 1D time frame for BITMART:BTCUSDT.P . Open long trade if point 2 will be completed.
2. Price candle shall be closed above the 200-period EMA. This is long-term trend filter to increase the probability that trades will be open only in the direction of the main trend.
3. Close the long trade when the MACD line crosses under the Signal line. This is an approximation that short-term impulse is over and correction is about to start.
In our case we have +20% return on this long trade, but, please, notice that we have not used initial stop-loss in this strategy. Trade was closed according to the technical condition, this approach can violate the risk management rules, but also can be applicable if you trade the amount ready to lose using this strategy. We will talk about stop-loss later.
📉Short trading strategy example
1. Wait until MACD line crosses under the Signal line from up to down. In our example we use 1D time frame for BITMART:ETHUSDT . Open short trade if point 2 will be completed.
2. Price candle shall be closed below the 200-period EMA. This is long-term trend filter to increase the probability that trades will be open only in the direction of the main trend.
3. Close the short trade when the MACD line crosses over the Signal line. This is an approximation that short-term impulse is over and correction is about to start.
In this case we have +15% return on the short trade. Again, strategy used the technical condition to close the trade and now let's cover how to place the stop-loss. There is no right answer how to use stop-losses. The first and the most obvious way to place stop-loss is using recent swing low/high, but the problem is that all traders are seeing them and do the same. Price tends to reach such levels to collect liquidity.
Another one way to place stop-loss is using the signal candle's high/low. This is so-called 1 candle stop-loss. Usually it's very tight and can allow to have the fantastic risk to reward ratio, but we are now recommend to use it if you are not a professional trader because win rate of such strategy decreases.
Third approach in placing stop-loss which we often use in our algorithmic strategies is the Average True Range (ATR). ATR is the volatility measurement, it allows to take into account the current volatility. Sometimes it helps to avoid the stop-loss hit when trade finally goes in your direction. You can just simply subtract (in case of long trade) or add (in case of short trade) ATR value to the entry price and obtain the dynamic stop loss based on current market condition. Also multiplier can be used for ATR. You shall choose the approach which is more comfortable for you, backtest all these approached to make your choice.
🧪Important: we used the long signals only below the zero-line and short signals above it in the attempt to catch the beginning of a trend and have large potential move. On the picture below you can see the same BITMART:BTCUSDT.P , but what will happen if we open long on the lines crossover above zero line? This trade will not be profitable because of restricted potential.
⚡️MACD Zero Line Crossover
Buy Signal:
MACD Histogram crosses above the zero line (momentum shifts from bearish to bullish)
Price closes above the long-term trend approximation, in our case we use 200-period EMA
Sell Signal:
MACD Histogram crosses below the zero line (momentum shifts from bullish to bearish)
Price closes below the long-term trend approximation, in our case we use 200-period EMA
📈Long Trading Strategy Example
1. Wait until MACD Histogram crosses over zero line. Open long trade if point 2 will be completed.
2. Price candle shall be closed above 200-period EMA. This is long-term trend filter to increase the probability that trades will be open only in the direction of the main trend.
3. Take profit when price reaches 3:1 risk to reward ratio according to the stop-loss from point 4.
4. Stop-loss shall be placed below recent swing low. This point can be discussed, you can use any stop-loss technique described earlier in this article. We demonstrate the simplest one, the key here is using at least 3:1 RR.
📉Short trading strategy example
1. Wait until MACD Histogram crosses under zero line. Open short trade if point 2 will be completed.
2. Price candle shall be closed below 200-period EMA. This is long-term trend filter to increase the probability that trades will be open only in the direction of the main trend.
3. Take profit when price reaches 3:1 risk to reward ratio according to the stop-loss from point 4.
4. Stop-loss shall be placed above recent swing high. This point can be discussed, you can use any stop-loss technique described earlier in this article. We demonstrate the simplest one, the key here is using at least 3:1 RR.
⚡️MACD Divergence Strategy
MACD Divergence is a strategy that helps traders identify potential reversals in market direction before they become obvious on the price chart. This makes it a favorite tool among swing traders and crypto enthusiasts looking to catch major moves early.
But what exactly is a divergence? In simple terms, divergence occurs when price and momentum (MACD) are moving in opposite directions — signaling that the current trend may be losing strength and preparing for a reversal. There are two main types of divergence.
🐂 Bullish Divergence
Price makes a lower low
MACD Histogram makes a higher low
This suggests that while price is still falling, downward momentum is weakening. The bears are losing control, and a bullish reversal may be near. Trading signal is very simple, when bullish divergence happens wait for the first increasing column on MACD histogram and open long trade. Place stop-loss under recent swing low and take profit at 3:1 RR.
🐻Bearish Divergence
Price makes a higher high
MACD makes a lower high
This suggests that while price is still falling, downward momentum is weakening. The bears are losing control, and a bullish reversal may be near. Trading signal is very simple, when bearish divergence happens wait for the first decreasing column on MACD histogram and open short trade. Place stop-loss above recent swing high and take profit at 3:1 RR.
🧪 Important hint: MACD histogram shall cross the zero line between two lows/high to create the most reliable divergence signals. We are not recommend to use it without zero-line crossover to decrease number of false signals.
📈Long Trading Strategy Example
1. MACD Histogram shall create higher low.
2. Price shall create lower low.
3. MACD Histogram shall cross the zero line between lows.
4. MACD Histogram shall show the first increasing column.
5. Put stop-loss under the recent swing low.
6. Put take profit at 3:1.
🧪 You can enhance the long signal with the MACD Line divergence. In our case we have both divergences: with MACD Histogram and MACD Line.
📉Short trading strategy example
1. MACD Histogram shall create lower high.
2. Price shall create higher high.
3. MACD Histogram shall cross the zero line between lows.
4. MACD Histogram shall show the first decreasing column.
5. Put stop-loss above the recent swing high.
6. Put take profit at 3:1.
🧪Divergence is extremely strong signal, but when price continue it's move in the direction of a trend and it's not reversing it can also be the signal for the trend continuation. This situation is called "Baskerville Hound" signal, this name was given by famous trader Alexander Elder. We don't recommend to use it for novice traders, but it's useful to know about it.
📚 Conclusion
The Moving Average Convergence Divergence (MACD) is more than just a crossover tool — it's a powerful momentum indicator that offers deep insight into the strength, direction, and timing of market trends. By understanding how the MACD line, Signal line, and Histogram interact, traders can uncover early trend shifts, spot momentum divergences, and time entries and exits with greater confidence.
Whether you're a short-term trader using fast crossovers for scalping or a long-term investor watching for weekly divergences, MACD can adapt to your style when used thoughtfully. Like all indicators, it works best when combined with price action, support/resistance levels, and other indicators — not in isolation.
Ultimately, mastering MACD is not about memorizing patterns, but about learning to read the story of momentum that unfolds beneath the surface of price. With disciplined application and practice, MACD can become a reliable compass in your trading strategy.
Macdcrossover
$SOL Loses Key Support | Eyes on $140 & $95 Zones📉 CRYPTOCAP:SOL Loses Key Support | Eyes on $140 & $95 Zones
🕵️♂️ On the daily timeframe, #Solana has officially lost its key support near $140, which previously acted as a strong bounce zone. A failure to reclaim this level could open the gates for a deeper drop toward the $95–$100 support range.
📊 Indicators signal downside:
RSI is trending downward
MACD shows a bearish crossover
Stochastic RSI confirms continued selling pressure
⚠️ Macro pressure adds fuel to the fire: August 1st tariff tensions, with expected news from Trump on charging Paris, are weighing down global risk assets. Historically, August tends to be a bearish month for crypto markets.
🎯 Key Levels to Watch:
Immediate Resistance: $140
Major Support: $95–$100
🧠 Trade wisely and manage risk accordingly.

HSI dipping, traders are flipping,stay Zen - Index is yoga-ing!Hello everyone!
Today HK50 PEPPERSTONE:HK50 D open at 25350, Hi:25446 Lo:25164
IMO: Deep retracement is happening with profit taking from futures expiring tomorrow for traders & waiting for catalysts for talks next week.
For 4H - Index moving closer to Gravity Trend Line - look out for entry for swing (using shorter tf to entry).
At point of writing ✍️: the HK50 $PEPPERSTONE uptrend mode is on track and now in the retracing mode.
currently on D Chart -
🗝️ Resistance Level : 25300
Support Level : 24950
Support level 24558 (MA30)
🗝️ Strong Support Level : 24048 (Gravity Trend Line)
1H Chart HK50 $PEPPERSTONE
If today not able to close 25304 (25335 HSI), it's likely a deep retracement.
Shor term pullback -for swing trade and for mid-longer term it's still on bull track. Most likely people profit taking before the HSI futures expires tomorrow.
Macro view - Index continue to be Bullish. Well, markets cooled a bit waiting for details from the ongoing US-China trade talks early August'25.
Higher Hi🚩point marked in Chart HK50 $PEPPERSTONE
21May2025 -23909
11June2025 -24430
25June2025 -24531
16Jul2025 - 24842
18Jul2025 - 25052
24Jul2025 - 25729
?? ??2025 - 26163 Revised Target
The HSI Index HSI:HSI
At point of writing ✍️ Index is being sucked towards to D GravityLine - 24085; it fall below the sideway box.
If it doesn't close above the key support level this week, the deep retracement is happening.
🧨🧨🧨Pay attention and cautious.
🗝️ Next Resistance Level : 25350
🗝️ Next Support Level : 24900-25200
🗝️ Strong Support Level : 24300-24750
Let's follow your own zentradingstrategy , continue to trade; Observe your emotions as you would the clouds—passing, shifting, never you.— Mindfulness helps you respond, not react, in volatile markets and moments.
Be ease at trading!
** Please Boost 🚀, FOLLOW ✅, SHARE 🙌 and COMMENT ✍ if you enjoy this idea!
Share your trading journey here to encourage the community and friends who pursing the same journey.

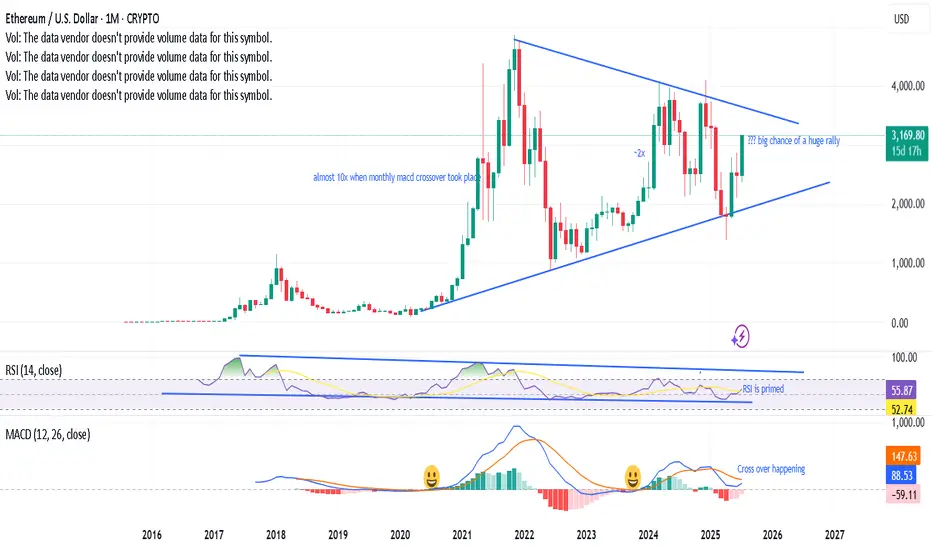
Monthly MACD crossover taking place, a prabolic rise?Last 2 times, when the monthly MACD cross over has happened, ETH has gone bonkers. A third one is on the verge of happening, RSI has enough room with a symmetrical triangle with bullish momentum - looks like a big rally is in the near horizon. Fingers cross.
Dont predict&anticipate the market - ask indicators for hints! Hello everyone! how was the HSI trade so far?
Apologies for not updating as I was allowing myself to take a pause journaling my trade also to pay attention on my own personal growth journey. However, am continue to trade HSI in sustainable and profitable way and have had trying and test using different combination of indicators that bring quite positive results since.
Sharing this with anyone that reading this.
Please note that this is just for my own experiences and please DYODD.
For Swing Trade Test: (some steps to consider for entry set up - setting your time frame)
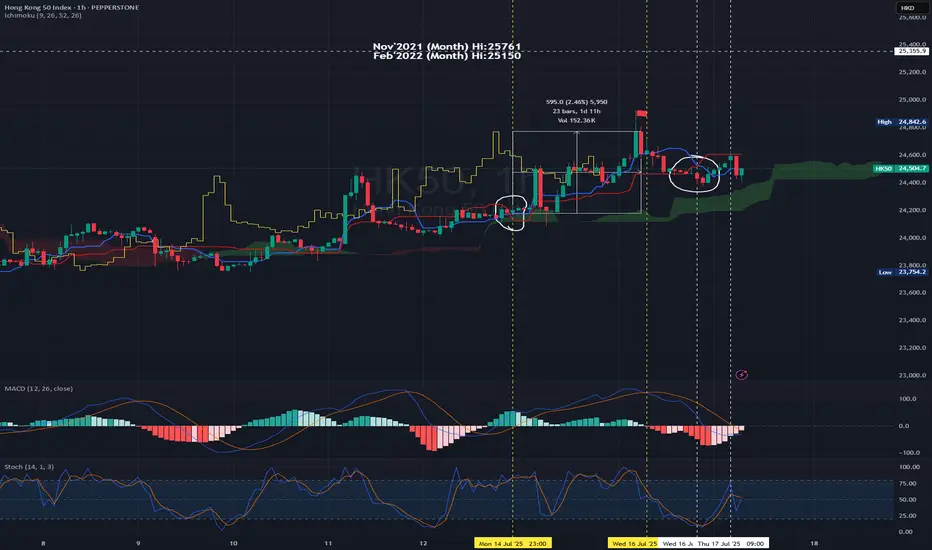
E.g using 1H Chart - 14Jul2025 23:00
MACD - entering the above zero line - it breaks above zero level on the next candle. Turned bullish confirmation.
Using Ichimoku Cloud for trend confirmation.
Once the MA9>MA26 the blue line crosses above red line (circled in white). This is a bullish confirmation and it is trading above green cloud.
You may pay attention to set your entry point.
Set Up : on the next candle open - you may open Long position - 24204.90 Set SL with R/R Ratio 1:1 or 1:1.1-1.25 (or in accordance to your risk appetite or carry out backtest and to be realistic)
Taking Profit : You may pay attention to be more aggressive to TP only when the MACD is forming DeadCross i.e 16Jul2025 11:00 (using the same timeframe chart).
For the reversed side it's the same methodology. But it's recommended to Short if and only if when the candles are closed below cloud + MACD is on the bearish zone.
So, in this case, I will not open short position as it's not the normal underlying HSI trading hour, so we wait till the underlying normal trading hour commence.
Today HK50 PEPPERSTONE:HK50 open at 24567, you may decide if you would to short and setting SL and TP.
From chart, you may open short position with R/R : 1.1.1 (TP : 24:400; SL : 24772) Entry: 24596 (the next hour candle at 10:00, of course you may cross check with shorter time frame to 'catch the high' 😂)
Trade for profit requires persistency and consistence.
There is quite a wide range to trade in between the movement.
Buy into Support Sell at resistance.
Set your TP/SL & protect your capital.
at point of writing ✍️: the Index uptrend mode is on track.
currently on D Chart -
🗝️ Resistance Level : 24600-24700
🗝️ Support Level : 24370-24400
🗝️ Strong Support Level : 24030-24300
Higher Hi🚩point marked in Chart
21May2025 -23909
11June2025 -24430
25June2025 -24531
16Jul2025 - 24842
?? ??2025 - 25907 Target
Opinion: continue Bullish and shall breaks the recent Hi of 24900 and target could break 25200-25750 pretty soon (the Gravity Line upper band).
The Index is now on the intermediate bullish trend (not far off from Gravity line and not yet touch the Gravity Upper band or beyond for D chart) - Shall publish this indicator.
From previous posts:-
W Chart:- HSI continues its Bullish mode with strong pullback! Recovery could expected to see in end Jun - early Jul'25.
14Jul2025 -
at point of writing ✍️:
Perhaps it shouldn't been said as recovery but continue the uptrend.
As we can notice from the latest chart it seems to continue its uptrend momentum even MACD have had curving down after deadcross formed 12May25.
The MACD signal line staying above zero level.
Continue the Long call for HSI with the forecast and repetitive of history the next 4-6 weeks might be a good profit to hold Long position.
🚨However, please take note that the index is moving beyond the Gravity upper brand on W chart which we should monitor closely to TP and enter again for healthy retracement.
🎯 Reminder: For long term (6-18 months) continue to accumulate China & HKG for the potential upside for the year! All retracement is a good entry point. Again, everything is impermanence. Manage your risk, position sizing. Take only the risk that you can afford.
For HSI HSI:HSI
Recent Hi : 16Jul2025 - 24867.81 (trying to test the resistance at 19March2025@24874)- this ¬6.58pts seems took quite a while to break. Let's be patience.
🔎 DYODD and don't listen to anyone.
Invest in yourself, do some study and learn along the way while you trying to verify or finding the answer if to start invest in CHN/HKG markets.
If you don't know how or where, you may ask Deepseek/Chatgpt for most reputable Trading courses nearest to you.
Let's follow your own zentradingstrategy , continue to trade; a strategy is a raft—cross the river, but do not carry it on your back forever — Stay flexible. No method is permanent. Adapt, let go, grow.
** Please Boost 🚀, FOLLOW ✅, SHARE 🙌 and COMMENT ✍ if you enjoy this idea!
Share your trading journey here to encourage the community and friends who pursing the same journey.
MOIL - Potential for 500 target with Crown pattern in makingMOIL has confirmation for Bullish crown formation .
It has closed above 20 & 50 EMA on day time frame.
Moreover MACD is signal line has turned positive.
With all this it has potential for following targets;
360 / 400 / 450 / 500
SL: 315

$NVDA Hits Key Inflection Zone – Breakdown or Breakout?📍 We’ve arrived.
NASDAQ:NVDA has reached the key reversal zone where sellers previously took control. This is the third touch, and markets rarely leave these zones without a fight.
🔍 Technical Setup:
Price has retraced to prior breakdown level.
MACD is trying to cross bullish — momentum building.
Sellers should defend here… but the recent AI narrative and Gulf chip deals could fuel a breakout.
If sellers fail to show up, we may blow straight through this level toward new highs.

HSI on the climb—ride the waves with your own strategy!6May2025
Hello everyone! how was the HSI trade so far?
From the previous updates trust everyone likely knows how the movement of the Index.
Paying attention on how it moved and the forecast of futures movement seems predicted. Of course, some times it may not go according to what you forecasted. Hence, to develop your own trade plan is essential.
From previous posts:-
MACD - Deadcross formed 20/3/2025 on D Chart.
MACD - Goldencross formed 21Apr2025 on D chart, although still within bearish zone but it did a short bull run since then; opened at 21015 on 22Apr and as of writing 22613; it gives around 1598pts ~7.6% gained.
CAPITALCOM:HK50
Fast forward to now:-
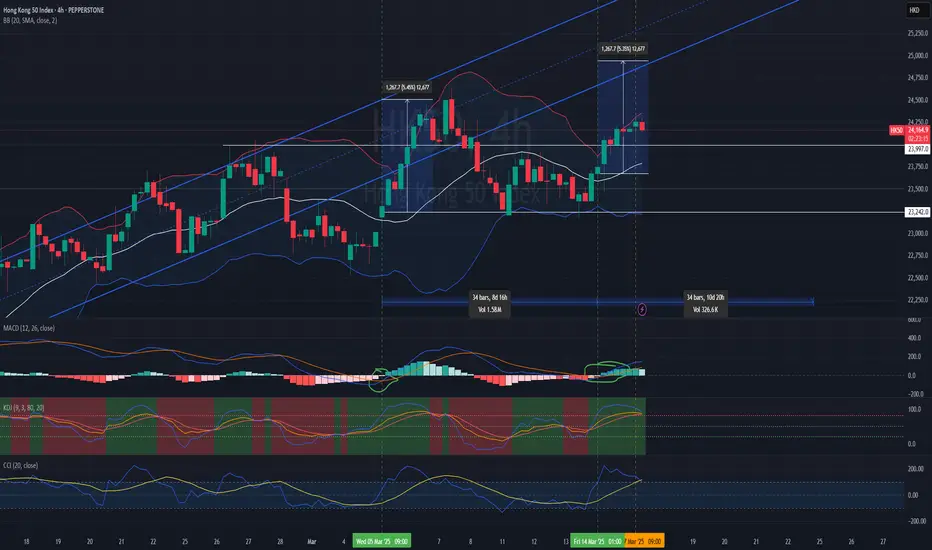
4H chart
at point of writing ✍️: the Index uptrend mode is on track again.
Trade for profit requires persistency and consistence. The constancy is kind of boring.
Buy into support Sell at resistance.
Set your TP/SL & protect your capital.
currently on D Chart -
20EMA:22065; 50EMA:22080 (both are sticking together at the moment and curving up)
🚨 as of ✍️ :
🗝️ Resistance Level : 22700-22730
🗝️ Support Level : 22360-22400
🗝️ Strong Support Level : 21950-21990
W Chart:- HSI:HSI
HSI continues its Bullish mode with strong pullback! Recovery could expected to see in end Jun - early Jul'25.
17Mar2025 -
24Mar2025 -
7Apr2025 -
6May2025 -
Continue the Long call for HSI:HSI with the forecast and repetitive of history the next 4-6weeks might be a good profit taking level; hold any long position and manage the risk as well.
Target to take profit: 24630-24910 (it may break 25000 level, and paused at 25300 strong resistance level, you may crosscheck with Month chart for the Bullish trend; last week the MACD signal line break above the zero level.)
For current markets condition, the CHN & HKG continue to be volatile with the continuing noise from tariff and on macro the numbers could be mixed.
🎯 Reminder: For long term (6-18 months) continue to accumulate China & HKG for the potential upside for the year! All retracement is a good entry point. Again, everything is impermanence. Manage your risk, position sizing. Take only the risk that you can afford.
🔎 DYODD and don't listen to anyone. Invest in yourself, do some study and learn along the way while you trying to verify or finding the answer if to start invest in CHN/HKG markets. If you don't know how or where, you may ask Deepseek/Chatgpt for most reputable Trading courses nearest to you.
Stay sharp, trade smart, and let consistency be your superpower. 📈🍵📙
Continue to trade; continue your life as it is!
Happy Trading!
** Please Boost 🚀/LIKE 👍, FOLLOW ✅, SHARE 🙌 and COMMENT ✍ if you enjoy this idea! Share your trading journey to encourage peoples who pursing the same journey.

Bitcoin Bubble at $70K? Prepare for ImpactBitcoin recently faced strong rejection near the $81,000 level, forming a potential double top pattern on the higher timeframes. This classic bearish reversal setup is now playing out, as price action has begun to decline from the second peak.
Adding to the bearish confluence, the MACD has confirmed a bearish crossover, signaling weakening momentum and a potential trend reversal. The rejection at $81K aligns with historical resistance, and price has failed to break above it despite multiple attempts.
Going forward, there are two key scenarios to watch:
Retest of the $76,700 zone – A minor support area that could offer a bounce or consolidation before the next move.
Deeper pullback towards $70,000 – If bearish pressure continues, CRYPTOCAP:BTC could head lower to test this psychological and technical support level.

what's next after historic plunged? what's next after historic plunged?
HSI needs to claw its way back - resistance now takes the spotlight!
🚨🚨🚨
🔎🎯 Always ask before you open a position, what's your time frame!?
Follow this principle for your trade for entry and exit so you will not lost on that particular trade. Happy trading everyone! 💰
From previous posts:-
MACD - Deadcross formed 20/3/2025 on D Chart.
4H chart:
at point of writing ✍️: the Index uptrend mode is broken where we have been reviewing the movement of the Index.
For this week trade plan: Most likely short the index for days to few weeks until get confirmation of reversal back to uptrend.
For swing trade: Buy into support Sell at resistance.
Set your TP/SL & protect your capital.
PEPPERSTONE:HK50
On 7Apr25 - special Monday, HSI dropped 13.22% ; 3021.51pts to close at 19828.30. The Index below its 20MA@22814 (currently); 50MA@22509 (currently)
This is the historic largest single day plunge since 1997 Asian Financial Crisis.
Historically, the HSI has experienced significant single-day drops during major financial crises. For instance, that was on October 28, 2008, amid the global financial crisis, the HSI fell by 12.7%, marking its biggest single-day percentage drop since 1997.
Well, human beings shape history. While it may not repeat the same way, but often returns in similar forms and familiar contexts. We are the innovative and creativity creatures on this earth, hence we are free to craft the stories eventually become history.
PEPPERSTONE:HK50
currently the 20MA:22581; 50MA:22423
🚨 as of ✍️ :
🗝️ Resistance : 20632
Resistance Level : 20143 20266
Support Level : 18830 19450
🗝️ Support : 18751
W Chart:- HSI continues its Bullish mode with strong pullback! Recovery could expected to see in end Jun - early Jul'25.
17Mar2025 -
24Mar2025 -
7Apr2025 -
For current markets condition, the CHN & HKG can be volatile with the continuing noise from tariff.
🎯 Reminder: For long term (6-18 months) continue to accumulate China & HKG for the potential upside for the year! All retracement is a good entry point.
🔎 DYODD and don't listen to anyone. Invest in yourself, do some study and learn along the way while you trying to verify or finding the answer if to start invest in CHN/HKG markets. If you don't know how or where, you may ask Deepseek/Chatgpt for most reputable Trading courses nearest to you.
Let's follow our own zentradingstrategy , continue to trade and zen with 📙 and 🍵 for profits.
** Please Boost 🚀/LIKE 👍, FOLLOW ✅, SHARE 🙌 and COMMENT ✍ if you enjoy this idea! Share your trading journey to encourage trading and investment buddies.

HSI testing resistance levels —will it break through or bounced?25/03/2025
🚨🚨🚨
HSI resistance is being tested for short-term!
Investors tend to take profit towards quarter end.
HSI:HSI
MACD - Deadcross formed 20/3/2025.Resistance 24750-24600 level.
4H chart: PEPPERSTONE:HK50
at point of writing ✍️: the Index uptrend mode is paused and moving out of bound from the uptrend channel.
MACD : moving below zero line - Bearish mode.
KDJ: below 30 level in the bearish zone. Hopefully the divergence cycle completing soon for a strong reversal.
BB - ranging at lower BB; mid-line:23986 (this is your 🗝️ level for your long/short TP/SL level)
Set your TP/SL and let the markets works.
For this week trade plan: Most likely short the index for days to few weeks until get confirmation of trendline back to uptrend channel. Buy into support Sell at resistance. Set your TP/SL.
🚨 as of ✍️ :
Support/Resistance Levels :
22979
23030
23242(23374)
23526
23997
24385
24586
24648
24945
🗝️🗝️🗝️Level: 23526-23620
HSI continues its Bullish mode.
W Chart:-
17Mar2025 -
24Mar2025 -
📰 another -ve news, but this might be distraction. 🚨
www.tradingview.com
Shares in Hong Kong slumped 487 points or 2.0% to 23,417 on Tuesday morning, reversing gains from the prior session amid concerns over U.S. recession risks and China’s deflation threat.
www.tradingview.com
** Hong Kong's benchmark Hang Seng Index declined 2.2%, and the Hang Seng Tech Index
HSTECH lost 3.5%.
For current markets condition, the CHN & HKG can be volatile with the continuing noise from tariff.
🎯 Reminder: For long term (6-18 months) continue to accumulate China & HKG for the potential upside for the year! All retracement is a good entry point.
🔎 DYODD and don't listen to anyone. Invest in yourself, do some study and learn along the way while you trying to verify or finding the answer if to start invest in CHN/HKG markets. If you don't know how or where, you may ask Deepseek/Chatgpt for most reputable Trading courses nearest to you.
Let's follow our own strategy and zen with 📙 and 🍵 for profits.
** Please Boost 🚀/LIKE 👍, FOLLOW ✅, SHARE 🙌 and COMMENT ✍ if you enjoy this idea! Share your trading journey to encourage the trading buddies.

Mastering MACD- Complete Guide- 10 ways to trade itThe Moving Average Convergence Divergence (MACD) is a versatile indicator that can help traders navigate the markets with precision. From trend identification to momentum assessment, the MACD provides multiple actionable insights. In this educational post, we’ll explore the key ways to use MACD effectively, with an example illustration accompanying each strategy.
________________________________________
1. Signal Line Crossovers
The most common use of MACD is the signal line crossover, which identifies potential shifts in market momentum:
• Bullish Signal: When the MACD line (fast-moving) crosses above the signal line (slow-moving), it suggests upward momentum is increasing. This can be an entry signal for a long trade. Bullish crossovers often occur after a period of consolidation or a downtrend, signaling a reversal in market sentiment.
• Bearish Signal: When the MACD line crosses below the signal line, it signals downward momentum, often triggering a short-selling opportunity. Bearish crossovers can occur during retracements in an uptrend or at the start of a bearish reversal.
How to Use: Look for confirmation from price action or other indicators, such as a breakout above a resistance level for a bullish signal or a breakdown below support for a bearish signal. It's essential to avoid acting solely on a crossover; consider volume (stocks, crypto), candle stick formations and other market conditions.
Example: A bullish crossover on the daily chart on TRADENATION:XAUUSD indicates a potential buying opportunity as the price begins to rise. Add a stop-loss below recent lows to manage risk and look for a 1:2 risk:r eward in the next resistance.
________________________________________
2. Zero Line Crossovers
The MACD’s zero line acts as a boundary between bullish and bearish momentum, making it a valuable trend confirmation tool:
• Above Zero: When the MACD line moves above the zero line, it confirms an uptrend, as the fast-moving average is above the slow-moving average. Sustained movement above zero often indicates a strong bullish trend.
• Below Zero: A MACD line below zero reflects a downtrend, indicating bearish market conditions. Persistent movement below zero confirms bearish momentum.
How to Use: Use the zero line crossover to validate trades based on other signals, such as candlestick patterns or trendline breaks. The crossover can act as a second layer of confirmation for existing trade setups.
Example: MACD on a crypto pair crosses above the zero line, confirming the start of a new bullish trend. Traders can combine this with volume analysis to ensure strong market participation.
________________________________________
3. Histogram Analysis
The histogram represents the distance between the MACD line and the signal line, offering insights into momentum:
• Expanding Histogram: Indicates strengthening momentum in the direction of the trend. Larger bars show increasing dominance of bulls or bears.
• Contracting Histogram: Suggests weakening momentum, signaling a possible reversal or consolidation. Smaller bars indicate a loss of trend strength.
How to Use: Monitor the histogram for early signs of momentum shifts before a crossover occurs. The histogram can act as a leading indicator, providing advanced warning of potential changes in price direction.
Example: A shrinking histogram in a forex pair signals that the bullish momentum is losing steam, warning traders of a possible retracement. This can be a cue to tighten stop-loss levels or take partial profits. Conversely, an expanding histogram during a breakout confirms the strength of the move.
________________________________________
4. Identifying Divergences
MACD divergences are powerful tools for spotting potential reversals:
• Bullish Divergence: Occurs when the price makes a lower low, but the MACD forms a higher low, signaling weakening bearish momentum. This often precedes a trend reversal to the upside.
• Bearish Divergence: Happens when the price makes a higher high, but the MACD forms a lower high, indicating diminishing bullish strength. This suggests a potential reversal to the downside.
How to Use: Combine divergence signals with support or resistance levels to enhance reliability. Divergences are most effective when spotted at major turning points in the market.
Example: On a TRADENATION:EURUSD chart, a bearish divergence signals an upcoming price reversal from an up trend to a down trend.
________________________________________
5. Trend Confirmation
MACD confirms trends by staying consistently above or below the zero line:
• Above Zero: Indicates a strong uptrend. Look for pullbacks to enter long trades. The longer the MACD remains above zero, the stronger the trend.
• Below Zero: Reflects a persistent downtrend. Use rallies as opportunities to short. A sustained period below zero reinforces bearish dominance.
How to Use: Use MACD’s trend confirmation alongside other trend-following tools like moving averages or Ichimoku clouds. Ensure that market conditions align with the broader trend.
Example: Combining MACD trend confirmation with moving averages helps traders stay on the right side of the trend in a stock market index. For example, buy when both MACD and a 50-day moving average indicate an uptrend. Exit trades when the MACD begins to cross below zero or shows a divergence.
________________________________________
6. Overbought and Oversold Conditions
Although MACD is not traditionally an overbought/oversold indicator, extreme deviations between the MACD line and the signal line can hint at stretched market conditions:
• Overbought: When the MACD line is significantly above the signal line, it may indicate a price correction is imminent. This often occurs after an extended rally.
• Oversold: When the MACD line is well below the signal line, it suggests a potential rebound. Such conditions are common following sharp sell-offs.
How to Use: Monitor extreme readings in conjunction with oscillators like RSI for added confidence. Look for reversals near key support or resistance levels.
Example: An extended bearish move with a large MACD-signal line gap warns traders of a potential price correction. This can signal an opportunity to exit. Pair this observation with a bullish candlestick pattern to confirm the move (in this example morning star)
________________________________________
7. Combining MACD with Other Indicators
MACD works best when paired with complementary indicators to provide a more comprehensive market analysis:
• RSI (Relative Strength Index): Use RSI to confirm momentum and overbought/oversold conditions.
• Bollinger Bands: Validate price breakouts or consolidations with MACD signals.
• Support and Resistance: Use MACD signals around key levels for confluence.
How to Use: Wait for MACD signals to align with other indicator readings to improve accuracy. Cross-validation reduces false signals and increases confidence in trades.
Example: A bearish MACD crossover near a key resistance level reinforces a short-selling opportunity.
________________________________________
8. Multi-Timeframe Analysis
Using MACD across different timeframes strengthens trade signals and provides context:
• Higher Timeframe: Identify the broader trend to avoid trading against the market. For instance, if the daily chart shows a bullish MACD, focus on long trades in lower timeframes.
• Lower Timeframe: Pinpoint precise entries and exits within the higher timeframe’s trend. The MACD on lower timeframes can help fine-tune timing.
How to Use: Align MACD signals on both higher and lower timeframes to confirm trade setups. This alignment minimizes the risk of false signals.
________________________________________
9. Customizing MACD Settings
Traders can tailor MACD settings to suit different trading styles and timeframes:
• Shorter Periods: Provide more sensitive signals for scalping or day trading. Shorter settings react quickly to price changes but may generate more false signals.
• Longer Periods: Produce smoother signals for swing trading or position trading. Longer settings are less responsive but more reliable.
How to Use: Experiment with different settings on a demo account to find what works best for your strategy. Adjust settings based on the volatility and nature of the asset.
Example: A scalper uses a 5, 13, 6 MACD setting to capture quick momentum shifts in the market, while a swing trader sticks with the standard 12, 26, 9 for broader trends. Compare results across different markets to refine the approach.
________________________________________
10. Crossovers or Divergence at Key Levels
Combining MACD crossovers with price action levels enhances the reliability of trade signals:
• Horizontal Levels: Use MACD signals to confirm reversals or breakouts at support and resistance levels. Crossovers near these levels are often more reliable.
• Fibonacci Retracements: You can combine MACD with retracement levels to validate potential entries or exits. Confluence with retracements adds weight to the signal.
How to Use: Wait for MACD signals to align with key price levels for higher probability trades. Confirmation from candlestick patterns or volume (stock and crypto) adds further credibility.
Example: A bullish MACD divergence aligns with a strong support level, signaling a strong buy setup. Add confirmation with a candlestick reversal pattern, such as a piercing pattern in our case, to enhance precision.
________________________________________
Conclusion:
The MACD indicator’s flexibility makes it a must-have tool for traders of all styles. By mastering these strategies and integrating them in your trading, you can elevate your trading decisions.
Disclosure: I am part of Trade Nation's Influencer program and receive a monthly fee for using their TradingView charts in my analyses and educational articles.

HSI charging forward, but watch that resistance!Helloy everyone,
Yesterday the Index performed quite well; bullish.
Trying to go back to the uptrend channel.
PEPPERSTONE:HK50
at point of writing ✍️:
MACD - Deadcross formed. Sell/Short at resistance level 24730-24650
BB - 23953(lower BB) mid-line:24350 (this is your 🗝️ level for your long/short TP/SL level)
Quote from 17/3/2025 post
For this week trade plan: Buy into support Sell at resistance. Set your TP/SL.
🚨 as of ✍️ :
🗝️ Level : 22979-23242(23374)- 23997- 24385 - 24586 - 24648 - 24945
To retest 24385 again.
Set your TP/SL, let the market do its thing, and ride the trend with confidence! Manage your risk/reward (r/r).
HSI continues its Bullish mode.
HSI:HSI
W Chart:-
📰 another +ve news, but this might be distraction. 🚨
www.tradingview.com
🎯 Reminder: Continue to accumulate China & HKG for the potential upside for the year! All retracement is a good entry point.
🔎 DYODD and don't listen to anyone. Invest in yourself, do some study and learn along the way while you trying to verify or finding the answer if to start invest in CHN/HKG markets. If you don't know how or where, you may ask Deepseek/Chatgpt for most reputable Trading courses nearest to you.
** Please Boost 🚀/LIKE 👍, FOLLOW ✅, SHARE 🙌 and COMMENT ✍ if you enjoy this idea! Share your trading journey to encourage the trading buddies.
While wait for the markets cook, you may zen with 📙 and 🍵because stress won’t make the candles move! 🚶
Happy Trading!

Was the break over? HSI bulls are back on the field and ready?Hello everyone, happy Monday!
Last week movement, HSI retraced consecutive 4 trading days and slight recover on Friday yet closed with loss 271pts; -1.12% for the week of 10 Mar 2025. However, YTD it has logged an increased of +4216.69pts; +21.02%. HSI:HSI
MACD - Goldencross was marked in Green (5Mar25; 14Mar25)
BB - Currently trading within upper BB channel.the Mid-line 4H chart at 23789 at point of writing ✍️.
For this week trade plan:
Buy into support Sell at resistance. Set your TP/SL.
🚨 as of ✍️ :
🗝️ Level : 22979-23242(23374)- 23997- 24385 - 24586 - 24648 - 24945
To retest 24385 again.
The Index continues its Bullish mode.
With some catalyst news to support Long call.
www.tradingview.com
🎯 Reminder: Continue to accumulate China & HKG for the potential upside for the year! All retracement is a good entry point.
🔎 DYODD and don't listen to anyone. Invest in yourself, do some study and learn along the way while you trying to verify or finding the answer if to start invest in CHN/HKG markets. If you don't know how or where, you may ask Deepseek/Chatgpt for most reputable Trading courses nearest to you.
** Please Boost 🚀/LIKE 👍, FOLLOW ✅, SHARE 🙌 and COMMENT ✍ if you enjoy this idea! Share your trading journey to encourage the trading buddies
The Index seems hits the ceiling ;trade cautiously!Hello everyone, is Friday! Last trading of the week! This week has been a challenging one.
Hope everyone stick to the trading plan.
Trade plan is the same, buy into support and sell at resistance based on your trade tf.
4H Chart PEPPERSTONE:HK50
This morning the MACD seems has reversal sign although the GoldenCross form below zero line ,at least showing the end of the bear, monitor to confirm it's not a fake reversal. 🚨
As the D chart showed the Index still out of uptrend channel again as mentioned from previous post, as long as the Index out of the upper trend channel then the pullback is inevitable for the next wave.
However longer tf, it's still bullish which created higher high for thr W Chart. HSI:HSI
it would be great if this week could close 24669(last week Hi). But unlikely, what do you think?
Happy trading everyone.
** Please Boost 🚀/LIKE 👍,FOLLOW 🔔 SHARE 🔁 and COMMENT ✍️ if you enjoy this idea! Share your trading journey toencourage the trading buddies.

oh wow, seems the Index has the wheel to run!Hello everyone! Happy Friday!
News📰 : anticipate more positive news to come (of course mixed with some -ve for retracement) 🔮
Look at the HSI D Chart
- posted 28Feb2025
- posted 3Mar2025
- 7March2025 at point of writing; the index trading above the support level of 23500 (the 28Feb2025 Hi); it tried to go back to uptrend channel and staying above! (broke on 28Feb2025).
Monitor the Trading volume: finance.yahoo.com
Avg past 3 months : 77.909Bn (+19.18% for the past avg vol); this imply the fund flow is abundance, hopefully this continues! Although the vol is slightly less than the last Oct 2024.
Look at the 4H chart
PEPPERSTONE:HK50
The HSI last Dec 2021 Hi @ 24385 is being tested again today!
Now, what's next? 25147, btw now and then Next level that we are looking at to break (oh wow! we need to add in past Higher Hi):
22840-22900
23241-23275-23314- 23471 (need to break above this level to change back to uptrend movement, else probably is gonna be sideways, continue to monitor and confirm)
23952-24101
24385
24586
24747
24800
25147
🚨 as of ✍️ :
Resistance : 24385 - 24586 - 24800. Let's monitor; this level is now being tested and see if breaks and staying above.
🗝️ support level
22750 -23535 (this level being tested few times; it's now became strong support level). Don't think this can easily broke down.
MACD - Goldencross was marked in Green (5Mar25)
KDJ - Remained at Bullish green zone since 4Mar25, the CFD is now in a short bullrun cycle.
BB - Still within lower BB channel and gap up trading at upper BB channel/
the Mid-line 4H chart at 22960-975 was corrected from 23320.
Trade Plan : 23477-24385 - 24751
Buy into support & Sell at resistance
the 1H showing it's now bullrun on the 2nd half of today. Ride on the waves and locked in your profits.
🚨🚨🚨 Locked your profits and watch out for reversal for retracement!
Monitor the 1H,4H movement with confirmation using MACD & KDJ indicator.
Set your tf, have your entry and exit plan!
Pay attention to the Goldencross/DeadCross; practice makes perfect.
Let's follow our own strategy and zen with 📙 and 🍵 for profits.
Happy Trading everyone!
🎯 Start to accumulate China & HKG for the potential upside for the year! All retracement is a good entry point.
🔎 DYODD and don't listen to anyone. Invest in yourself, do some study and learn along the way while you trying to verify or finding the answer if to start invest in CHN/HKG markets.
HKEX:2800 - 22.90-22.82 if it happens to retrace back to this level, otherwise anytime NOW is entry point! It's confirmed by the 200MA (above in W chart) ; also the W chart MACD GoldenCross. Cross-check it; if need helps let us know.
HKEX:2823 - 13.17-14.75 can start to open position and start accumulate, is allowed to wait for confirmation once it breaks 14.75 level. But you will be getting at higher cost...
HKEX:2801 - open position at price : 23.73-23.80 or anytime NOW! if ever retraced back to 23.36-23.66 accumulate more.
HKEX:3067 - open position now, add position when it retraced to 11.63,,11.33 or below. If you have missed, you may tk position still good to start at 11.85,11.99,12.15
** Please Boost 🚀/LIKE 👍, FOLLOW ✅, SHARE 🙌 and COMMENT ✍ if you enjoy this idea! Share your trading journey to encourage the trading buddies

is the Trumph speech boost the Index? n is Wednesday the humpdayHello everyone! How was yesterday trade? Hope everyone stick to the strategy set the SL/TP for your day trade.
News📰 : as expected and anticipate more positive news this week 🔮
www.tradingview.com
**China shares waver, HK bounces as Beijing vows more support for consumption, AI**
HSI +1.30% at this news published.😂
Look at the HSI D Chart
- posted 28Feb2025
at point of writing; the index closed below key support level of 22900-23000 (the strong level of 23000 which is the 10MA level, the uptrend is broken 28Feb25); as mentioned this level has been retest 3 times, let's continue to monitor.
However, today the Index open Hi. So trade ⚠ cautiously. Don't chase Hi.
Trading volume: finance.yahoo.com
Date Volume
Mar 3,2025 4,338,200,000
Feb 28, 2025 6,578,300,000
Feb 27, 2025 6,257,000,000
Feb 26, 2025 5,138,100,000
Feb 25, 2025 4,449,800,000
Monthly
Mar 1 2025 - 4,338,200,000 (as of todate)
Feb 1 2025 - 93,960,700,000 (+7.53% from prev month)_correction
Jan 1 2025 - 52,385,800,000
Dec 1 2024 - 56,349,200,000
Avg past 3 months : 77.909Bn (+19.18% for the past avg vol); this imply the fund flow is abundance, hopefully this continues! Although the vol is slightly less than the last Oct 2024.
Look at the 4H chart
PEPPERSTONE:HK50
The HSI last Oct Hi @ 23241 has been broken, this level could be the resistance level for the Index to break the next level Hi. The HK50 last Oct Hi @ 23258.
Now, what's next?
As updated:-
Next level that we are looking at to break:
20985
21336-21350
22020-22535, 22840-22900
23241-23275-23314- 23471 (need to break above this level to change back to uptrend movement, else probably is gonna be sideways)
23952-24101
24385
🚨 as of ✍️ :
it stays above 22535(retest 3 times and this might formed very strong support level).
🗝️ support level :
22990 broken :22340-22750 (this level being tested 3 times 17,20Feb & 4Mar; last tested at 22535.3)
MACD - Deadcross was marked in Green, continue to curving down (4h Chart)
KDJ - Reverse to Bullish green zone on 4Mar25; the CFD continue to trading the upwards trend till now.
BB - Still within lower BB channel and gap up trading at upper BB channel/
the Mid-line 4H chart at 22960-975 was corrected from 23320.
Trade Plan: might pullback to 23020 to fill the gap. Range : 23025-23258
Buy into support : 22880-22960(confirm with indicators)
Sell at resistance : 23150, 23190, 23372/400, 23454,23512(it soared to hit ,this morning)
Monitor the 1H,4H movement with confirmation using MACD & KDJ indicator.
Set your tf, have your entry and exit plan!
Pay attention to the Goldencross/DeadCross; practice makes perfect.
Let's follow our own strategy and zen with 📙 and 🍵 for profits.
Happy Trading everyone!
🎯 Start to accumulate China & HKG for the potential upside for the year! All retracement is a good entry point.
🔎 DYODD and don't listen to anyone. Invest in yourself, do some study and learn along the way while you trying to verify or finding the answer if to start invest in CHN/HKG markets.
HKEX:2800 - 22.90-22.82 if it happens to retrace back to this level, otherwise anytime NOW is entry point! It's confirmed by the 200MA (above in W chart) ; also the W chart MACD GoldenCross. Cross-check it; if need helps let us know.
HKEX:2823 - 13.17-14.75 can start to open position and start accumulate, is allowed to wait for confirmation once it breaks 14.75 level. But you will be getting at higher cost...
HKEX:2801 - open position at price : 23.73-23.80 or anytime NOW! if ever retraced back to 23.36-23.66 accumulate more.
HKEX:3067 - open position now, add position when it retraced to 11.63,,11.33 or below. If you have missed, you may tk position still good to start at 11.85,11.99,12.15
** Please Boost 🚀/LIKE 👍, FOLLOW ✅, SHARE 🙌 and COMMENT ✍ if you enjoy this idea or need help! *

Looks like HSI got a morning energy boost is not a Weakday!3/3/2025
Hello everyone! Happy Monday today is not a Weakday but a wonderful weekday start of the week 🫰 🫶
News📰 : this was from 28Feb2025
www.tradingview.com
N this is this morning 3Mar2025 - what do you think? I suspect more good news will come this week. 🔎🔮
www.tradingview.com
Look at the HSI D Chart
- posted 25Feb2025
- posted 26Feb2025
- posted 27Feb2025
- posted 28Feb2025
at point of ✍️; the index closed near the key support level of 22900-23000 (the strong level of 23000 which is the 10MA level); as mentioned this level has been retest 3 times, let's continue to monitor.
Trading volume: finance.yahoo.com
Date Volume
Feb 28, 2025 6,578,300,000
Feb 27, 2025 6,257,000,000
Feb 26, 2025 5,138,100,000
Feb 25, 2025 4,449,800,000
Feb 24, 2025 5,264,600,000
Monthly
Mar 1 2025 - 93,960,700,000 (+7.53% from prev month)
Feb 1 2025 - 87,382,400,000
Jan 1 2025 - 52,385,800,000
Dec 1 2024 - 56,349,200,000
Avg past 3 months : 77.909Bn (+19.18% for the past avg vol); this imply the fund flow is abundance, hopefully this continues! Although the vol is slightl less than the last Oct 2024.
Look at the 4H chart
PEPPERSTONE:HK50
The last Oct Hi @ 23241 has been broken, this level could be the resistance level for the Index to stay above for the next level.
Now, what's next?
As updated:-
Next level that we are looking at to break:23330, 23525, 23990, 24101, 24385.
🚨 as of ✍️ :it seems it stay above the key support level of 22990.
🗝️ support level : 23500 (broken) , 23175 (broken), 22990 (testing), 22741
MACD - last marked WAS deadcross and curving down as marked in YELLOW. After 8 bars-it reversed as marked in GREEN. and NOW it formed Deadcross again (as marked in YELLOW)
KDJ - Remained in bearish red zone with chance that it could reverse upwards.
BB - Still within lower BB channel and testing to break the BB mid-line for 4H chart at 23330.
Today Trade Plan: 22785-23504
Buy into support : 22900 ,23,005, 23169,23283 (confirm with the indicator if it's on the bullish zone)
Sell at resistance : 23400, 23353, 23335 (short/TP with shorter timeframe bearish zone, cross-check and wait for confirmation.)
Monitor the 1H,4H movement with confirmation using MACD & KDJ indicator.
Set your tf, have your entry and exit plan!
Pay attention to the Goldencross/DeadCross; practice makes perfect.
Let's follow our own strategy and zen with 📙 and 🍵.
Happy Trading everyone!
🎯 Start to accumulate China & HKG for the potential upside for the year! All retracement is a good entry point.
🔎 DYODD and don't listen to anyone. Invest in yourself, do some study and learn along the way while you trying to verify or finding the answer if to start invest in CHN/HKG markets.
HKEX:2800 - 22.90-22.82 if it happens to retrace back to this level, otherwise anytime NOW is entry point! It's confirmed by the 200MA (above in W chart) ; also the W chart MACD GoldenCross. Cross-check it; if need helps let us know.
HKEX:2823 - 13.17-14.75 can start to open position and start accumulate, is allowed to wait for confirmation once it breaks 14.75 level. But you will be getting at higher cost...
HKEX:2801 - open position at price : 23.73-23.80 or anytime NOW! if ever retraced back to 23.36-23.66 accumulate more.
HKEX:3067 - open position now, add position when it retraced to 11.63,,11.33 or below. If you have missed, you may tk position still good to start at 11.85,11.99,12.15
** Please Boost 🚀/LIKE 👍, FOLLOW ✅, SHARE 🙌 and COMMENT ✍ if you enjoy this idea or need help! *

HSI clocked out early, TP sit back and relax wait for next move!
Hello everyone! Today one of the web hot topic - all the 7 stars align and there must be something happen!
What do you think?
"Bulls took profits, bears took chances—HSI took a nap before the next round!" 😴📈📉
Here you go...now come with this news 📰
www.tradingview.com
**Shares in Hong Kong plunged 309 points or 1.3% to 23,415 on the last trading day of February, marking a second session of losses.
The Hang Seng fell further from its highest in over three years, set earlier in the week, and was on track for its first weekly drop in seven weeks, with all sectors posting sharp losses.
Still, markets were on course for solid monthly gains, up around 15% so far, marking a third month of rises as hopes mounted that China’s 2025 Two Sessions meeting next week will outline key policy priorities, including potential support measures for the economy.**
Look at the HSI D Chart
- posted 25Feb2025
- posted 26Feb2025
- posted 27Feb2025
- posted 28Feb2025 at point of writing; the index broke the key support level of 22900-23000 (the strong level of 23000 which is the 10MA level; let's monitor closely next week the new start for the month and see this level can be maintained. (this level has been retest 3 times)
Trading volume: finance.yahoo.com
Date Volume
Feb 27, 2025 6,257,000,000
Feb 26, 2025 5,138,100,000
Feb 25, 2025 4,449,800,000
Feb 24, 2025 5,264,600,000
Monthly
Feb 1 2025 - 87,382,400,000
Jan 1 2025 - 52,385,800,000
Dec 1 2024 - 56,349,200,000
Avg past 3 months : 65.3Bn ; current as of todate / month volume > past 3 mnths avg (i.e 57.98bn)
Look at the 4H chart (main chart)
PEPPERSTONE:HK50
The last Oct Hi @ 23241 has been broken hence retracement is not a surprised!
With the month closing today, the strong pullback is inevitable for institute and whale to take profit.
Please trade cautiously today! 🚨 🚨 🚨
Now, what's next?
As updated:-
Next level that we are looking at to break and steadily staying above this level - 23525, 23990, 24101, 24385
🚨 as of ✍️ it seems break the first support level this morning- and let's see if it could rebound today else it will go down ⬇ 👇 to 23175-22990 level, then 22741.
🗝️ support level : 23500 (broken) , 23175 (broken), 22990 (testing), 22741
MACD - last marked WAS deadcross and curving down as marked in YELLOW. After 8 bars-it reversed as marked in GREEN. and NOW it formed Deadcross again (as marked in YELLOW)
KDJ - Now reversed turned into bearish red zone. It remained in bearish zone.
BB - It is now entered lower BB channel and testing to break the lower BB and create new Lo.
Today Trade Plan: 23000-23504
Buy into support : 22795- 22900 (confirm with the indicator if its on reversal mode otherwise stayaway)
Sell at resistance : 24040,23454,23250 (short and TP within shorter timeframe, cross-check and wait for confirmation)
Monitor the 1H,4H movement with confirmation using MACD & KDJ indicator.
Set your tf, have your entry and exit plan!
Pay attention to the Goldencross/DeadCross; practice makes perfect.
Let's follow our own strategy and zen with 📙 and 🍵.
Happy Trading everyone!
🎯 Start to accumulate China & HKG for the potential upside for the year! All retracement is a good entry point.
🔎 DYODD and don't listen to anyone. Invest in yourself, do some study and learn along the way while you trying to verify or finding the answer if to start invest in CHN/HKG markets.
HKEX:2800 - 22.90-22.82 if it happens to retrace back to this level, otherwise anytime NOW is entry point! It's confirmed by the 200MA (above in W chart) ; also the W chart MACD GoldenCross. Cross-check it; if need helps let us know.
HKEX:2823 - 13.17-14.75 can start to open position and start accumulate, is allowed to wait for confirmation once it breaks 14.75 level. But you will be getting at higher cost...
HKEX:2801 - open position at price : 23.73-23.80 or anytime NOW! if ever retraced back to 23.36-23.66 accumulate more.
HKEX:3067
** Please Boost 🚀/LIKE 👍, FOLLOW ✅, SHARE 🙌 and COMMENT ✍ if you enjoy this idea or need help! *

Not every run is a marathon— it needs pit stop! Hello everyone!
Here you go...now come with this news 📰
Market Chatter: China Plans 400-Billion-Yuan Capital Injection for Banks -- 💰💰💰?
www.tradingview.com
Look at the HSI D Chart
- posted 25Feb2025
- posted 26Feb2025
- posted 27Feb2025 at point of writing; the index seems doing quite well since open this morning,
trying to stay above the support level 💣💣💣23500 (and strong level of 23000 which is the 10MA level, if break below this level the Index bullrun end, but it's unlikely as it has been retest 3 times)
Trading volume: finance.yahoo.com
Date Volume
Feb 27, 2025
Feb 26, 2025 5,138,100,000
Feb 25, 2025 4,449,800,000
Feb 24, 2025 5,264,600,000
Monthly
Feb 1 2025 - 81,125,400,000
Jan 1 2025 - 52,385,800,000
Dec 1 2024 - 56,349,200,000
Avg past 3 months : 63.28Bn ; current month Feb volume > 3 mnths avg
Look at the 4H chart
PEPPERSTONE:HK50
The last Oct Hi @ 23241 has been broken hence retracement is not a surprised!
Now, what's next? This is tough question 🙋 - Next level that we are looking at to break and steadily staying above this level - 23525, 23990, 24101, 24385
🚨if it breaks below 23454-23500 (& not rebound) it could go down ⬇ 👇 to 23250-23175
🗝️ support level : 23500, 23175, 22741 t
MACD - last marked WAS deadcross and curving down as marked in YELLOW. After 8 bars-it reversed as marked in GREEN.
KDJ - Now reversed turned into bearish red zone.
BB - continue moving above the mid line of BB, this morning touches the mid-line; so be cautious 🚨🚨🚨
Today Trade Plan: 23454-24050
Buy into support : 23454 -23550 (TP :23600-23775)
Sell at resistance : 23800-24050 (TP : 23525-23454)
Monitor the 1H,4H movement with confirmation using MACD & KDJ indicator.
Set your tf, have your entry and exit plan!
Pay attention to the Goldencross/DeadCross; practice makes perfect.
Let's follow our own strategy and zen with 📙 and 🍵.
Happy Trading everyone!
🎯: start to accumulate China & HKG for the potential upside for the year! All retracement is a good entry point.
🔎 DYODD and don't listen to anyone. Invest in yourself, do some study and learn along the way while you trying to verify or finding the answer if to start invest in CHN/HKG markets.
HKEX:2800 - 22.90-22.82 if it happens to retrace back to this level, otherwise anytime NOW is entry point! It's confirmed by the 200MA (above in W chart) ; also the W chart MACD GoldenCross. Cross-check it; if need helps let us know.
HKEX:2823 - 13.17-14.75 can start to open position and start accumulate, is allowed to wait for confirmation once it breaks 14.75 level. But you will be getting at higher cost...
HKEX:2801 - open position at price : 23.73-23.80 or anytime NOW! if ever retraced back to 23.36-23.66 accumulate more.
HKEX:3067
** Please Boost 🚀/LIKE 👍, FOLLOW ✅, SHARE 🙌 and COMMENT ✍ if you enjoy this idea or need help! *

Rebound lik a champ, monitor the vol c if the guests left early?Hello everyone! How was your zentradingstrategy? Hope everyone embrace with the retracement.
Sell on news? or Buy the dip?
What did we noticed on yesterday news? pfft..Distraction, distraction...
but here you go for today 😂😂😂: www.tradingview.com
**Shares in Hong Kong surged 520 points or 2.3% to 23,555 on Wednesday, shifting from a weak session the day before amid robust gains across all sectors.**
Look at the HSI D Chart
- posted 25Feb2025
- 26Feb2025 at point of writing; the index seems doing quite well since open this morning, trying to stay above the support level 22990.
Yesterday trading volume: finance.yahoo.com
Date Volume
Feb 26, 2025
Feb 25, 2025 4,449,800,000
Feb 24, 2025 5,264,600,000
Look at the 4H chart
PEPPERSTONE:HK50
The last Oct Hi @ 23241 has been broken hence retracement is not a surprised!
MACD - last marked WAS deadcross and curving down as marked in YELLOW. After 8 bars-it reversed as marked in GREEN.
KDJ - WAS at bearish zone curving down; and now reversed and turned bullish in green zone.
BB - now moving above the mid line of BB from yesterday ranging within the mid-line.
22990 resistance level now reversed as SUPPORT level. Hopefully the retracement is completed. Let's monitor especially the volume see if this is just a rehearsal.
Today Trade Plan: 23150-23670 (ahemmm...trust you can do the math 😂)
Buy into support : 23150 -23175 (TP :23600-23630)
Sell at resistance : 23465-23670 (TP : 23450-23500)
Monitor the 1H,4H movement with confirmation using MACD & KDJ indicator.
Set your tf, have your entry and exit plan!
Pay attention to the Goldencross/DeadCross; practice makes perfect.
Let's follow our own strategy and zen with 📙 and 🍵.
Happy Trading everyone!
Reminder : start to accumulate China & HKG for the potential upside for the year! All retracement is a good entry point.
HKEX:2800 - 22.90-22.82 if it happens to retrace back to this level, otherwise anytime NOW is entry point! It's confirmed by the 200MA (above in W chart) ; also the W chart MACD GoldenCross. Cross-check it; if need helps let us know.
HKEX:2823 - 13.17-14.75 can start to open position and start accumulate, is allowed to wait for confirmation once it breaks 14.75 level. But you will be getting at higher cost...
HKEX:2801 HKEX:3067
** Please Boost 🚀/LIKE 👍, FOLLOW ✅, SHARE 🙌 and COMMENT ✍ if you enjoy this idea or need help! 😍 **

A little dip? Just the market testing if the game still on!Hello everyone!
Sell on news?
www.tradingview.com
**Hong Kong stocks fell 315 points or 1.4% to 23,030 in Tuesday morning trade, marking the second session of sharp losses amid broad sector falls, notably consumers and tech.Traders retreated from riskier assets after the US intensified curbs on Chinese investments and proceeded with tariffs on Canada and Mexico.**
Is this piece of sh *** news helps in trading? 🤐 🤐 🤐
#sticktoyourplan
#trustwhatyoutrust
#followyourowntradingplan
Build your own #zentradingstrategy news can be distraction to your judgements!
Look at the HSI D Chart
Look at the 4H chart
PEPPERSTONE:HK50
The last Oct Hi @ 23241 has been broken hence retracement is not a surprised!
MACD - formed deadcross and curving down as marked in yellow circle.
KDJ - at bearish zone curving down.
BB - it broke down uptrende channel trading in lower BB channel
22990 support level turned resistance level now. If it able to break and stay above this level this week then this is a healthy pull back. Let's monitor.
Today Trade Plan: 22500-23250 (~830pts)
Buy into support : 22600 -22900 (TP :22950-23130)
Sell at resistance : 23000-23100 (TP: 22900-22930)
PEPPERSTONE:HK50
1h Chart
Check MACD & KDJ - wait for the reversal confirmation before taking your swing long position.
Monitor the 1H,4H movement with confirmation using MACD & KDJ indicator.
Set your tf, have your entry and exit plan!
Pay attention to the Goldencross/DeadCross; practice makes perfect.
Let's follow our own strategy and zen with 📙 and 🍵.
Happy Trading everyone!
Reminder : start to accumulate China & HKG for the potential upside for the year! All retracement is a good entry point.
HKEX:2800 - 22.90-22.82 add position
HKEX:2823 HKEX:2801 HKEX:3067
** Please Boost 🚀/LIKE 👍, FOLLOW ✅, SHARE 🙌 and COMMENT ✍ if you enjoy this idea!**

HSI took off like a rocket...confirmed bullish24/02/2025
HSI took off like a rocket… then remembered it forgot its wallet and came back for a quick retrace!" 🚀📉
Next target : 24385
HSI 1W Chart
Look at that! ignore the news, the movement and volume
finance.yahoo.com
Goldencross for the week of 3Feb2025 - with trading volume jumped from 3.69bn to 15.12bn.
And the subsequent week volume keeping at >20bn level (for the week of 10Feb & 17Feb)
Let's monitor if this week keeping the same level of volume for the 3rd week.
finance.yahoo.com
we noticed the trading volume increased from 4.42Bn to 6.1673bn last Friday 21Feb25
www.tradingview.com
** The Hang Seng Composite Index on information technology firms and the Hang Seng Tech Index slip 0.5% and 0.1% respectively, while Hang Seng Index adds 0.4%
** Stock up 76.9% YTD
HSI:HSI
The last Oct Hi @ 23241 has been broken today!
MACD, KDJ and BB remained at bullish zone.
Key support level: 22990,22668,22446
Key resistance level : 23675,24167,24385
Look at the 1h chart - posted
PEPPERSTONE:HK50
Today Trade Plan:
Buy into support : 23300-23500
Sell at resistance : 23650-23700 (TP:23630)
Monitor the 1H,4H movement with confirmation using MACD & KDJ indicator.
Set your tf, have your entry and exit plan!
Pay attention to the Goldencross/DeadCross; practice makes perfect.
Let's follow our own strategy and zen with 📙 and 🍵.
Happy Trading everyone!
Reminder : start to accumulate China & HKG for the potential upside for the year! Today retracement is a good entry point.
HKEX:2800 HKEX:2823 HKEX:2801 HKEX:3067
** Please Boost 🚀/LIKE 👍, FOLLOW ✅, SHARE 🙌 and COMMENT ✍ if you enjoy this idea!**
