Keep An Eye - Consolidation Breakout Soon - VBL📊 Script: VBL
📊 Sector: FMCG
📊 Industry: Food - Processing - Indian
Key highlights: 💡⚡
📈 Script is trading near its resistance level which is 1477.
📈 Script is trading at upper band of BB and giving breakout of it.
📈 MACD and Double Moving Average are giving crossover .
📈 Right now RSI is around 62.
📈 One can go for Swing Trade only above 1477.
BUY ONLY ABOVE 1477
⏱️ C.M.P 📑💰- 1475
🟢 Target 🎯🏆 - 1561
⚠️ Stoploss ☠️🚫 - 1433
⚠️ Important: Always maintain your Risk & Reward Ratio.
✅Like and follow to never miss a new idea!✅
Disclaimer: I am not SEBI Registered Advisor. My posts are purely for training and educational purposes.
Eat🍜 Sleep😴 TradingView📈 Repeat 🔁
Happy learning with trading. Cheers!🥂
Macdcrossover

Multiple Indicators - FINPIPE📊 Script: FINPIPE
📊 Sector: Plastic products
📊 Industry: Plastic products
Key highlights: 💡⚡
📈 Script is trading at upper band of BB and giving breakout of it.
📈 MACD is giving crossover .
📈 Double Moving Averages are on urge of crossover.
📈 Right now RSI is around 60.
📈 One can go for Swing Trade.
⏱️ C.M.P 📑💰- 235
🟢 Target 🎯🏆 - 260
⚠️ Stoploss ☠️🚫 - 222
⚠️ Important: Always maintain your Risk & Reward Ratio.
✅Like and follow to never miss a new idea!✅
Disclaimer: I am not SEBI Registered Advisor. My posts are purely for training and educational purposes.
Eat🍜 Sleep😴 TradingView📈 Repeat 🔁
Happy learning with trading. Cheers!🥂

Crossover - REDINGTON📊 Script: REDINGTON
📊 Sector: Trading
📊 Industry: Trading
Key highlights: 💡⚡
📈 Script is trading at upper band of BB and giving breakout of it.
📈 MACD is giving crossover .
📈 Double Moving Averages are giving crossover.
📈 Right now RSI is around 64.
📈 One can go for Swing Trade.
⏱️ C.M.P 📑💰- 222
🟢 Target 🎯🏆 - 235
⚠️ Stoploss ☠️🚫 - 217
⚠️ Important: Always maintain your Risk & Reward Ratio.
✅Like and follow to never miss a new idea!✅
Disclaimer: I am not SEBI Registered Advisor. My posts are purely for training and educational purposes.
Eat🍜 Sleep😴 TradingView📈 Repeat 🔁
Happy learning with trading. Cheers!🥂

Just A View - Channel Breakout Soon - JINDALSTEL📊 Script: JINDALSTEL
📊 Sector: Steel
📊 Industry: Steel - Sponge Iron
Key highlights: 💡⚡
📈 Script is moving from it's support level (posted earlier).
📈 Script was trying to give upward moving channel breakout today but selling pressure came from top.
📈 MACD is giving Crossover.
📈 Double Moving Averages are on urge or Crossover
📈 One can go for Breakout Swing Trade only above 860.
📈 One can take risky trade of 30 points also as breakout is above 860.
⏱️ C.M.P 📑💰- 837
⚠️ Important: Always maintain your Risk & Reward Ratio.
✅Like and follow to never miss a new idea!✅
Disclaimer: I am not SEBI Registered Advisor. My posts are purely for training and educational purposes.
Eat🍜 Sleep😴 TradingView📈 Repeat 🔁
Happy learning with trading. Cheers!🥂

Moving Averages Crossover - BEL📊 Script: BEL
📊 Sector: Aerospace & Defence
📊 Industry: Electronics - Components
Key highlights: 💡⚡
📈 Script is trading at upper band of BB.
📈 Already crossover in MACD .
📈 Double Moving Averages giving crossover.
📈 Right now RSI is around 63.
📈 One can go for Swing Trade.
⏱️ C.M.P 📑💰- 194
🟢 Target 🎯🏆 - 219
⚠️ Stoploss ☠️🚫 - 183
⚠️ Important: Always maintain your Risk & Reward Ratio.
✅Like and follow to never miss a new idea!✅
Disclaimer: I am not SEBI Registered Advisor. My posts are purely for training and educational purposes.
Eat🍜 Sleep😴 TradingView📈 Repeat 🔁
Happy learning with trading. Cheers!🥂

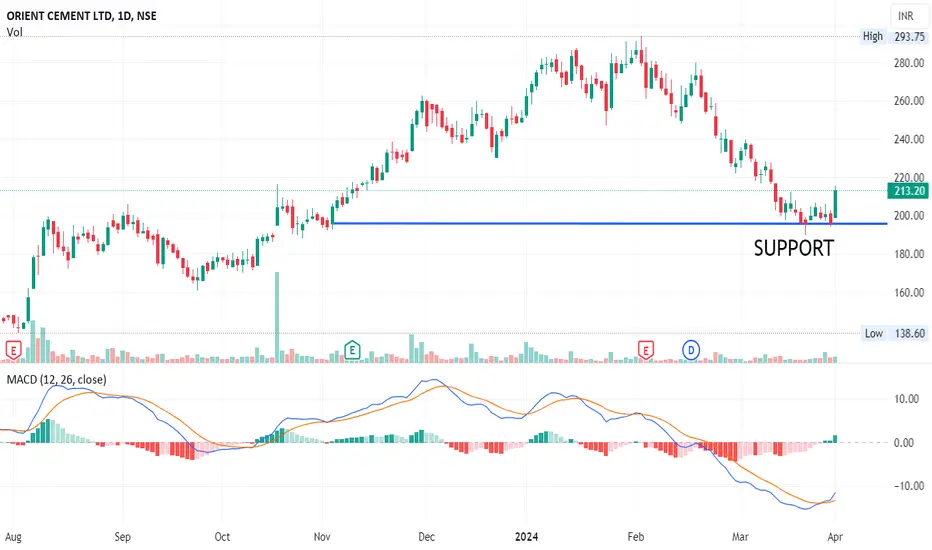
Just A View - ORIENTCEM📊 Script: ORIENTCEM
📊 Sector: Cement
📊 Industry: Cement - South India
Key highlights: 💡⚡
📈 Script has taken support at 195 level and started moving upward we may see 229 level.
📈 MACD is giving Crossover
⏱️ C.M.P 📑💰- 213
🟢 Target 🎯🏆 - 229
⚠️ Stoploss ☠️🚫 - 205
⚠️ Important: Always maintain your Risk & Reward Ratio.
✅Like and follow to never miss a new idea!✅
Disclaimer: I am not SEBI Registered Advisor. My posts are purely for training and educational purposes.
Eat🍜 Sleep😴 TradingView📈 Repeat 🔁
Happy learning with trading. Cheers!🥂
NIFTY DAILY - 1/4/2024Third winning strike of bulls and Nifty hit records high which is 22529 level.
Nifty open with a gap up but there was some profit booking from top.
Nifty has formed Gravestone Doji candle on daily chart.
(Tomorrow nifty should remain positive for bullish momentum or else we may see bearish sentiments into the market – personal opinion).
MACD is giving Bullish Crossover. So, further levels for nifty will be 22336 will work as support level and 22520 will work as resistance level.
Today’s Advance Decline ratio of NIFTY50
Advance - 31
Decline - 18
FII Sell – 522.30 crore
DII Buy + 1208.42 crore.
⚠️ Important: Always maintain your Risk & Reward Ratio.
✅Like and follow to never miss a new idea!✅
Disclaimer: I am not SEBI Registered Advisor. My posts are purely for training and educational purposes.
Eat🍜 Sleep😴 TradingView📈 Repeat 🔁
Happy learning with trading. Cheers!🥂

Bearish Signals on 4H GBP/CHFMACD and Signal Line Down-Cross
The Moving Average Convergence Divergence (MACD) indicator is nearing a down-cross of its signal line. This is traditionally seen as a bearish signal, suggesting that downward momentum is increasing, and traders might anticipate a potential decline in the GBP/CHF pair. The MACD measures the momentum by comparing two moving averages of the price, and a cross below the signal line can indicate that it's a good time to consider short positions.
Higher-Highs with Descending CCI
There are two occurrences of two consecutive candles forming higher highs, a bullish signal, but this is contrasted with the Commodity Channel Index (CCI) descending during the same four-candle period. The CCI is used to identify overbought and oversold levels. A descending CCI during a period of price increase can indicate weakening momentum in the upward move and might suggest a reversal or pullback is on the horizon, especially if the CCI moves from above 100 to below it, indicating the end of overbought conditions.
Resistance Levels and Bounces
The GBP/CHF price action showing a bounce off the weekly pivot's resistance level R1 and the upper band of the Bollinger Band (coinciding at R1) further supports the case for a potential reversal. The resistance level R1 acts as a ceiling that price struggles to break through, and the Bollinger Bands are used to measure volatility and overbought or oversold conditions. A price rejecting off the upper Bollinger Band typically suggests that the asset is overbought, and a retracement could be imminent.
Towards the Weekly Pivot
Considering the confluence of bearish signals—MACD down-cross, divergent CCI during higher highs, and significant resistance at R1 coinciding with the upper Bollinger Band—there's a strong case that the price might retreat towards the weekly pivot level at 1.13357. This level acts as a gravitational center for the price and could serve as the next target for a downward move.
In summary , the GBP/CHF 4-hour chart analysis points to a possible retracement from current levels with the weekly pivot at 1.13357 as a plausible short-term target. As always, while technical analysis can provide guidance, it's crucial to consider other factors such as market news, economic indicators, and broader market sentiment before making trading decisions.

MACD Crossover - HINDCOPPER📊 Script: HINDCOPPER
📊 Sector: Non Ferrous Metals
📊 Industry: Mining / Minerals / Metals
Key highlights: 💡⚡
📈 Script is trading near at middle band of BB.
📈 MACD is giving crossover .
📈 Double Moving Averages will give crossover.
📈 Right now RSI is around 59.
📈 One can go for Swing Trade.
⏱️ C.M.P 📑💰- 281
🟢 Target 🎯🏆 - 306
⚠️ Stoploss ☠️🚫 - 269
⚠️ Important: Always maintain your Risk & Reward Ratio.
✅Like and follow to never miss a new idea!✅
Disclaimer: I am not SEBI Registered Advisor. My posts are purely for training and educational purposes.
Eat🍜 Sleep😴 TradingView📈 Repeat 🔁
Happy learning with trading. Cheers!🥂

TATA STOCK - TATASTEEL📊 Script: TATASTEEL
📊 Sector: Steel
📊 Industry: Steel - Large
Key highlights: 💡⚡
📈 Script is trading at upper band of BB.
📈 MACD is giving crossover .
📈 Double Moving Averages are giving Crossover.
📈 Right now RSI is around 62.
📈 One can go for Swing Trade.
⏱️ C.M.P 📑💰- 155
🟢 Target 🎯🏆 - 167
⚠️ Stoploss ☠️🚫 - 150
⚠️ Important: Always maintain your Risk & Reward Ratio.
✅Like and follow to never miss a new idea!✅
Disclaimer: I am not SEBI Registered Advisor. My posts are purely for training and educational purposes.
Eat🍜 Sleep😴 TradingView📈 Repeat 🔁
Happy learning with trading. Cheers!🥂

Swing Trade - GRASIM📊 Script: GRASIM
📊 Sector: Textiles
📊 Industry: Textiles - Manmade
Key highlights: 💡⚡
📈 Script is trading at upper band of BB and giving breakout of it.
📈 MACD is giving crossover .
📈 Double Moving Averages are giving Crossover.
📈 Right now RSI is around 62.
📈 One can go for Swing Trade.
⏱️ C.M.P 📑💰- 2287
🟢 Target 🎯🏆 - 2410
⚠️ Stoploss ☠️🚫 - 2241
⚠️ Important: Always maintain your Risk & Reward Ratio.
✅Like and follow to never miss a new idea!✅
Disclaimer: I am not SEBI Registered Advisor. My posts are purely for training and educational purposes.
Eat🍜 Sleep😴 TradingView📈 Repeat 🔁
Happy learning with trading. Cheers!🥂

Swing Trade - SONACOMS📊 Script: SONACOMS
📊 Sector: Auto Ancillaries
📊 Industry: Auto Ancillaries
Key highlights: 💡⚡
📈 Script is trading at upper band of BB.
📈 MACD is giving crossover .
📈 Double Moving Averages are on urge of Crossover.
📈 Right now RSI is around 59.
📈 One can go for Swing Trade.
⏱️ C.M.P 📑💰- 705
🟢 Target 🎯🏆 - 750
⚠️ Stoploss ☠️🚫 - 683
⚠️ Important: Always maintain your Risk & Reward Ratio.
✅Like and follow to never miss a new idea!✅
Disclaimer: I am not SEBI Registered Advisor. My posts are purely for training and educational purposes.
Eat🍜 Sleep😴 TradingView📈 Repeat 🔁
Happy learning with trading. Cheers!🥂

NIFTY DAILY - 28/3/2024Another gap up opening of Index and highly volatile session, Index has made days high that is 22516 level, there was profit booking in last hours of trading.
Third green body shaven bottom candle is formed on daily chart, which indicates todays open and low are same and buyers were buying from starting of the day.
Formation of last three candles are higher highs higher lows.
MACD is on an urge of Crossover. Candle is above 9 days Moving Average line on daily chart.
Today’s closing was below 22381 level so this will work as resistance with support of 22145 level.
Today’s Advance Decline ratio of NIFTY50
Advance - 45
Decline - 5
FII Buy + 188.31 crore
DII Buy + 2619.52 crore.
⚠️ Important: Always maintain your Risk & Reward Ratio.
✅Like and follow to never miss a new idea!✅
Disclaimer: I am not SEBI Registered Advisor. My posts are purely for training and educational purposes.
Eat🍜 Sleep😴 TradingView📈 Repeat 🔁
Happy learning with trading. Cheers!🥂

CHF/JPY 4h heading to Monthly PivotLooking at the CHF/JPY pair on the 4-hour chart, there are some interesting signals popping up:
Bollinger Bands : The price appears to be bouncing off the lower Bollinger Band. This indicates potential support at that level, suggesting a possible reversal in the short term. Bollinger Bands are volatility bands placed above and below a moving average. The bands widen when volatility increases and narrow when volatility decreases. When the price touches or moves outside of the bands, it's considered significant, potentially signaling overbought or oversold conditions.
MACD (Moving Average Convergence Divergence) : The MACD line has crossed above the signal line. This crossover is often interpreted as a bullish signal, indicating that the momentum of the price action is shifting upward. MACD is a trend-following momentum indicator that shows the relationship between two moving averages of a security’s price. The MACD is calculated by subtracting the 26-period EMA (Exponential Moving Average) from the 12-period EMA.
Considering these indicators, there's a suggestion that the price might continue to rise. The next notable level to watch out for is around the monthly pivot point at approximately 170.182. Pivot points are significant levels used by traders to determine potential support and resistance areas based on the previous period's high, low, and close prices.
With these signals in mind, it seems there's a bullish bias in the short term for CHF/JPY, with potential for a move towards the monthly pivot point.

Keep An Eye - COLPAL📊 Script: COLPAL
📊 Sector: FMCG
📊 Industry: Personal Care - Multinational
Key highlights: 💡⚡
📈 Script is trading at upper band of BB.
📈 MACD is giving crossover .
📈 Double Moving Averages is giving crossover.
📈 Stock is under Consolidation Zone highlighted into chart breakout is above 2624 level.
📈 Right now RSI is around 60.
📈 One can go for Swing Trade only above 2624.
BUY ONLY ABOVE 2624
⏱️ C.M.P 📑💰- 2606
⚠️ Important: Always maintain your Risk & Reward Ratio.
✅Like and follow to never miss a new idea!✅
Disclaimer: I am not SEBI Registered Advisor. My posts are purely for training and educational purposes.
Eat🍜 Sleep😴 TradingView📈 Repeat 🔁
Happy learning with trading. Cheers!🥂

Crossover Trade - PFC📊 Script: PFC
📊 Sector: Finance
📊 Industry: Finance - Term-Lending Institutions
Key highlights: 💡⚡
📈 Script is trading at Middle band of BB.
📈 MACD is giving crossover .
📈 Double Moving Averages will give crossover.
📈 Right now RSI is around 56.
📈 One can go for Swing Trade.
⏱️ C.M.P 📑💰- 432
🟢 Target 🎯🏆 - 458
⚠️ Stoploss ☠️🚫 - 416
⚠️ Important: Always maintain your Risk & Reward Ratio.
✅Like and follow to never miss a new idea!✅
Disclaimer: I am not SEBI Registered Advisor. My posts are purely for training and educational purposes.
Eat🍜 Sleep😴 TradingView📈 Repeat 🔁
Happy learning with trading. Cheers!🥂

Risky + Doble Digit - ALLCARGO📊 Script: ALLCARGO
📊 Sector: Logistics
📊 Industry: Miscellaneous
Key highlights: 💡⚡
📈 Script is trading at upper band of BB and giving breakout if it.
📈 MACD is giving crossover .
📈 Right now RSI is around 63.
📈 Price increasing along with volume which indicate Volume Breakout.
📈 One can go for Swing Trade.
⏱️ C.M.P 📑💰- 85
🟢 Target 🎯🏆 - 92
⚠️ Stoploss ☠️🚫 - 81
⚠️ Important: Always maintain your Risk & Reward Ratio.
✅Like and follow to never miss a new idea!✅
Disclaimer: I am not SEBI Registered Advisor. My posts are purely for training and educational purposes.
Eat🍜 Sleep😴 TradingView📈 Repeat 🔁
Happy learning with trading. Cheers!🥂

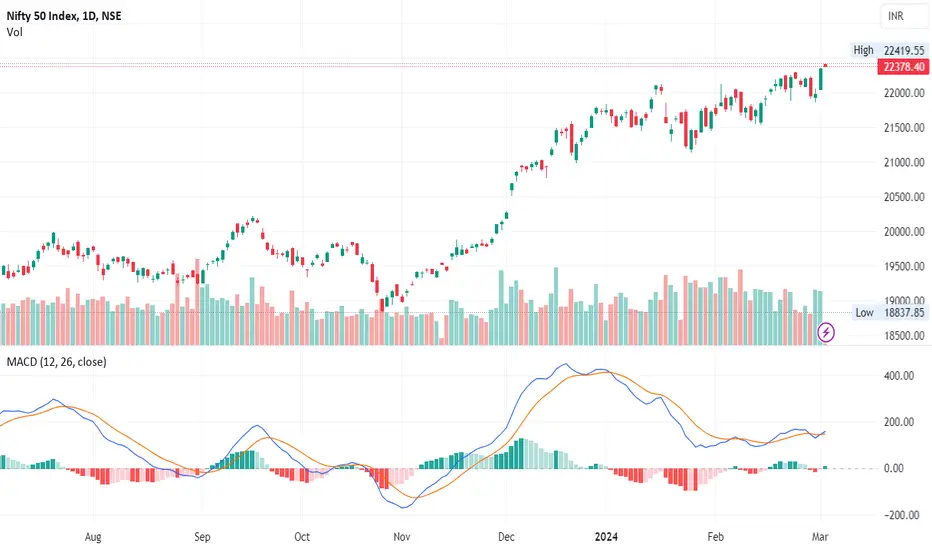
NIFTY DAILY - 2/3/2024 - Special Trading Session Indian Benchmark open with huge gap up and bulls were aggressive throughout the session and not only made day high but also made another all-time high that is 224063.
Nifty has formed red body small candle.
MACD is giving crossover.
Next levels for nifty will be 22520 upsides and 22116 level downsides.
⚠️ Important: Always maintain your Risk & Reward Ratio.
✅Like and follow to never miss a new idea!✅
Disclaimer: I am not SEBI Registered Advisor. My posts are purely for training and educational purposes.
Eat🍜 Sleep😴 TradingView📈 Repeat 🔁
Happy learning with trading. Cheers!🥂
Crossover - NAM_IND📊 Script: NAM_INDIA
📊 Sector: Finance
📊 Industry: Finance & Investments
Key highlights: 💡⚡
📈 Script is trading near at upper band of BB.
📈 MACD is giving crossover.
📈 Double Moving Averages is giving Crossover.
📈 Right now RSI is around 60.
📈 One can go for Swing Trade.
⏱️ C.M.P 📑💰- 521
🟢 Target 🎯🏆 - 560
⚠️ Stoploss ☠️🚫 - 506
⚠️ Important: Always maintain your Risk & Reward Ratio.
✅Like and follow to never miss a new idea!✅
Disclaimer: I am not SEBI Registered Advisor. My posts are purely for training and educational purposes.
Eat🍜 Sleep😴 TradingView📈 Repeat 🔁
Happy learning with trading. Cheers!🥂

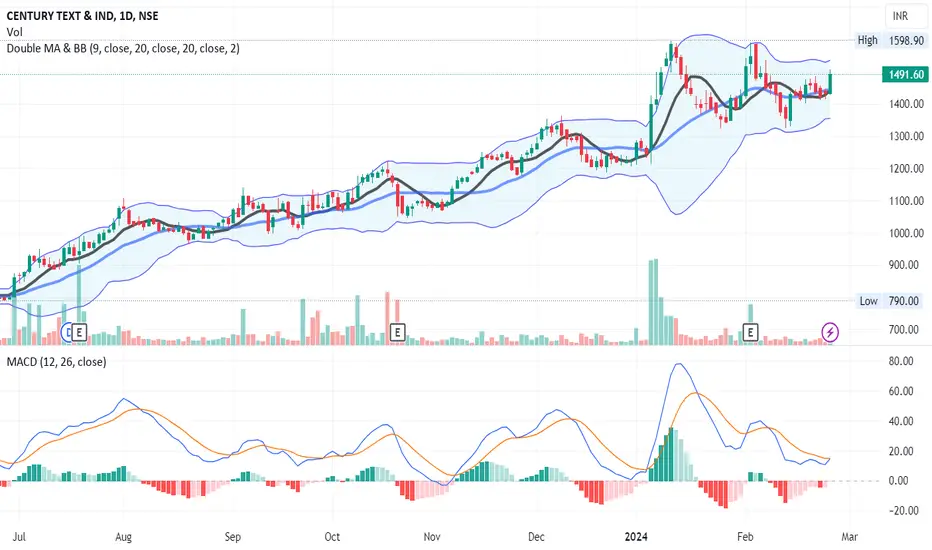
Crossover - CENTURYTEX📊 Script: CENTURYTEX
📊 Sector: Paper
📊 Industry: Paper
Key highlights: 💡⚡
📈 Script is trading near at middle band of BB.
📈 MACD is giving crossover.
📈 Double Moving Averages is giving Crossover.
📈 Right now RSI is around 58.
📈 One can go for Swing Trade.
⏱️ C.M.P 📑💰- 1491
🟢 Target 🎯🏆 - 1598
⚠️ Stoploss ☠️🚫 - 1438
⚠️ Important: Always maintain your Risk & Reward Ratio.
✅Like and follow to never miss a new idea!✅
Disclaimer: I am not SEBI Registered Advisor. My posts are purely for training and educational purposes.
Eat🍜 Sleep😴 TradingView📈 Repeat 🔁
Happy learning with trading. Cheers!🥂
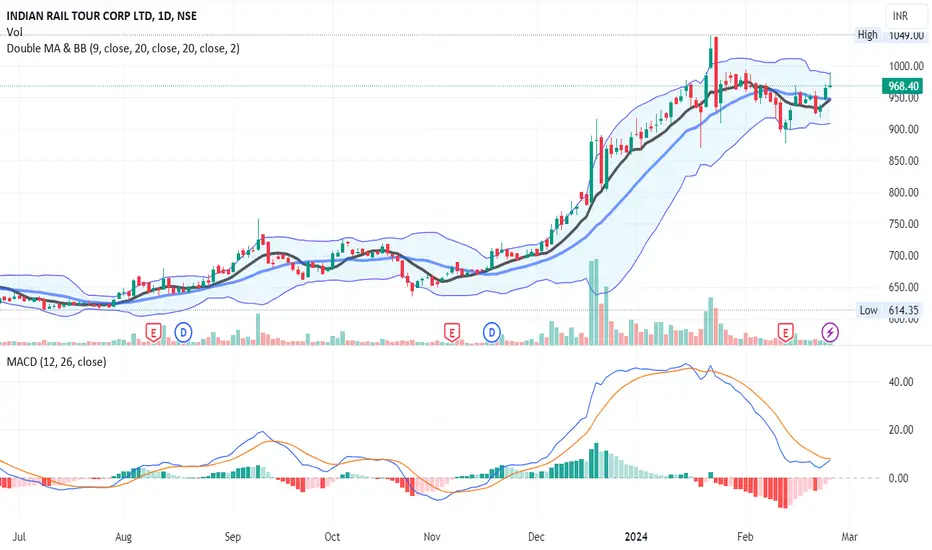
Crossover - IRCTC📊 Script: IRCTC
📊 Sector: Railways
📊 Industry: Travel Agencies
Key highlights: 💡⚡
📈 Script is trading near at upper band of BB.
📈 MACD is giving crossover.
📈 Double Moving Averages is giving Crossover.
📈 Right now RSI is around 56.
📈 One can go for Swing Trade.
⏱️ C.M.P 📑💰- 968
🟢 Target 🎯🏆 - 1049
⚠️ Stoploss ☠️🚫 - 933
⚠️ Important: Always maintain your Risk & Reward Ratio.
✅Like and follow to never miss a new idea!✅
Disclaimer: I am not SEBI Registered Advisor. My posts are purely for training and educational purposes.
Eat🍜 Sleep😴 TradingView📈 Repeat 🔁
Happy learning with trading. Cheers!🥂
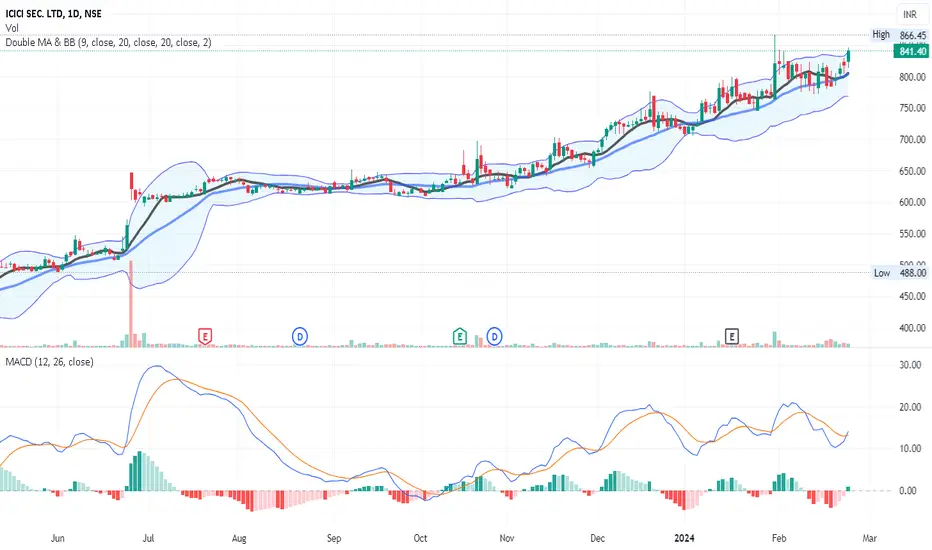
Breakout On D/W/M Chart - ISEC📊 Script: ISEC
📊 Sector: Stock/ Commodity Brokers
📊 Industry: Finance & Investments
Key highlights: 💡⚡
📈 Script is trading at upper band of BB and giving breakout of it.
📈 MACD is giving crossover .
📈 Double Moving Averages is giving crossover.
📈 Right now RSI is around 65.
📈 One can go for Swing Trade.
📈 Trendline Breakout on Daily chart.
📈 Rounding Bottom Breakout Soon on Weekly Chart.
📈 Rounding Bottom Breakout Soon on Monthly Chart.
⏱️ C.M.P 📑💰- 841
🟢 Target 🎯🏆 - 905
⚠️ Stoploss ☠️🚫 - 808
⚠️ Important: Always maintain your Risk & Reward Ratio.
✅Like and follow to never miss a new idea!✅
Disclaimer: I am not SEBI Registered Advisor. My posts are purely for training and educational purposes.
Eat🍜 Sleep😴 TradingView📈 Repeat 🔁
Happy learning with trading. Cheers!🥂
MACD Crossover - SUNTECK📊 Script: SUNTECK
📊 Sector: Realty
📊 Industry: Construction
Key highlights: 💡⚡
📈 Script is trading at upper band of BB.
📈 MACD is giving crossover .
📈 Double Moving Averages giving crossover.
📈 Right now RSI is around 61.
📈 There is Formation of Symmetrical Triangle breakout soon.
📈 One can go for Swing Trade.
⏱️ C.M.P 📑💰- 483
🟢 Target 🎯🏆 - 532
⚠️ Stoploss ☠️🚫 - 462
⚠️ Important: Always maintain your Risk & Reward Ratio.
✅Like and follow to never miss a new idea!✅
Disclaimer: I am not SEBI Registered Advisor. My posts are purely for training and educational purposes.
Eat🍜 Sleep😴 TradingView📈 Repeat 🔁
Happy learning with trading. Cheers!🥂
