Macdivergence

$PAMNYSE:PAM BCBA:PAMP ADR con RSI, MACD y Canal de Keltner. Si reacciona como lo viene haciendo en estas últimas ocasiones debería pegar una subida interesante luego de tocar el límite superior del canal. RSI cerca de cruzar el 70%. Aunque no me gusta lo que hace el MACD...

GOLD - XAUUSD Short/Sell Idea GOLD - XAUUSD Short/Sell Idea
waiting for a momentum (H1) candle close below 1380.0 to sell this one
Reason:
1- Regular Bearish Divergence on MACD (in red)
2- Objective Trendline (in blue)
3- Rejection/Resistance zone from Daily/Weekly
Three confluences are enough to consider Selling GOLD, after a break below 1380.0 (in black)

Descending Wedge BreakoutLooks like a Descending Wedge Breakout today; however, it is volume contingent... will be looking for heavy volume!

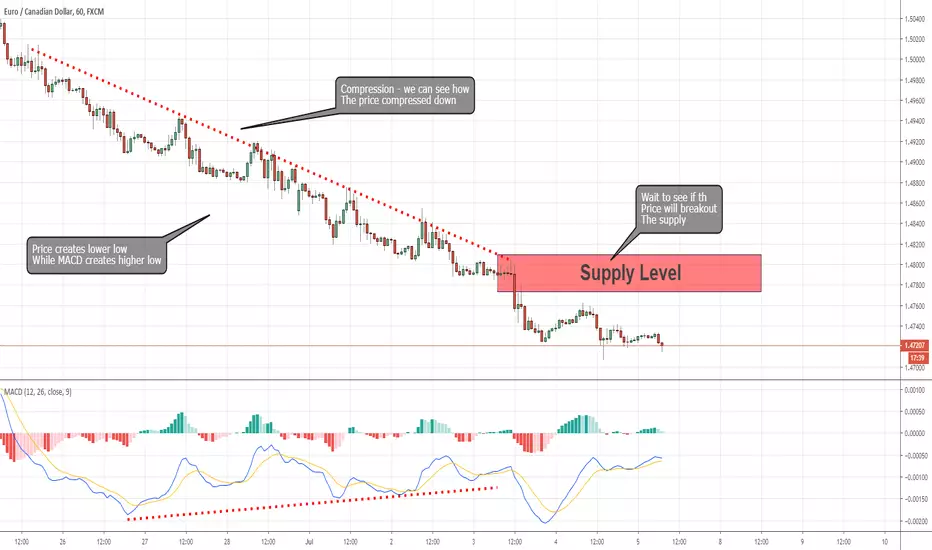
The Reason Why it’s Safer to Trade against CompressionToo Risky to Sell EUR/CAD with this Supply Above?
At any time frame, the EUR/CAD seems to be in bearish momentum.
In the H1 chart, the price is in a downtrend of almost 300 pips. While yesterday a fresh supply was created by the price above.
Most of this downtrend was a compression which meant that the price compressed down while picking up all the sell orders along the way.
Compression indicates a powerless movement in the price. In other words, it seems the last downtrend of the price was powerless and it’s safer to look for a reversal signal and trade against the compression.
Usually, a supply level is a great level for a sell position, but this supply is created after the price had already decreased about 250 pips and divergence has occurred between the MACD indicator and the price.
So, instead, I will use this supply as a confirmation zone and not as a level of sell position to sell this supply as is too risky now.
If the price will break out the supply, it will be a signal for reversal opportunity and we should look for a price action setup for a buy position.
Breaking out the supply above will change the momentum in the H1 chart from bearish to bullish.
Oil Continues Down Although Large Crude Oil Inventory FoundA significant Divergence Between MACD and Price Highs.
Yesterday, the OPEC succeeded to extend their agreement to cut production until 2020.
Also, The American Petroleum Institute (API) declared that they had found another large inventory of crude oil. Despite this good news USOIL price continues down.
In the H1 chart, there is a final drop from yesterday, which has now changed the bullish momentum to bearish.
The change happened after a significant divergence between the MACD indicator and the price highs, while the price created a higher high the MACD created lower high.
This change indicates that the downtrend has probably just begun and that we should look for an opportunity to sell USOIL. It seems the price tends to reach 52.00 zones.
For now, the correct level to sell USOIL is at the supply above and then the target should be at 52.00 zones which is the demand below.
This demand is also a great level to buy USOIL as a long term position. If the price breakout the demand and continues down, it indicates that the long term momentum has also changed to bearish.

Nice divergence to upside on CNX bought someCNX has this third bottom in place but MACD has diverged up, and prices moving up form the bottom. Options are few and far between as is common with lower priced stocks. Bought the stock 500 @ $7.14. Gonna see how this pans out, MACD says price should be at $7.42 or so. If we get close to $7.40 we'll sell.

GBPCHF Long/Buy IdeaGBPCHF Long/Buy Idea
waiting for a momentum break above 1.2470 to buy this one
Reason:
1- Regular Bullish Divergence on MACD (in red)
2- Long-Term Channel (in blue) and Short-Term Channel (in red)
3- Rejection/Support zone from Daily 1.2300
Three confluences are enough to consider Buying GBPCHF, after a break above 1.2470 (in black)

Three Reasons to Believe GBP/USD Remains BearishGBP/USD Price is Established Below The Annual Open Price
A few weeks ago, the GBP/USD price fell below the annual opening price, which became a significant resistance zone.
Since the after three unsuccessful attempts to breakout this resistance. The price reattempted to break the resistance against two days ago (25th June 2019). This time the daily candle ended as a bearish outside bar candlestick pattern, by engulfing the candle of the day before. This candlestick pattern is the first signal to look for a sell position.
In the 1H chart, there are two more signals to look for a sell position on GBP/USD.
The substantial divergence between the price and the MACD indicator – while the price creates higher highs on its way to reaching the resistance, the MACD creates lower highs.
When the price hit the resistance, then dropped down and created the outside bar pattern, it also creates a fresh supply, which is the right level to open a sell position if the price retraces there.
The three reasons that we think the GBP/USD remains bearish is because of the confluence of – bearish outside bar pattern, fresh supply, and the MACD divergence which create a reliable and strong setup for the sell position.
In the 1W and 1D charts, it seems that the price will remain bearish until it reaches the 1.2150 zone, which is a support zone.
Therefore, this support zone will be the target of this sell position.
This analysis is relevant for swing forex traders.

A little correction downit's clearly obvious that eur/usd is now on up trend after the last week candle closed above the weekly kigun and the chart is now flying over the kumo cloud , but the price arrived to a very important level : 1.1410 wich is level 1 on trend-based fibonnaci extension , so a correction is expected to the level 1.1230 ( the level 0.5 fibo of the first wave ) with a cofirmation of macd divergence in the 4h chart

FAZ MACD divergence to to the upside Looks like theres some room for move up. its a 3x ETF so buying the ETF rather than options.

PHM MACD divergence to downside reentry?PHM turned out to be a good divergence to the downside with a topping pattern May 17, 2019. A new top is in place but the MACD is diverging even lower indicating price should be around 31.5. Trying some June 21 expiration 31.5 puts at .27.

ADBE small double top MACD divergingSaw ADBE yesterday in this pattern MACD has been diverging down for some time. The MACD divergence indicates price should be at $275. OTM options are a taf expensive. June 21 expiration 267.6 puts are at 3.10. might be worth a couple of contracts.

Disney MACD divergence to downside on daily chartDIsney showing a modest downside MACD divergence on daily charts. MACD indicates price should be $130 ish gonna try a few June 21 , 2019 130 puts trading between .16 and .17. 15 minute MACD diverging down nicely too.


TRV monthly chart has a huge MACD divergenceThe MACD divergence on the long term chart of TRV indicates prices should be near the $128 level. The topping pattern forming on the daily seems to add credibility that this move is over. The daily chart closed near the low today and the MACD on daily is diverging down. Those who follow other time frames will note the weekly while in a large double top too of course, has no MACD divergence. No point in fighting the tide on TRV though. Will look at some puts tomorrow not too far out of the money.


FXE nice v-shaped double bottom and MACD diverging upThe May 24 expiration 107 calls are under a dime, spread is bit wide and the Mqy 31 expiration 107 calls again spread wide .16 - .20. Im gonna grab 100 shares of the ETF for a short term move and throw stops very tight just under $106

GLD double bottom and upside MACD divergenceGLD double bottom and upside MACD divergence in place, have picked up some MAy 31 expiration $121 calls at 0.42. MACD says price should be around $121.5.

PHM daily divergence on MACD to downsideReasonable pattern and the start of the downturn today I've nabbed a few of the May 24th 31.50 puts at .20 for quick trade

BIIB MACD divergence to upside with double bottomWatched this develop last few days some upside potential maybe left in this one the May 17, 2019 235 calls i looked at this morning at around $0.45 moved up to as high as $0.90 today.

Waiting For Reversal Signal At AUDJPY 19/05/19As we can see, the AUDJPY is in bearish momentum, the price went down almost 500 pips in that bearish momentum, also, we can see a clear divergence between MACD and the price, as we Know, that divergence indicates that the price losing power and the bearish momentum is about to end, now, besides the divergence, we waiting for the price to break out the resistance above and To create a new fresh demand, if that happened, it will be a great setup for buy position, the final target will be the supply at the top, which is also a great supply for sell position, that analysis Relevant for swing forex traders,

TGOD buy on the Daily MACD Divergence I see TGOD as a good longer term buy now that the MACD is Diverging on a daily basis while making a lower low.
