SPX: Weekly outlook! Best price to buy?Hey tradomaniacs,
welcome to another outlook of the S&P500!
Tuff times and volatile markets are giving Swingtraders hard times to trade the market.
On the other hand, we`ve seen much volatility and perfect preconditions for daytrading! :-)
The S&P500 as the "world index" should be on your watchlist to observe the market carefully!
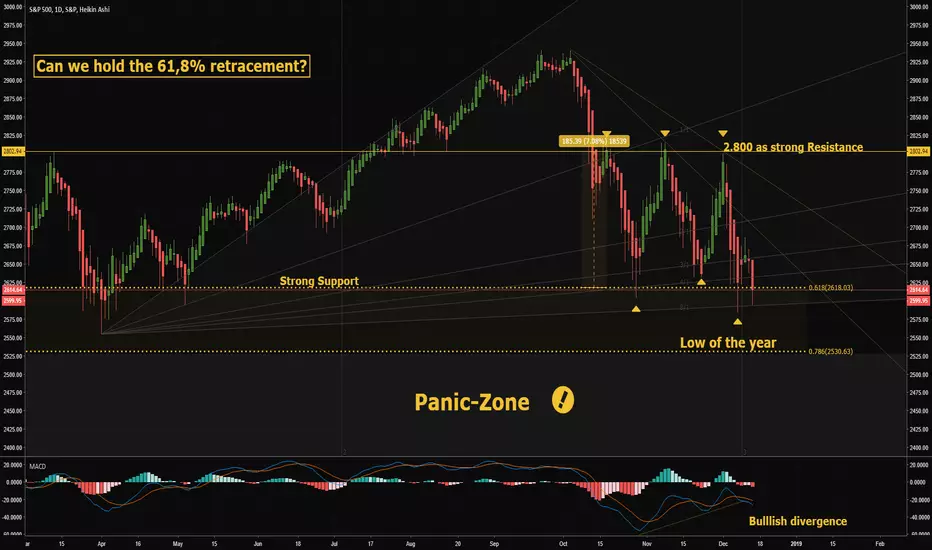
Will we crash? Or can we stay above the panic-zone?
SPX500 is currently dancing between 2.600 and 2.800 since 03. October!
With two rallys after the the Sell-Off the market was trying to get above the 2.800 but coouldn`t make it.
Every rally has got totally invalidated by the market due to uncertainity driven by news over news.
The MAC-D is showing us a "Bullish divergence", creating higher lows, while SPX lows are going sideways!
Overall we have seen more bearish commitment, it seems the market wants to safe profits as fast as possible.
The political situation is cooling down and relationship between China and teh USA seems to be headed in the right direction.
If cruide oil climbs, we could see more optimism and at least another try to break through 2.800!
Cann we holf 61,8% retracement and 2.600? We will see! :-)
I wish you a great start into the new week!
LEAVE A LIKE AND A COMMENT - I appreciate every support! =)
-----------------------------------------------------------------------------------------------
Peace and good trades
Irasor
Wanna see more? Don`t forget to follow me.
Any questions? PM me. :-)
Macdivergence
Short AUDCAD 12/7/18Link for confluence checklist:
www.dropbox.com
Chart View:
www.dropbox.com
Please share and critique. Always open to different perspectives.
Cheers!
SangNguyen
ig: NguyenTrading_

NZDJPY buy optionNZDJPY keeps its bullish trend, MACD with a divergence, and RSI near support level.
Comment your thoughts below!

Ethereum Hammering Out a Multicycle Low on the 240-minute and DaEthereum's 18-22 bar daily cycle has bottomed along with its 240-minute cycle (also averaging 18-22 bars in length).
The MACD and RSI (14) indicators reveal a pronounced bullish price/momentum divergence, and there's also a tiny double-bottom pattern evident.
There is a TON of overhead supply for ETHUSD to claw its way through before any sustained, bullish trend reversal is possible.
The first supply level is near 124.00 and then a much more substantial one is near 136.00. If a significant short-covering rally ensues, the higher level would be a great place to close out any recently entered long positions. If you're still short ETHUSD, then by all means consider covering some if not all of your short position asap.

A good long in EURUSDMACD shows divergence. It should follow the arrow. Don't jump into it because it can go still lower

Pump to 4740$ followed by a dump at towards 3470$— Bitcoin price movement hypothesis —
Two bullish divergences, one on MACD and another on RSI announce a potential imminent pump on Bitcoin. Those signals need to be validated by an important green candle crossing the EMA20. We can also find a bearish Gartley which will be validated by reaching the 4740$ price. Notice that there is a last high point resistance on that area.
At 4740 price will reverse (bull trap) and free fall into the target at 3470$.
For this hypothesis to confirm bulls need to push the price above the 4400$ resistance which VPVR and past supports mark it as a pain point to travel through.

USDCAD is ready to go downUSDCAD can go up slowly, but at some point it should do one movement down, give us a flag, sell and keep falling.
Don't miss this one

Indicator Review : MACDTechnical indicator: The MACD
What does it represent?
The MACD (Moving Average Convergence Divergence) indicator is one of the trend indicators. The MACD corresponds to the difference between two exponential moving averages of different periods (the most common are 12 and 26 days)
It is a complementary tool to moving averages that allows you to anticipate sales and purchase signals via the study of the crossover between the MACD curve and the signal line or discrepancies
How to use it?
Two ways to use it:
Study of crossings:
When the MACD line crosses the signal line upward, it is a buy signal. Conversely, when the MACD line crosses the signal line downward, it is a sales signal.
Study of divergences:
Deviations is another type of signal that can be detected using MACD curves. These signals, historically very powerful, make it possible to detect a possible significant reversal of the trend. A divergence is a technical term that describes the price of an asset that follows a trend opposite to that of an indicator.
In conclusion, the MACD it one of the most widely used trends indicators but it isn't self sufficient, you have to pair it with other such as CCI.

ES1!: Follow-up post from Bears be warnedJust want to highlight the negative MACD divergence in the ES1! to put in context the counter-trend rally I was talking about in the earlier post. Major market tops are usually marked by counter-trend rallies showing up as a lower high. Bears should bide their time and lick their chops when the lower high has materialized.
ES1!: Bears be warned. Over the longer-term, I am a bear as I tried to highlight in the Preponderance of Evidence chart fest. However, in the immediate time horizon, bears be warned as the ES1! nears ABCD completion at 2590 and we are starting the see the initial signs of a positive MACD divergence. We would need a a higher close to confirm the MACD divergence (new low is defined as a close flanked by at least 2 higher closes). Do remember, any up-move should be viewed in the context of a counter-trend rally as there is a bigger negative MACD divergence in the weekly charts.

USD JPY ShortLast weve for the correction. Also we can identify divergence in the MACD H1
If the price respect the current resistance we can enter with sell.

XRP The StandardXRP turned resistance to support on the daily after breakout and rally. Currently hitting resistance. Entering the trade on a retest of the support. Taking profits at previous resistances. Potential bull div on the daily MACD.
To Long or Short XRP with leverage:
www.bitmex.com

Time to go up in NZDUSD, don't you think so?We were going down for a long time here. It is time to do a correcction or a very good impulse to the top. MACD shows a lot of divergence. I do not think we will have another little down move, but it is possible

Reversal point in NZDUSDWe have one hour flag with no MACD divergence, that means continuation. Take this trade from the bottom and keep it until the daily top

One more drop in AUDCAD before reverseI thought we were going to go up this time, but this is going too slow. That means that probably we have another drop before the big upside

Bull's trend in Natural Gas is ready for its reversal
The recent uptrend in OANDA:NATGASUSD is ready for its reversal based on two bearish divergencies: RSI (relative strength index) and MACD. I also don't see much of volume which would support current enthusiasm of the bulls. Based on my observation of the OANDA:NATGASUSD almost over a year, the price level of 3.00 can be broken due to extreme weather conditions which are not expected in the foreseeable future.
It's time to open a long position in AMEX:DGAZ if you want to catch the downtrend.
I expect the level of 2.9 being tested next week.

Similar scenario from XRP's last bull runYou can see the similarities with the MACD divergence and the RSI reaching a possible bottom. If this is the case, we are looking at a possible bull run.
The only way this drops more is if BTC takes a crap. If BTC stays stable or moves up, we should see a move up.

Possible Short in GBP USDThe price have been testing a Daily trend line, also we can see that price are respecting a Daily support.
The MACD shown divergence. Considering this we can sell, Our target will be the next Daily support

ICX at all time low with a bullish divergence formingThis is the weekly chart and while there is not a ton of data on this seeing as it's relatively new, there is a bullish divergence being shown on the weekly chart. This also lines up with ICX being at an all time low from when it first came to market.
If BTC goes down, I'm sure there is room to go down well past this all time low, however, this chart independently looks like it could be a good long opportunity. Trade at your own risk and if you do, I'd suggest a stop loss 5-10% where you enter at this bottom as to not risk BTC crashing. This is not a day trading chart, this is a mid/long term outlook based on the weekly view.

ICC Labs - break-out Aug 21About: ICC Labs ICCLF
ICC Labs Inc., through its subsidiaries, produces and sells cannabis in Uruguay. It offers recreational cannabis, medicinal cannabis, cannabinoid extracts, and by-products for medicinal, recreational, and industrial use, as well as industrial hemp. The company is headquartered in Vancouver, Canada.
Blocked at the border?
Break-out Aug 21 on MACD, buylongselllong @MarxBabu, and CCI using 1 day chart.
Note for own use. Industrial HEMP & Cannabis stock, Uraguay?

EVIO Labs - buttoms upEVIO Labs is another micro small-cap cannabis lab test & research co.
Entry at $0.70 and getting bounce to T1 / T2 for exit. Not profitable
or I'd stay longer.
Gaining position. Targets both on Fib retracement unless something
changes. One of 3 approved test facilities in MA, and already in CA, OR,
and WA.

Oscillator Divergence Indicator by JDLimHow to apply the Oscillator Divergence Indicator by JDLim to your favourite oscillator.
1. Like the script "Oscillator Divergences by JDLim"
2. Add your favorite oscillator to your chart.
3. Apply the "Oscillator Divergences by JDLim" to that indicator.
4. Confirm the correct input source is selected.
5. Trade well and donate if you become successful :)
Link to indicator

BABA: Accumulate at bottom of channelBaba is like the Goog, it isn't going away and neither is China. Baba is less about international trade than it is a domestic play. Look for policy or fiscal support as the CCCP look to soften the Trump tariffs. Stock is trading at the bottom of the channel with a potential positive MACD divergence and should consolidate around current levels before testing the channel's upper boundary around the $210 level. Stops can be placed below the channel's lower boundary for a good risk reward trade.
