Short in USD JPYThe price are respecting the resistance of H4 and don't are showing new Highs, also we can identify divergence in the MACD.
If the price respect the resistance marked and the signal in MACD crosses we can enter with sell
Macdivergence

How to Simply Spot MACD Trend and Benefit from Histogram.Welcome back to my another Educational post.
I really do appreciate all support I got in my previous Educational material about MACD, so I am bringing you some more useful Education simply explained about MACD .
As I was doing my next Bitcoin Technical Analysis, I was looking a bit more into MACD and thought, I would explain to you a little bit more about how MACD works.
How trends are creating, when they start or end, what to consider as support or ressistance on fast lane, how to benefit from histogram.
Lets start with Histogram.
Its really all about those commas, lets start by splitting the histogram to two sides.
Positive - upper, when histogram is positive, fast lane is on buy signal.
Negative - lower, when histogram is negative, fast lane is on sell signal.
In simple histogram shows the overall volume which is in dominance, for example long positive comma represent strong buying volume in one specific timeframe.
Histogram also has his own support and ressistance levels.
You can also consider Histogram as wave indicator .
At Positive histogram, the tallest comma represent ressistance .
You can find ressistance when the next comma in uptrend is lower than previous, forming downtrend .
You can also find support at Positive histogram, basically when in downtrend is one comma taller than previous one , uptrend is being formed.
At Negative histogram its the same thing, just rotated .
So the tallest histogram comma represent that support was found forming uptrend .
When a next comma is taller than previous one, it means ressistance was found forming downtrend .
Lets follow it up by fast (blue) and slow (orange) lane on macd.
Fast lane is known as signal line.
When is fast lane is above slow lane, this gives a buy signa l and also the slow lane can be considered as support , and as you know each succesful test lead the price higher.
When fast is lane is below slow lane , this gives a sell signal and also the slow lane lane can be considered as ressistance , and as you know each unsuccesful test lead price lower .
MACD and Histogram are pretty close connected together as they are giving similiar signals, making signal easier to spot together.
When MACD lanes are high is harder for them to cross and give buy signal as i ncreasing demand is required , same is valid for low or oversold macd, its easier for low macd lane to give buy signal as less demand is required.
I think thats all important information about MACD for now , everything else should be explained on the chart with the help of Legend.
Hope you liked this Education about MACD and more close look on histogram and his purpose. None of this contect was copied, and its all written by me.
Hope I havent missed anything important , if yes point it in comments .
If I have learned you anything that you are able to benefit from and be a bit better trader , let me know by smashing that agree button , each like is very appreciated as I am doing this for FREE and it took me a LOT of time, Thanks a Lot !

EURNZD (Bat Pattern and Ending Diagonal) -1h ChartBat Pattern confirmations:
- A-B must touch 0.5, but cannot touch 0.618
- B-C must touch 0.618, but cannot exceed A (FIbo A-B) or just keep an eye on that 0.236
- D completion at 0.886 (Fibo X-A)
- Take profits at 0.382 and 0.618 (Fibo A-D)
- Third TP would be long term back to where it all started
Ending Diagonal confirmations:
- 5 clear points
- 2 clear consolidations
- 0 to 1 same distance as 4 to 5
- Double top at point 5
Daily analysis of EURNZD at related ideas (scroll down)
Good Trading. -1h Chart

USDMXN (Harmonic Pattern's inside consolidation) -1h ChartBat Pattern confirmations:
- A-B must touch 0.5, but cannot touch 0.618
- B-C must touch 0.618, but cannot exceed A (FIbo A-B) or just keep an eye on that 0.236
- D completion at 0.886 (Fibo X-A)
- Take profits at 0.382 and 0.618 (Fibo A-D)
- Third TP would be long term back to where it all started
Deep Crab Pattern:
- A-B leg can retrace anywhere between 0.382 up to 0.618
- B-C leg can retrace 0.382-0.886 of AB leg
- C-D is an extension of up to 1.618 of XA leg
- Take profits at 0.382 and 0.618 (Fibonacci D-C)
- Third TP would be long term back to where it all started
Cypher Pattern:
- A to B must touch 0.382 but cannot exceed 0.618
- B to C must touch 1.272 but cannot close below 1.414 (Trend-Based Fib Extension)
- C to D must touch 0.786 of X to C
- First TP at 0.618 of D to C (Fibonacci)
- Second TP at 0.382 of D to C (Fibonacci)
- Third TP would be back to where it all started
Gartley Pattern
- A-B must touch 0.618 but cannot touch 0.786
- B-C must touch 0.236 but cannot exceed A (on this case its at 0.382 unified gartley )
- D completion at 1.272 (Trend Extension) or 0.786 from normal measurement
- First TP at 0.618 (Fibonacci from D-C)
- Second TP at 0.382 (Fibonacci from D-C)
- Third TP would be back to where it all started
Total Pattern's:
2 Cypher
2 Bat
1 Unified Gartley
1 Deep Crab
We can see several patterns been completed inside this consolidation respecting each fibonacci retracement, at this point its forming a Bat Pattern going bearish for its D completion at 0.786-0.886 area or it could turn into an Alternate Bat Pattern, which it would retrace towards 1.13 (retest at trend), after Bat confirmation I expect bullish impulse towwards -0.27
Good Trading. -1h Chart

EURAUD (Deep Crab Pattern) -4h ChartConfirmations for Deep Crab Pattern:
A-B leg can retrace anywhere between 0.382 up to 0.618
B-C leg can retrace 0.382-0.886 of AB leg
C-D is an extension of up to 1.618 of XA leg
Take profits at 0.382 and 0.618 (Fibonacci D-C).
We can see there's a Double Top for higher high confirmation and bearish initiation, which MACD shows divergence as it doesn't have a double top inside the indicator, at this point I expect price to be bearish with a good risk/reward trade.
Good Trading. -4h Chart

Learn how MACD and Trendlines are Connected.Hey, I am back, this time with something, kinda unusual, and I dont know If you like this kind of stuff, but here is some education for you to make a better trading decision in your future!
Okay, so I would like to teach you a bit about MACD and how is this indicator connected to trendlines.
In this chart you can see three flags , each flag can be bullish or bearish.
But how do you know if a flag will be bullish or bearish?
Pretty simple and pretty hard in same way.
If a price breaks uptrend ascending ressistance it means breakout !
And if the price breaks ascending support level it means a breakdown .
This type of trading is called breakout trading.
But what makes flag, a flag? In simple.
Flag is a continuation pattern, they usually represent only brief pauses in a dynamic stock also they are typically seen right after a big, quick move , thats why we see so much flags in the Bitcoin charts, its a very quick and dynamic moving stock compared to others stocks, not cryptocurrencies.
Channel/flag, is formed by a ascending support level and ascending ressistance level.
Inside this channel you can spot tests on both support and ressistance level.
So lets now just go trough the chart chronologically and see how the MACD reacts to trendlines.
At first double top you can see the test of ressitance uptrend flag/channel.
This test was negative, you can spot that by histogram finding his top and starting to decline, same thing on "Point A".
As histogram is starting to decline ,Bitcoin is about to test a certain level, this time it is a ascending support level, you can spot it at first macd uptrend test where the histogram turned around and started to see buying volume increasing, this same is valid for each succesful uptrend test. After some tests of each ascending ressistance or support, when the price leaves this channel, its a prediction for a sharp move in a way, which was broken, for example broken ascending ressistance level would mean breakout.
After the first flag has broken out, steep uptrend were build , and succesful test of this steeper uptrend meant another wave of buyers p ushing price even higher, found ressistance at 6800, failed at testing second steep uptrend and found new channel.
In a second flag , Bitcoin is on selling wave , so for macd to give us buy signa l, Bitcoin would need to break ascending ressistance and that would give macd buy signal, its opposite as buying wave, while on buying wave you see rise in histogram which meant succesful test, here means the fall ( or rise from negative bottom if you will ) of histogram, Bitcoin finding support.
A fter Bitcoin has failed in the second flag breaking/testing the ressitance twice as macd suggest and also the ascending ressistance which wasnt overhelmed, the flag has seen a breakdown .
After breakdown Bitcoin found support and formed another uptrend , found new ascending ressitance and formed another flag, on this last flag, you can beautifuly see how is macd testing , each test represent an ascending support test on the chart, after 4 succesful test in a row, the flag has broken out and saw a breakout!
In short
MACD shows test of trendlines, ressistance, support.
When is MACD doing waves , or in another words blue riding on orange line, it means succesful test of uptrend , support and price of stock may continue to rise.
When Flag gets broken , heavy price action is ahead.
When uptrend is broken , usually downtrend is formed until stock finds support and from there form another uptrend.
The highest positive histogram tick represent finding ressistance , falling volume, headed to test support levels.
The lowest( or the longest if you will) negative histogram tick represent finding support and price headed to test ressistance for possible macd turnaround, on chart you can see two unsuccesful, which led to breakdown.
Hope you liked this Education about MACD and Trendlines connection and also some education about flags/channels.
Hope I havent missed anything important , if yes point it in comments.
I f I have learned you anything that you are able to benefit from and be a bit better trader , let me know by smashing that agree button, each like is very appreciated as I am doing this for FREE and it took me a LOT of time, Thanks a Lot!

GBPUSD (Gartley Pattern) -1h ChartConfirmations for Gartley Pattern
- A-B must touch 0.618 but cannot touch 0.786
- B-C must touch 0.236 but cannot exceed A
- D completion at 1.272 (Trend Extension) or 0.786 from normal measurement
- First TP at 0.618 (Fibonacci from D-A)
- Second TP at 0.382 (Fibonacci from D-A)
- Third TP would be back to where it all started
After Gartley is completed there could be some consolidation for bearish continuation towards -0.618, at this point i'll follow structure to confirm bearish continuation at that point.
Good Trading. -1h Chart

Bitcoin ETF bullocksHey there,
So about this spike last nigt in bitcoin and people talking about an ETF decicion tomorrow, I have some bad news for you...it is not going to happen according to what I see in my graph.
Here you can see the BTCEUR graph, iI know it is in Euros but IM from Holland and I just love the BTCEUR on coinbase graph because it is verry acurate in terms of trendlines and fibbonachi numers. But you have to see that for yoyrsel I guess.
Anyway back to the graph...we can see a big spike from last night, unfortunally bear clouds are already packing over bitcoin as you can clearly see that both the RSI and MACD are already gearing up for huge bearish divergence on the houly graph.
This, coupled wit that rathergood looking invertred head and shoulders pattern gives us a reasonable target of around 6150 euro. Here is also a horizontal recistance (yellow line) that has been tested for three times now.
This horizontal line is also just short of the 0.5 fibbonachi retracement of the entire move down.
Looking at the combined package of the brearisch divergence in both indicators, the three times tested horizontal recistance line, tagret of the inverted head and soulders pattern and the 0.5 fibbonachi retracement level i doubt the bulls can push it much higher then 6150 (maybe a spike to the 0.5 retracement but thats it). So this is the level where im going to put my sell order.
I know this is the BTCEUR graph and we mostly see BTCUSD here on TradingView, but as i said before, I find that the BTCEUR on coinbase is verry accurate in terms of trendlines, fibbonachi levels and so on. Just give it a try for yourself or copu these ideas in a BTCUSD graph and see for yourself.
I will uptade this idea with a donwards target after my initial target of 6150 euros has been hit.

Posible buy ?Posible buy? macd divergence detector have buy signal and rsi divergence detector
what do you thing?
testing indicators...

Ford come back .. Fast money I expect a reversal both short and long term for Ford. Way too cheap. Also a decent dividend stock. May soon break out of a 15 minute triangle.. cheap options NYSE:F may be a good buy.

Dollar Index (Bearish Impulse) - DailyMajor Head & Shoulders is in formation for Right Shoulder to be completed at 0.618 of the entire bullish impulse, which is also retracement 0.382 of the Deep Bat Pattern (Alternate Bat)
Alternate Bat Pattern confirmations:
- A-B must touch 0.5, but cannot touch 0.618
- B-C must touch 0.618, but cannot exceed A (FIbo A-B) or just keep an eye on that 0.236
- D completion at 1.13 (Fibo X-A)
- Take profits at 0.382 and 0.618 (Fibo A-D)
MACD shows huge divergence at Higher High for bearish movement.
Good Trading. - Daily Chart

Looks like ETH has hit bottomEthereum's price action looks to be bottoming out at a psychological support of $430. Heiken ashi is showing a possible trend reversal in the next few hours. While from our oscillators we have a divergence from MACD and a much stronger one from RSI. Bollinger Bands are also showing a weakening trend by price consistently failing to hit lower band. We very well could be in for a trend change on ETH. As a trader, I would recommend waiting for a more confirmation such as price breaking the upper resistance band on high volume or MACD to cross center line. Either way, rest of the day looks green for ETH if it can maintain current support level.

ETP double top DALY CHARTETP is forming a double top chart pattern ( bearish ) and bearish divergences in histogram. MACD is about to cross bearish , rsi just left the overbought zone.
I assume a retracement to 200 ema line is likely, which would mean about 20% decline in price.

Short, MACD DivergenceMACD divergence.
Price seem to lose momentum as it goes higher, possibility of a good sell opportunity on the 1H time frame.
This Short opportunity is also supported by the rising wedge within the larger downwards trend.
Probable long on 15MIN time frame to reach resistance line, however, strong breakdown of price on 03July indicates a short on the correction.


ICONic Divergence for ICX in RSI MACD StochIm playing an RSI divergence trade which has been working really well lately.
For more on this RSI strategy, please see the related link below... RSI and crypto trading.
Entry at 1.63
Stop at 1.41
Target at 2.16 OR
whichever happens first, the price when RSI reaches 60, OR the 100 MA.
If target approaches, and I can catch it, I will move stop trail it instead of exiting exactly at 2.16. While I know the risk, the target can fluctuate on these counter trend RSI trades.
This trade, if correct, will net about 2.4R
questions or comments, let me know. likes are appreciated.
Travis
JMJ - UIOGD

BTC inverse HnS forming, reversal?Welcome to my BTC analysis.
The MACD looks bearish , it's nearing the upper resistance. Also the RSI is looking a bit bearish. BTC is approaching the 0.236 fib and the neckline of the white HnS. They will probably let Bitcoin drop to finish the E wave of it's pennant. Then I expect a run to around 7500-7650. Hopefully it will break through the neckline of the inverse HnS. I will give some updates when it happens.
This is not a recommendation to buy/sell.
(I'm posting this again because the other chart was XBT)

$XGTILooks like a good runner, MACD cross, and volume coming in. Should see $2.00 by end of the run!

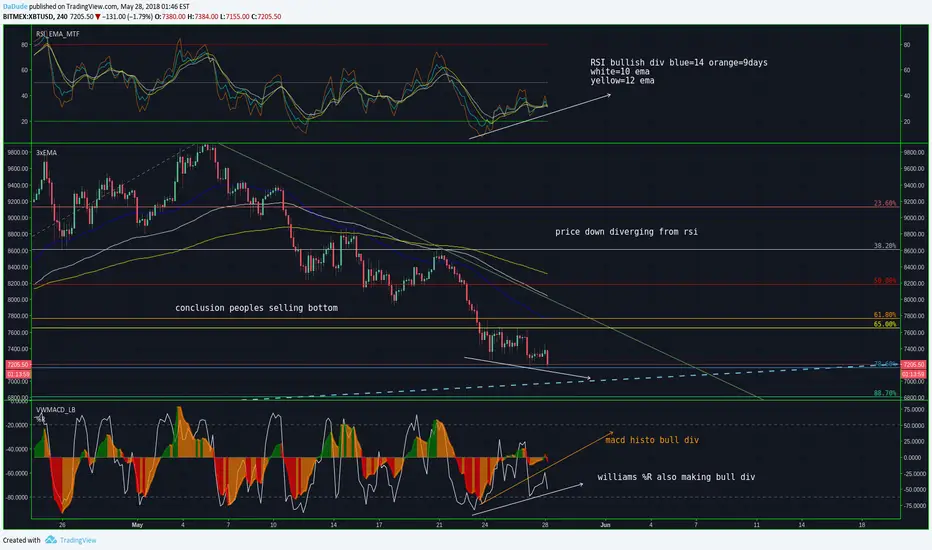
Bitcoin, selling bottoms, here's whyThis is why in my opinion people are fooled by emotions and fud news into the bags of accumulators
I appreciate constructive feedback
IOTA Buy with DivergenceHi,
I published IOTA in the middle of April and price broke out of its base shortly after and commenced a nice uptrend with an 80% return at its peak. After trading strongly it finally broke down in early May and has now consolidated and looking good for a buy again.
Note the bullish divergence formed on MACD and RSI. These support a possible break above the falling resistance line as shown on the chart.
A buy signal would be on close of price above the trendline. Don't buy until after the break is confirmed.
A good short term target would be 80% of the way back to the recent high around $2.4. Stop below the recent low around $1.56 for a Risk/Reward of ~2.
Good luck and good trading!

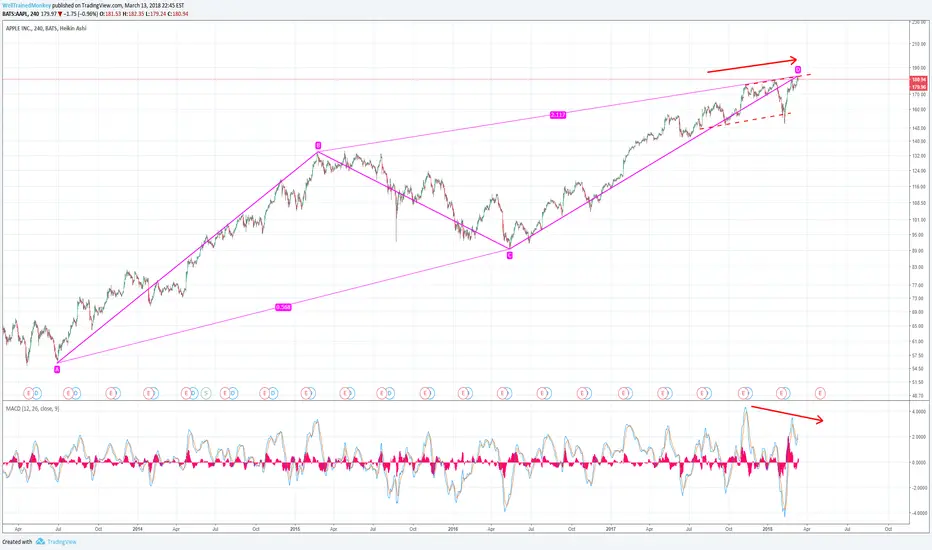
AAPL: High risk reward shortWow, lots to unpack on AAPL...
#1 A big ABCD completion from Jun'2013
#2 Price action hitting the upper bound of a channel from Jul'2017. Not to mention it is a 100% extension from the Nov'2017 to Feb'2018 ABC sequence
#3 Negative MACD divergence and price action
Stops can be set slightly above the top of the near-term channel with downside targets $148 (38.2% retracement) to $137 (50% retracement). If you are an Apple lover, you could also set up a straddle in case the channel breaks on the upside and the trend accelerates into an extended CD leg (c.$196 for 138.2% extension).
ICX Bull RunOn the 4H chart we have an almost perfect bounce off the 0.618 Fib retracement with an outlook to the 1.618 extension. Once it breaks the string resistance, i'll be looking to get in.

Huge Head and Shoulders Inverse6 mo long inverse HS, measure rule implies PT just high enough to fill gap (≈100% higher than now)
Be on watch may retrace to lower NL level before actually breaking out.
Momentum initiated as + on weekly interval today and monthly less negative.
